. 2024 Nov 21;14(1):28915.
doi: 10.1038/s41598-024-80469-0.

Ultra-weak photon emission from DNA

Affiliations

Ultra-weak photon emission from DNA

Mariusz Pietruszka et al. Sci Rep. .

Abstract

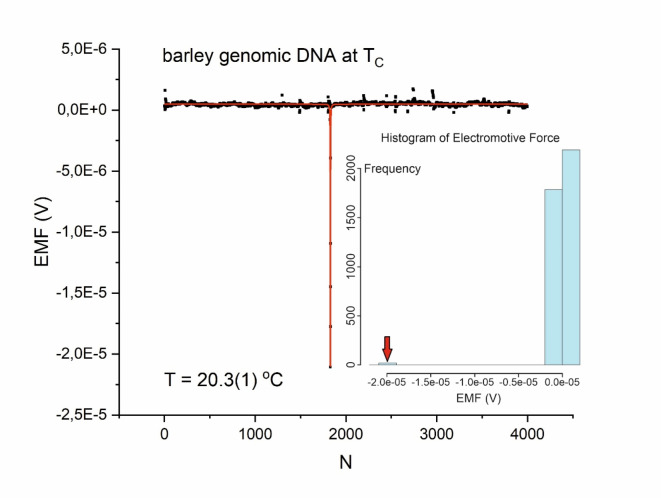
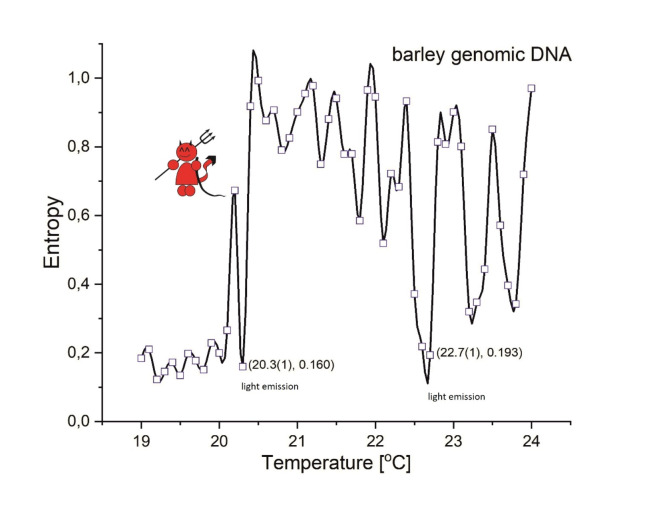
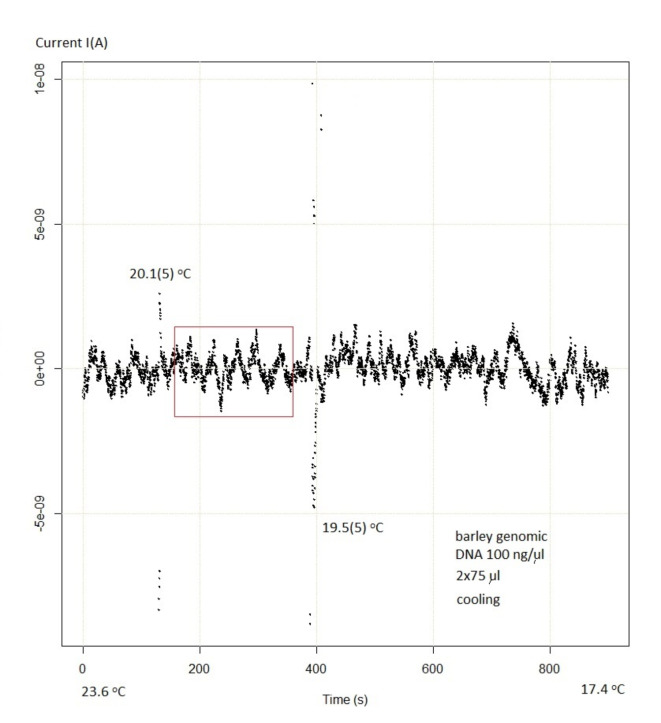
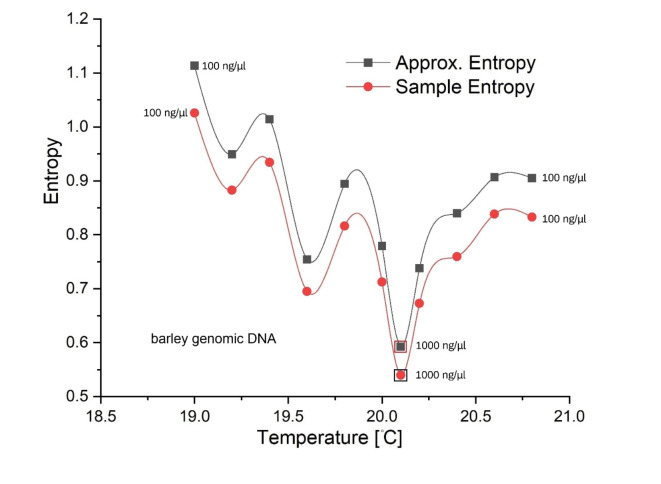
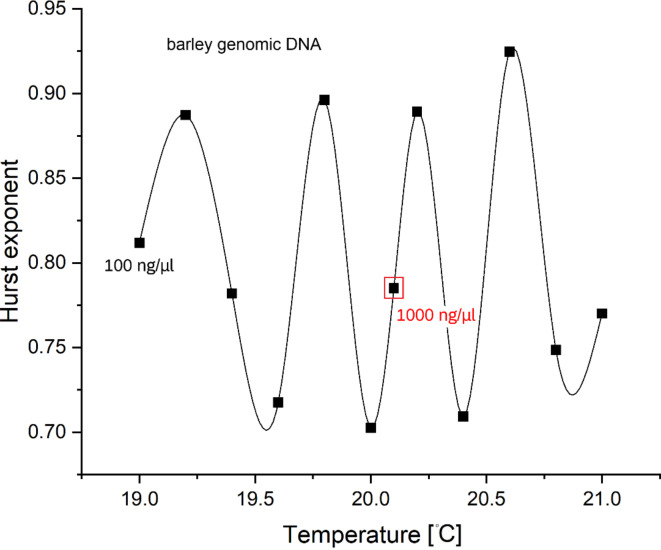
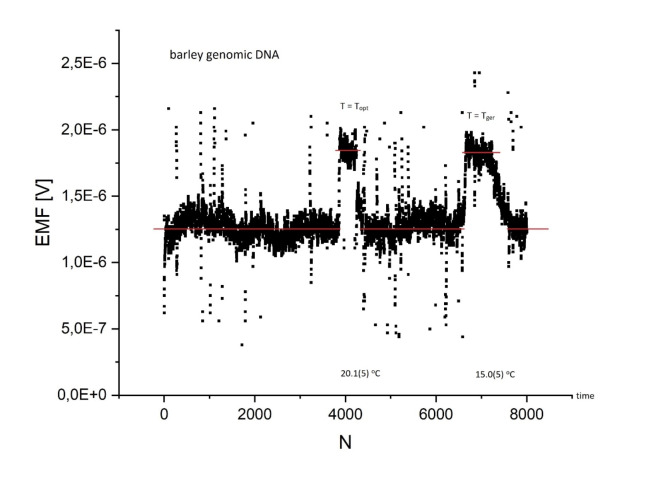
It is conventionally believed that macromolecules found in living cells, including DNA, RNA, and proteins, do not exhibit inherent light emission. However, recent studies have challenged this concept by demonstrating spontaneous light emission from nucleic acids under certain conditions and physiological temperatures. By noninvasive monitoring of barley genomic DNA and advanced statistical physics analyses, temperature-induced dynamic entropy fluctuations and fractal dimension oscillations were identified at a key organizational threshold. The study revealed evidence for non-equilibrium phase transitions, a noticeable photovoltaic current jump at zero bias voltage, and a proportional increase (scaling) of the photoinduced current corresponding to increasing amounts of DNA. In addition, we estimated DNA's energy production rate at criticality and introduced an interferometer using coherent light emissions from the DNA-water interface. These findings suggest that DNA is a major source of ultraweak photon emission in biological systems.

Keywords: Barley; Dynamic entropy; Hurst exponent; Interference; Light quantum; Photovoltaic current; Time series; pH.


Conflict of interest statement

Declarations. Competing interests: The authors declare no competing interests.

Figures

Fig. 1
Fig. 1
The electromotive force (EMF) of barley genomic DNA at 20.7(1)°C and pH 8.3, i.e., beyond a phase transition. (A) Detrended original data as a function of time and (B) histogram (Gauss) of the EMF beyond a phase transition (formula image).
Fig. 2
Fig. 2
The electromotive force (EMF) of barley genomic DNA at 20.3(1)°C and pH 8.3 was interpolated with the Lorentz resonance curve (R2 = 0.81426)—Inset Histogram of the EMF at the critical point formula image. formula image denotes the measurement number; the sampling frequency was 4.1 Hz. The mean bias for the first 501 data points is 4.0E-7 V with a standard deviation of formula image 1.0E-7 V, resulting in a narrow peak of approximatelyformula image intensity (amplitude) at formula image (see also Figure S1). The peak can be associated with radiative decay – the emission of photons from excited states.
Fig. 3
Fig. 3
The calculated dynamic entropy of barley genomic DNA at pH 8.3 as a function of temperature (double-drop experiment, bridge closed). The plot shows the results obtained from 4000 real numbers in each experimental time series (and the corresponding temperature) using an approximated entropy procedure in the R programming language. The plot is interpolated with cubic splines and highlights a low-entropy (oscillations) area on the left, a high-entropy void in the middle, and (developing) high-amplitude entropy oscillations to the right. The two main low-entropy peaks are labeled with their respective coordinates. The plot is based on 200,000 measurements at 4.1 Hz sampling; the temperature resolution was 0.1 °C. A Maxwell demon that uses information about a system to reduce its entropy to gain work is symbolically presented in the plot. The light emission is indicated at the pronounced local minima following Fig. 2, and earlier observations.
Fig. 4
Fig. 4
The relationship (linear scaling) between the DNA-light-induced photovoltaic current and the volume of the barley genomic DNA samples. The line of best fit has an adjusted R-squared value of 0.99856. The equation for the (current) line is formula image, where formula image is the intercept and formula image is the slope, which is approximately 9%.
Fig. 5
Fig. 5
Coherent state, (expectation value) of the photon-induced current, as a function of time showing the quantum fluctuations (frame). The fluctuations (corresponding to the line thickness) are always the same, such that the field is as close to a classical field as possible for any quantum state (compare with Fig. 3.3 in Ref.). A light field has its highest degree of coherence (laser action) when its corresponding interference pattern has maximum contrast on the screen. The interferometric (wavy) pattern was obtained in the double-drop (bridge open) experiment (compare with Fig. 4 in Ref.). Upon cooling with cold water to the physiological temperature range, the genomic DNA of barley induces a photovoltaic current (detrended data) that exhibits (coherent) sinusoid-like characteristics (frame) and enhanced oscillations (peaks) at critical temperatures (see also Supplementary Figure S4 and Movie 1). The signal is smeared out (fuzzy) at 17.4 oC. The “coherence time” (frame) equals ~ 25 s and depends of the rate of temperature change.
Fig. 6
Fig. 6
Dynamic entropy of barley genomic DNA was calculated for a double-drop experiment (see Figure S4, bridge open) using approximate and sample entropy procedures in R. The DNA concentration was 100 ng/µl, except for one point (indicated) at a global minimum (1000 ng/µl) where both minima coincide. Cubic splines interpolate data.
Fig. 7
Fig. 7
Hurst exponent (formula image) against the temperature of barley genomic DNA computed for a double-drop experiment (see Figure S4, bridge open) using R programming language procedure. Through the relation formula image, the plot can be interpreted as temperature-dependent fractal dimension (formula image) oscillations. The DNA concentration was 100 ng/µl, except for one additional point (1000 ng/µl, indicated) showing a good fit between neighboring points. Cubic splines interpolate data.
Fig. 8
Fig. 8
Detrended data of an electrical current time series, the Hilbert transform, computing of the embedding dimension (Takens theorem), and the reconstructed phase space of 100 ng/µl barley genomic DNA.
Fig. 9
Fig. 9
Barley genomic DNA in the presence of a ~ 0.2 T magnetic field. (A,B) The current as a function of time at about formula image – photon emission/absorption peak is visible. It can be, e.g., explained by the oscillatory resonant quantum state in DNA nucleotides. (C, D) The current above formula image.
Fig. 10
Fig. 10
The electromotive force of barley genomic DNA (concentration 100 ng/µl): recording the spontaneous light signal (light intensity formula image as a function of time, see also Fig. 8.2 in Ref.) , showing moments of quantum leaps and long-lived coherence at critical temperatures during cooling (27.5–14.9 °C) with ice water.

References

    1. Blasone, M., Jizba, P. & Vitiello, G. Quantum Field Theory and Its Macroscopic Manifestations. Boson Condensation, Ordered Patterns and Topological Defects (World Scientific & ICP, 2011).
    1. Landauer, R. Information is physical. Phys. Today. 44, 23–29 (1991).
    1. Quan, H. T., Wang, Y. D., Liu, Y., Sun, C. P. & Nori, F. Maxwell’s demon assisted thermodynamic cycle in superconducting quantum circuits. Phys. Rev. Lett.97, 180402 (2006). - PubMed
    1. Masuyama, Y. et al. Information-to-work conversion by Maxwell’s demon in a superconducting circuit quantum electrodynamical system. Nat. Commun.9, 1291 (2018). - PMC - PubMed
    1. Pietruszka, M. & Marzec, M. Proton-polarized states in DNA. Biosystems10.1016/j.biosystems.2024.105125 (2024). - PubMed

LinkOut - more resources