. 2025 Jan;28(1):40-48.
doi: 10.1038/s41593-024-01801-5. Epub 2024 Nov 21.

Tau filaments are tethered within brain extracellular vesicles in Alzheimer's disease

Affiliations

Tau filaments are tethered within brain extracellular vesicles in Alzheimer's disease

Stephanie L Fowler et al. Nat Neurosci. 2025 Jan.

Abstract

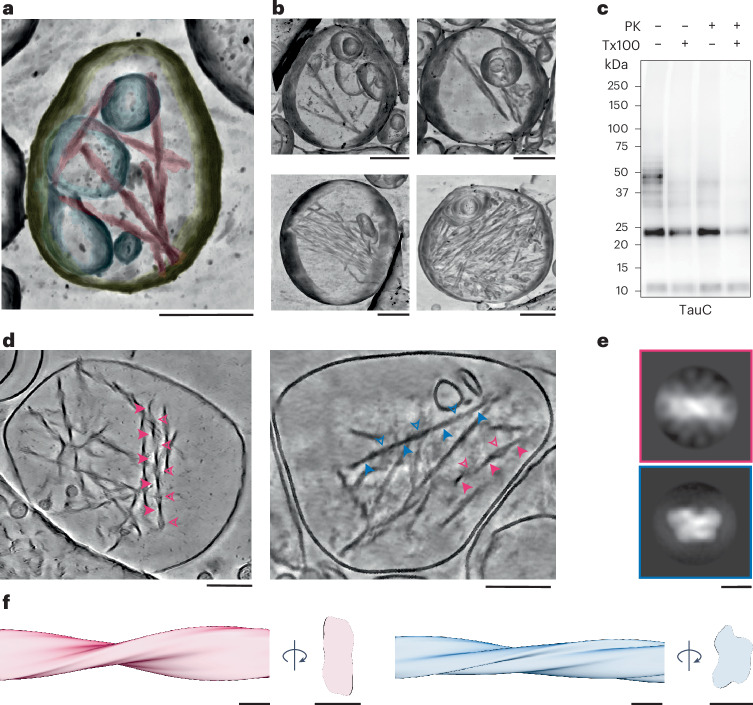
The abnormal assembly of tau protein in neurons is a pathological hallmark of multiple neurodegenerative diseases, including Alzheimer's disease (AD). Assembled tau associates with extracellular vesicles (EVs) in the central nervous system of individuals with AD, which is linked to its clearance and prion-like propagation. However, the identities of the assembled tau species and EVs, as well as how they associate, are not known. Here, we combined quantitative mass spectrometry, cryo-electron tomography and single-particle cryo-electron microscopy to study brain EVs from individuals with AD. We found tau filaments composed mainly of truncated tau that were enclosed within EVs enriched in endo-lysosomal proteins. We observed multiple filament interactions, including with molecules that tethered filaments to the EV limiting membrane, suggesting selective packaging. Our findings will guide studies into the molecular mechanisms of EV-mediated secretion of assembled tau and inform the targeting of EV-associated tau as potential therapeutic and biomarker strategies for AD.


Conflict of interest statement

Competing interests: K.E.D. is a board member of Ceracuity, Inc. The remaining authors have no conflicts of interest to declare.

Figures

Fig. 1
Fig. 1. Proteomic characterization of EVs from brain tissue of individuals with AD.
a, Representative immunoblot of total homogenate (T) and EV fractions 1–8 isolated from the brain tissue of individuals with AD using antibodies to annexin A2, flotillin 1, CD81, LAMP2, VDAC1 and lamin A/C; n = 5. b, Principal component (PC) analysis of quantitative mass spectrometry of EV fractions 1–8 from human AD brain samples. Symbols denote different cases; n = 8 for fractions 1–7 (F1–7) and n = 5 for fraction 8. Ellipses indicate 68% confidence intervals. c, Gene Ontology pathway enrichment analysis of quantitative mass spectrometry of grouped EV fractions 1–3, 4–6 and 7 and 8. Each column represents an individual case; n = 8. Per row scaled single-sample gene set enrichment analysis (ssGSEA) enrichment scores are shown; BP, biological process; MF, molecular function; CC, cellular component; PM, plasma membrane; b/w, between; TCA, tricarboxylic acid. d, Enriched biosynthetic subcellular localization of enriched proteins in each EV group using the SwissBioPics animal neuronal cell. Source data
Fig. 2
Fig. 2. Mass spectrometry and immunoblot analyses of tau protein associated with EVs from the brains of individuals with AD.
a, Schematic of the longest 2N4R tau isoform (441 amino acids) with epitopes shown for antibodies Tau13, HT7, TauC and PHF1 (anti-phospho-S396 and phospho-S404). The tau N-terminal inserts (N1 and N2), proline-rich regions (P1 and P2) and repeats (R1–R4) are shown. b, Tau peptides identified by quantitative mass spectrometry in EV fractions 1–8. Imputed, normalized and summed tau peptide label-free quantification intensities are shown. c, Representative immunoblot of total homogenate (T) and EV fractions 1–8 isolated from the brains of individuals with AD using antibodies Tau13, HT7 and TauC. Total protein loading control was visualized using a stain-free gel; n = 8. d, Representative immunoblot of total, sarkosyl-soluble and sarkosyl-insoluble fractions of pooled EV fractions 1–3, 4–6 and 7 and 8 from the brains of individuals with AD using antibody TauC; n = 3. Source data
Fig. 3
Fig. 3. Cryo-ET of EVs containing tau PHFs and SFs from the brains of individuals with AD.
a, Denoised tomographic volume and segmentation of an EV from the brain of an individual with AD depicting the limiting membrane (yellow), internal vesicles (cyan) and tau filaments (magenta). b, Denoised tomographic volumes of EVs from the brains of individuals with AD containing varying numbers of tau filaments. c, Representative immunoblot of EVs from the brains of individuals with AD from fractions 4–6 using antibody TauC with (+) or without (−) 0.1% Triton X-100 (Tx100) and 0.5 ng µl–1 proteinase K (PK); n = 3. d, Denoised tomographic slices of EVs from the brains of individuals with AD containing tau filaments. Arrows point to the minimum (filled arrows) and maximum (unfilled arrows) widths of tau PHFs (magenta arrows) and SFs (blue arrows). e,f, Subtomogram averaged maps of tau PHFs (magenta) and SFs (blue) in EVs, shown as central slices perpendicular to the helical filament axis (e) and three-dimensional (3D) volumes encompassing one helical crossover (f). See also Extended Data Fig. 7c,d; scale bars, 200 nm (a, b and d) and 10 nm (e and f). Source data
Fig. 4
Fig. 4. Tau filaments are tethered to the limiting membrane of EVs from the brains of individuals with AD and are decorated by additional densities.
a,b, Deconvolved tomographic slices of EVs from the brains of individuals with AD showing tethering of the ends of tau filaments to the luminal side of the limiting membrane (a) and lateral filament contacts between filaments and with internal vesicles (b). The magenta asterisks indicate filaments, the yellow arrows point to the limiting membranes of EVs (a) and internal vesicles (b), and the orange arrows point to densities tethering the ends of filaments to the luminal side of the limiting membrane. c, Representative immunoblot using antibody TauC showing total EVs, proteins liberated from the EV surface following a dithiothreitol (DTT) wash (Surface), sedimented material (Pellet; not associated with membranes), DTT-washed EVs (Washed EVs), luminal proteins following resuspension of DTT-washed EVs in hypotonic buffer (Luminal) and the sodium carbonate-treated membrane-associated fraction (Membrane); n = 3. d, Deconvolved tomographic slices of EVs from the brains of individuals with AD showing additional densities decorating the lengths of tau filaments. Orange arrows point to additional densities; scale bars in a, b and d indicate 200 nm. Source data
Fig. 5
Fig. 5. Cryo-EM structure of EV-derived tau PHFs from the brains of individuals with AD.
a, Cryo-EM map of tau PHFs from EVs derived from the brain tissue of individuals with AD viewed aligned to the helical axis. See also Extended Data Fig. 8a–g. b, Cryo-EM map (transparent gray) and atomic model (magenta) of tau PHFs from EVs derived from the brain tissue of individuals with AD, shown for a single tau molecule per protofilament perpendicular to the helical axis. Additional densities coordinated to the side chains of R349 and K375 are indicated with arrows. c, Magnified view of the cryo-EM map (transparent gray) and atomic model (magenta) showing the additional density, indicated with an arrow, coordinated to the side chains of R349 and K375. Four tau molecules are depicted aligned to the helical axis. d, Overlay of the tau filament folds from EVs (magenta) and the cellular fraction (cyan) from the brains of individuals with AD. See also Extended Data Fig. 8h.
Extended Data Fig. 1
Extended Data Fig. 1. Quantitative mass spectrometry proteomics of EVs isolated from AD patient brain.
Proteins are listed on the right-hand side and their Log2 protein intensity is shown for each fraction (F) 1–8. Proteins are grouped into categories according to Ref. . n = 8 patients.
Extended Data Fig. 2
Extended Data Fig. 2. Tau seed competency and NTA characterisation of EVs isolated from AD brain.
a, Representative FRET gating strategy for the Tau RD P301S FRET Biosensor cell line treated with 3 μg pooled neurologically-normal control and AD EVs. Positive tau seeding is indicated by the presence of BV510 fluorescence signal in the FRET gate. Colour scale indicates the log density of measured event abundance. b, Integrated FRET density (% cells in the FRET gate multiplied by the mean fluorescence intensity of the BV510 signal) of cells incubated for 48 h with 3 μg pooled neurologically-normal control and AD EVs, n = 4. Data are means of triplicate technical replicates, two-tailed unpaired t-test. c, Representative immunohistochemistry images of PS19 mouse hippocampal fields using anti-tau antibody AT8 (phospho-ser202 and -thr205 tau) two-months post stereotaxic injection of pooled EV fractions isolated from neurologically-normal control brain and AD brain into the DG, n = 3. Scale bar, 100 μm. d, Quantification of the mean AT8 intensity in the DG and the CA2/CA3 hippocampal fields of PS19 mice injected with EVs from CT and AD brain, n = 3, two-tailed unpaired t-test. e, Nanoparticle tracking analysis (NTA) of total number of EVs per fraction 1–8. Data are expressed as billions of particles per mg brain tissue, one-way ANOVA with Dunnett’s post-hoc to F1. f, NTA analysis of the relative proportion (%) of EVs assigned to the depicted diameter bins for each fraction 1–8. g, NTA analysis of EV diameter for each fraction 1–8 normalised to the mode of each distribution. D10 (F1-F7: 92.5 nm, F8: 97.5 nm) and D90 (262.5 nm for all fractions) values are means of each value across all fractions. h, NTA analysis of EV diameters expressed as the mode of each fraction 1–8 for each donor. Box plot centre lines indicate the mean value, lower and upper hinges represent the first and third quartiles, and whiskers extend from the hinges to a maximum of 1.5X the interquartile range, one-way ANOVA with Dunnett’s post-hoc to F8. e-h, n = 8 human donors for F1-F7, n = 5 for F8, means of triplicate technical replicates were plotted for each donor. b,d,e-g, Data are presented as mean values +/− SEM. b,d,e,h, p-values are shown above data points.
Extended Data Fig. 3
Extended Data Fig. 3. Cell type marker proteins identified in human AD brain EVs.
a, Number (left) and percent (right) of cell type marker proteins identified in the full EV dataset. The most number of cell type specific proteins were identified for astrocytes, neurons, microglia and oligodendrocytes, however, we detected between 30–40% of total known marker proteins for all cell types except pericytes and VLMCs (vascular and leptomeningeal cells). b, The top three discriminatory marker proteins for each cell type displayed across fractions F1-F8. Cell types are ordered according to the mean log2 protein intensity detected across all fractions for the 3 marker proteins. c, Mapping of AD brain co-expression modules onto AD brain EV fractions. Modules are ordered in the heatmap according to the mean ssGSEA enrichment score across all density fractions. Where overlap of module proteins with known cell type markers was significant, the cell type and significance of overlap is reported on the left of the heatmap.
Extended Data Fig. 4
Extended Data Fig. 4. Characterisation of EVs isolated from the media of HEK cells expressing full-length assembled tau.
a, Confocal imaging of HEK293T cells expressing P301S 1N4R tau fused to YFP (tau-YFP) immunolabelled using an antibody against YFP, representative n = 3. The seeded cell line was generated by the addition of tau PHFs isolated from AD human brain tissue. Scale bars = 10 μm. b, NTA of EVs isolated from seeded tau-YFP HEK293T cells. Mode diameter = 117.5 nm, D10 = 87.5 nm, D90 = 252.5 nm. Data are presented as mean values +/− SEM of 4 technical replicates, n = 1. c, Immunoblot of seeded tau-YFP HEK293T cell lysates and EVs isolated from culture media of seeded tau-YFP HEK293 cells using the anti-tau antibodies TauC and Tau13, and antibodies against CD81, annexin A2 (ANXA2), LAMP1, EEA1 and actin, n = 2. Source data
Extended Data Fig. 5
Extended Data Fig. 5. Characterisation and co-purification controls of human brain derived EVs.
a, Representative immunoblots of EV fractions 1–8 isolated from AD brain using antibody PHF1 (phospho-S396 and -S404 tau). n = 3. b, Representative immunoblots of EV fractions 1–3, 4–6 and 7-8 isolated from AD brain using antibodies against phospho-T217 and phospho-S422 tau. n = 3. c,d, Representative immunoblot using antibody TauC (tau repeat region; c) and corresponding stain-free total protein loading control (d) of AD and control brain homogenates (total); PHFs extracted from AD brain; pooled EV fractions 1–3, 4–6, and 7-8 from AD and control brain, with and without spiked PHFs extracted from AD brain; and the pellet following EV fractionation (P). n = 2. Source data
Extended Data Fig. 6
Extended Data Fig. 6. Cryo-EM of extracellular vesicles isolated from Alzheimer’s disease patient brain.
a, Cryo-EM images of morphologically-distinct EV populations in fraction 1, pooled fractions 4–6 and fraction 8 from an individual with AD. Electron-lucent EVs were observed in all fractions. Electron-dense EVs and electron-lucent EVs with cristae-like features were only observed in fraction 8. EVs associated with tau filaments were only observed in pooled fractions 4–6. Magenta arrows indicate examples of PHF-like filaments and orange arrows indicate examples of cristae-like features. Scalebar, 500 nm. b, Deconvoluted tomographic slice of an EV from fraction 8 with cristae-like features. Orange arrows indicate cristae-like structures and blue arrows indicate membrane invaginations at the necks of cristae-like structures. Scalebar, 200 nm. c, Representative dot blots of the sarkosyl-insoluble fraction of pooled EV fractions 4–6 from AD patient brain using antibodies TauC and MC1.
Extended Data Fig. 7
Extended Data Fig. 7. Cryo-ET of extracellular vesicles containing tau PHFs and SFs from Alzheimer’s disease patient brain continued.
a, Deconvolved and denoised tomographic slices of the EV containing tau PHFs and SFs from AD brain shown in Fig. 3a. b, Denoised tomographic volume and segmentation of the EV containing tau PHFs and SFs from AD brain shown in Fig. 3a. The limiting membrane is highlighted in yellow, intraluminal vesicles in cyan, and PHFs in magenta. c, Fit of atomic models (grey) of PHFs (PDB ID 6HRE) and SFs (PDB ID 7nrs) to the subtomogram averaged maps of tau PHFs (magenta) and SFs (blue) in EVs. d, Fourier shell correlation (FSC) curves for the two independently refined subtomogram averaged half-maps of the PHF-like filament type (magenta line) and the SF-like filament type (blue line). The FSC of 0.143 is shown with a dashed line. e, Measurements of the minimum and maximum widths of tau filaments in EVs from AD patient brain. n = 55. f, Measurements of the helical crossover distance (the distance between minimum and maximum widths) of tau filaments in EVs from AD patient brain. n = 50. g, Measurements of the lengths of tau filaments in EVs from AD patient brain. n = 50. h, Measurements of the diameters of EVs containing tau filaments from AD patient brain. n, 20. i, Deconvolved tomographic slices of EVs from AD brain containing tau filaments (magenta arrows) and non-tau filaments (green arrows). j, Deconvolved tomographic slices of Sarkosyl-extracted tau filaments from EVs, rarely decorated by additional densities. Orange arrows indicate additional densities that decorate tau filaments and cyan arrows indicate densities that are proximal to, but not associated with, tau filaments. Scale bars, 200 nm in (a–c, i and j) and 10 nm in (c).
Extended Data Fig. 8
Extended Data Fig. 8. Comparison of cryo-EM structures of PHFs from EV and cellular fractions of Alzheimer’s disease brain.
a, Representative cryo-EM images of tau filaments extracted from EVs and from the cellular fraction from AD patient brain. b, Representative reference-free two-dimensional (2D) cryo-EM class averages of PHFs from EVs from AD patient brain. c, Representative reference-free 2D cryo-EM class averages of SFs from EVs from AD patient brain. d, Cryo-EM maps viewed aligned to the helical axis of PHFs extracted from EVs (top) and from the cellular fraction (bottom) from AD brain. e, Local resolution estimates for the cryo-EM maps of PHFs extracted from EVs (top) and from the cellular fraction (bottom) from AD brain. f, Fourier shell correlation (FSC) curves for the two independently refined cryo-EM half-maps (black line); for the refined atomic model against the cryo-EM density map (magenta); for the atomic model shaken and refined using the first half-map against the first half-map (teal); and for the same atomic model against the second half-map (cyan) of PHFs extracted from EVs (top) and from the cellular fraction (bottom) from AD brain. The FSC thresholds of 0.143 and 0.5 are shown with orange and red dashed lines, respectively. g, Cryo-EM maps of PHFs from EVs from two different individuals, the cellular fraction from one individual, total brain homogenate from two different individuals (PDB IDs 6HRE and 7NRQ), and in vitro reconstitution (PDB ID 7QL4), shown as central slices perpendicular to the helical axis. Additional densities in the structures of PHFs from EVs are indicated with arrows. The resolutions (in Å) of the maps are given in the bottom right-hand corner of the images. h, Overlay of the PHF folds from EVs (magenta), the cellular fraction (cyan), and total brain homogenate and in vitro reconstitution (PDB IDs 6HRE, 7NRQ and 7QL4) (grey). a-e and g, Scale bars, 50 Å.

Update of

References

    1. Fitzpatrick, A. W. P. et al. Cryo-EM structures of tau filaments from Alzheimer’s disease. Nature547, 185–190 (2017). - PMC - PubMed
    1. Falcon, B. et al. Tau filaments from multiple cases of sporadic and inherited Alzheimer’s disease adopt a common fold. Acta Neuropathol.136, 699–708 (2018). - PMC - PubMed
    1. La Joie, R. et al. Prospective longitudinal atrophy in Alzheimer’s disease correlates with the intensity and topography of baseline tau-PET. Sci. Transl. Med.12, eaau5732 (2020). - PMC - PubMed
    1. Nelson, P. T. et al. Correlation of Alzheimer disease neuropathologic changes with cognitive status: a review of the literature. J. Neuropathol. Exp. Neurol.71, 362–381 (2012). - PMC - PubMed
    1. Lee, V. M.-Y., Goedert, M. & Trojanowski, J. Q. Neurodegenerative tauopathies. Annu. Rev. Neurosci.24, 1121–1159 (2001). - PubMed

LinkOut - more resources