. 2024 Nov 21;14(1):28861.
doi: 10.1038/s41598-024-80542-8.

Effects of virus-induced immunogenic cues on oncolytic virotherapy

Affiliations

Effects of virus-induced immunogenic cues on oncolytic virotherapy

Darshak K Bhatt et al. Sci Rep. .

Abstract

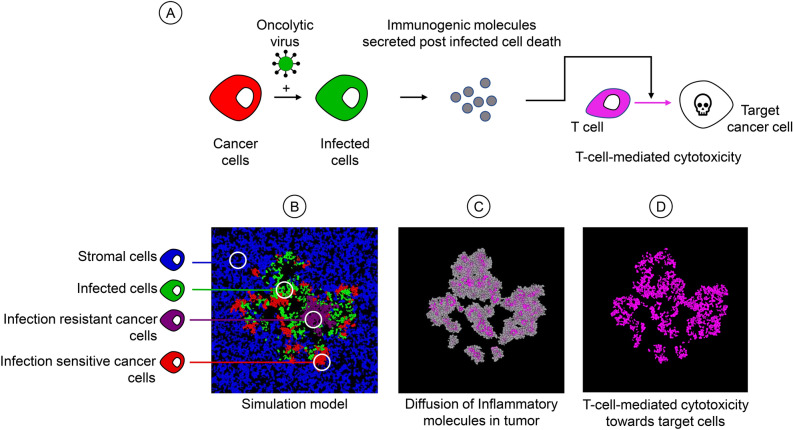
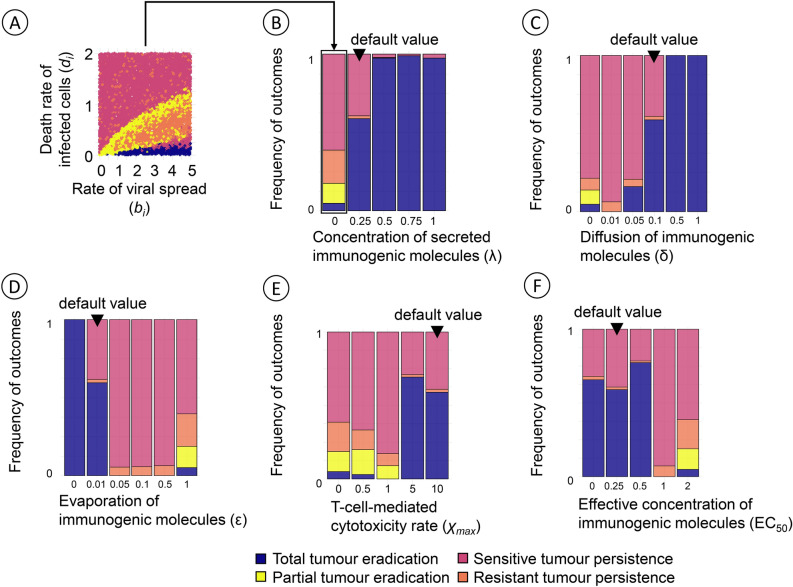
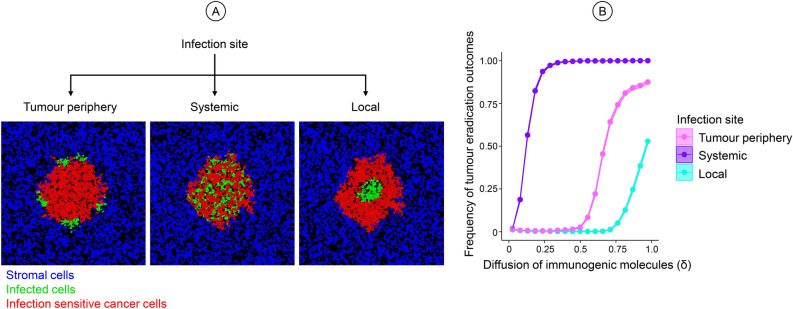
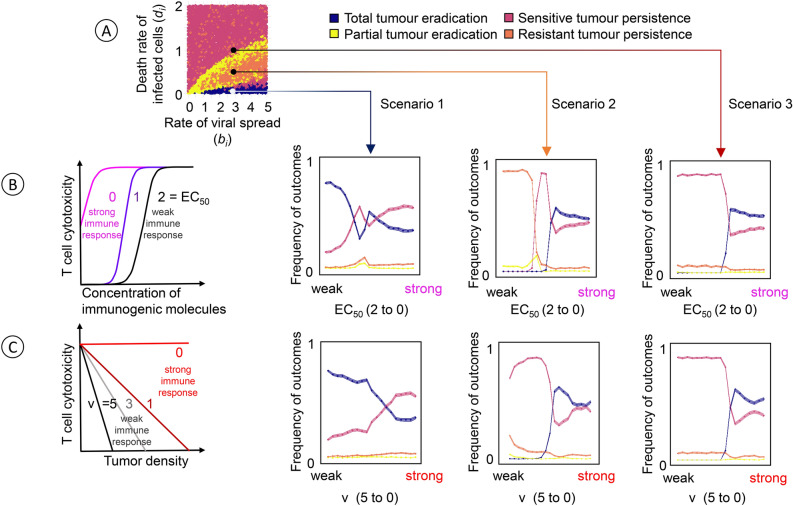
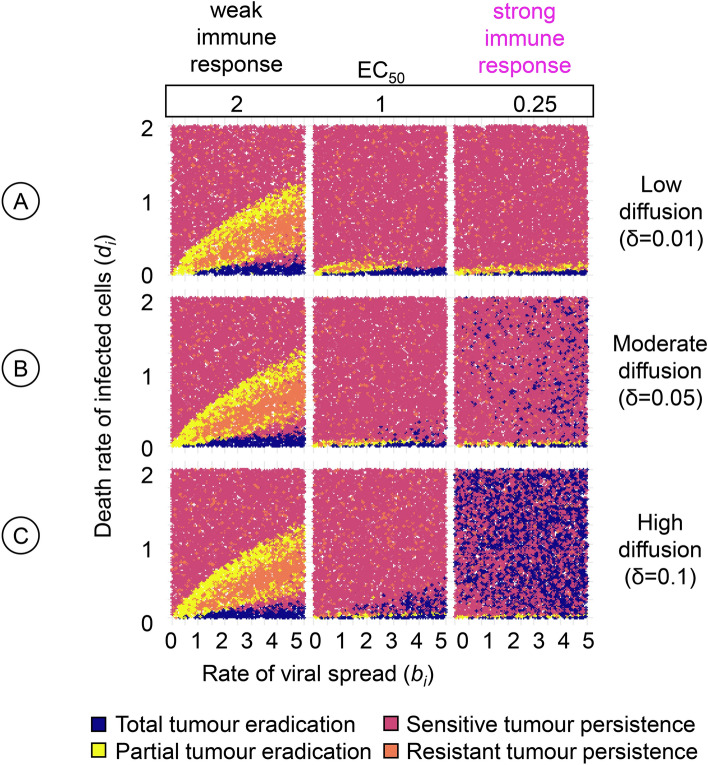
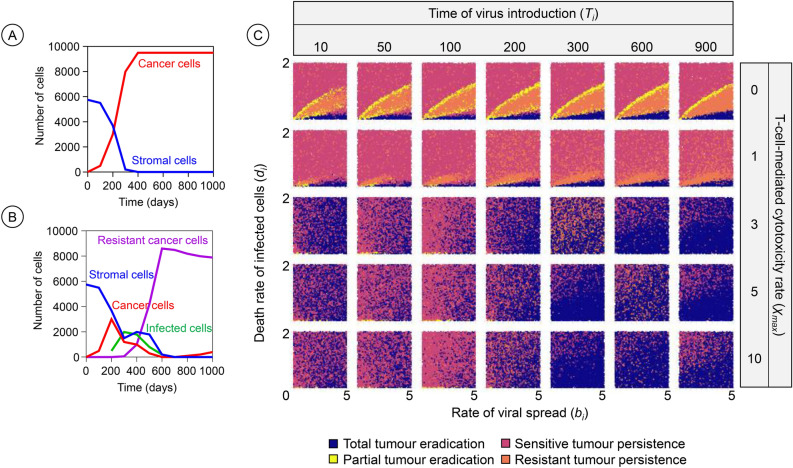
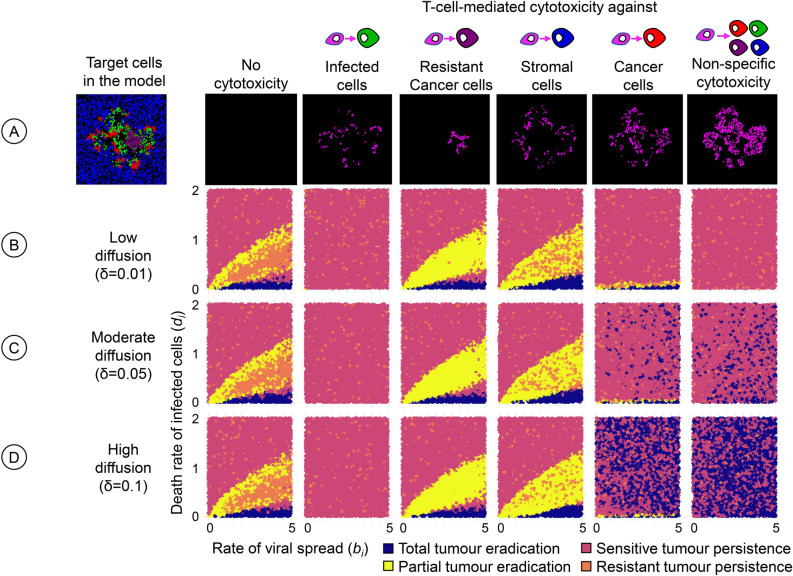
Oncolytic virotherapy is a promising form of cancer treatment that uses viruses to infect and kill cancer cells. In addition to their direct effects on cancer cells, the viruses stimulate various immune responses partly directed against the tumour. Efforts are made to genetically engineer oncolytic viruses to enhance their immunogenic potential. However, the interplay between tumour growth, viral infection, and immune responses is complex and not fully understood, leading to variable and sometimes counterintuitive therapeutic outcomes. Here, we employ a spatio-temporal model to shed more light on this interplay. We investigate systematically how the properties of virus-induced immunogenic signals (their half-life, rate of spread, and potential to promote T-cell-mediated cytotoxicity) affect the therapeutic outcome. Our simulations reveal that strong immunogenic signals, combined with faster diffusion rates, improve the spread of immune activation, leading to better tumour eradication. However, replicate simulations suggest that the outcome of virotherapy is more stochastic than generally appreciated. Our model shows that virus-induced immune responses can interfere with virotherapy, by targeting virus-infected cancer cells and/or by impeding viral spread. In the presence of immune responses, the mode of virus introduction is important, with systemic viral delivery throughout the tumour yielding the most favourable outcomes. The timing of virus introduction also plays a critical role; depending on the efficacy of the immune response, a later start of virotherapy can be advantageous. Overall, our results emphasise that the rational design of oncolytic viruses requires optimising virus-induced immunogenic signals and strategies that balance viral spread with immune activity for improved therapeutic success.

Keywords: Immune response; Immunogenic molecules; Spatial model; Stochastic outcome; Therapy failure.


Conflict of interest statement

Declarations. Competing interests: The authors declare no competing interests.

Figures

Fig. 1
Fig. 1
Overview of the model. (A) Crucial events in the model. An infection-sensitive cancer cell (red) can be infected by the virus, turning it into an infected cell (green). When an infected cell dies it releases immunogenic molecules. These molecules induce T-cell-mediated cytotoxicity, leading to the killing of target cells. (B) Spatial configuration of the model. The model follows the fate of four types of cells: healthy stromal cells (blue), infection-sensitive cancer cells (red), virus-infected cancer cells (green), and resistant cancer cells (purple). Cells divide or die with cell-type specific birth and death rates. Infection-sensitive cancer cells can become infected by virus that is released in the neighbourhood by infected cells. (C) Upon the death of infected cells, immunogenic molecules are released that diffuse in the tumour and eventually evaporate. (D) The local concentration of these molecules serves as a signal to induce T-cell-mediated cytotoxicity towards target cells in that area.
Fig. 2
Fig. 2
Average effect of the immune response parameters on the therapeutic outcome. Each panel shows how the likelihood of the four outcomes of oncolytic virotherapy is affected by one of the immune response parameters, keeping the other four parameters at their default values. In all cases, the immune response is considered to be non-specific, that is, both infected and uninfected cancer cells are potential targets of T-cell-mediated cytotoxicity. (A) Therapeutic outcome in the absence of immune effects for 10,000 simulations with varying rate of viral spread (bi, ranging from 0 to 5) and death rate of infected cancer cells (di, ranging from 0 to 2). The arrow from (A) to (B) points to the corresponding frequency distribution of the 10,000 simulation outcomes, illustrating the ‘average’ outcome of virotherapy in the absence of immune effects. The frequency distributions of therapeutic outcomes in panels (B) to (F) are obtained in the same way, but now including immune effects for different values of the five immune parameters in our model. (B) The likelihood of total tumour eradication increases with the concentration λ of immunogenic molecules released upon the death of an infected cancer cell (default value: λ=0.25). The special case λ=0 corresponds to the absence of an immune response. (C) The likelihood of total tumour eradication increases with the diffusion rate δ of immunogenic molecules (default value: δ=0.1). (D) The likelihood of total tumour eradication decreases with the evaporation rate ε of immunogenic molecules (default value: ε=0.01). (E) The likelihood of total tumour eradication is small for low values of the maximal level of cytotoxicity χmax (the maximal death rate imposed by T-cells) but relatively large once χmax increases beyond a threshold value (default value: χmax=10). (F) The likelihood of total tumour eradication is relatively high for small values of EC50 (the concentration of immunogenic molecules at which T-cell-mediated cytotoxicity reaches half its maximal value) but rapidly drops to zero in case of larger EC50 values (default value: EC50=0.25). The simulations employ systemic virotherapy introduction, where the virus infection occurs throughout the tumour mass.
Fig. 3
Fig. 3
Effect of the initiation of viral infection on therapeutic outcomes. (A) Illustration of three different modes of viral infection at the tumour periphery, systemically throughout the tumour, or locally at the centre of the tumour mass. Healthy stromal cells (blue), infection-sensitive cancer cells (red), and virus-infected cancer cells (green) present in the model at the time of initiation. (B) Effect of the diffusion rate δ of immunogenic molecules on the likelihood of tumour eradication for different modes of initiating viral infection. All parameters were kept at default value except the diffusion rate (δ, ranging from 0 to 1), the rate of viral spread (bi, ranging from 0 to 5) and the death rate of infected cancer cells (di, ranging from 0 to 2). 100,000 combinations were run for varying values of For each value of δ, 1000 combinations of bi and di were chosen at random, and 100 replicate simulations were run per combination. Coloured lines indicate the mean value of the simulation outcomes, and coloured envelopes indicate the 95% confidence band. Mean and confidence intervals were obtained via nonparametric bootstrapping. The coloured envelopes are difficult to see due to the minimal variation in the data.
Fig. 4
Fig. 4
Effect of immune response parameters on the therapeutic outcome in three scenarios. (A) In the absence of immune responses, the likelihood of the four therapeutic outcomes depends on the rate of viral spread (bi) and the death rate of virus-infected cancer cells (di). The effects of an added immune response are explored for three scenarios with an intermediate birth rate bi=3 and a low, moderate, and high death rate, which in the absence of immune responses tend to result in total tumour eradication (scenario 1, di=0.1), the persistence of a resistant tumour (scenario 2, di=0.5), and the persistence of a sensitive tumour (scenario 3, di=1), respectively. For each scenario, we assessed the effect of anticancer T-cell-mediated cytotoxicity on the therapeutic outcome by systematically changing two immune response parameters. (B) Effect of the EC50 value, the concentration of immunogenic molecules at which T-cell-mediated cytotoxicity reaches half its maximal value. Large EC50 values indicate a ‘weak’ immune response in the sense that a high concentration of immunogenic molecules is required to trigger the response. (C) Effect of the model parameter ν, which quantifies the negative effect of local tumour density on the effectiveness of the immune response. A larger value of ν indicates a stronger inhibition of the immune response by a high density of tumour cells and, hence, a ‘weaker’ immune response. Each of the six graphs in (B) and (C) represents 100,000 simulations, where all model parameters were kept at their default values except the ones under investigation. For the parameter under investigation, 1000 combinations of bi and di were chosen at random, and 100 replicate simulations were run per combination. Coloured lines indicate the mean value, and coloured envelopes indicate the 95% confidence band. Mean and confidence intervals were obtained via nonparametric bootstrapping.
Fig. 5
Fig. 5
Detailed view of the effect of two immune parameters on the therapeutic outcome. For a range of values of the rate of viral spread (bi) and the death rate of virus-infected cancer cells (di) the panels show how the outcome of oncolytic virotherapy is affected by two immune parameters: the effective concentration of immunogenic molecules (EC50) and the diffusion rate (δ) of these molecules. For three diffusion rates, (A) low (δ=0.01), (B) moderate (δ=0.05), and (C) high (δ=0.1), we assessed the effect of three EC50 values, corresponding to a weak (EC50=2), moderate (EC50=1), and strong (EC50=0.25) immune response on therapeutic outcomes. The upper left graph resembles Fig. 2A, which depicts the corresponding graph in the absence of an immune response. For each graph in the figure, 10,000 simulations were run for parameter combinations (bi, di) chosen randomly within the specified range. Each simulation is represented by a point, the colour of which indicates the therapeutic outcome. All model parameters were kept at their default values except the ones under investigation.
Fig. 6
Fig. 6
Effects of time of virus introduction and T-cell-mediated cytotoxicity on the therapeutic outcome. The frequency of infection-sensitive cancer cells (in red), healthy stromal cells (blue), infected cells (green), and resistant cancer cells (purple) over time is illustrated in the absence (A) and presence (B) of virotherapy (Ti = 200, bi = 1.2 and di = 0.1). (C) For a range of values of the rate of viral spread (bi) and the death rate of virus-infected cancer cells (di) the panels show how the outcome of oncolytic virotherapy is affected by the introduction time of the virus (Ti , organised in columns) and the level of anticancer T-cell-mediated cytotoxicity (χmax, organised in rows). The graph with Ti = 50 and χmax = 0 corresponds to Fig. 2A, depicting the outcomes in the absence of an immune response. For each graph in the figure, 10,000 simulations were run for parameter combinations (bi, di) chosen randomly within the specified range. Each simulation is represented by a point, the colour of which indicates the therapeutic outcome. All model parameters were kept at their default values except the ones under investigation.
Fig. 7
Fig. 7
Effect of T-cell specificity on the therapeutic outcome. For three diffusion rates of immunogenic molecules, the panels show how the outcome of oncolytic virotherapy is affected if the T-cells do not target infection-sensitive cancer cells (the standard scenario) but other cells in the model. (A) The leftmost panel shows a snapshot of the potential target cells: healthy stromal cells (blue), uninfected but infection-sensitive cancer cells (red), infection-resistant cancer cells (purple), and infected cells (green). The other panels show snapshots of the distribution of immunogenic molecules for the six scenarios considered: no cytotoxicity (absence of an immune response), and T-cell-mediated cytotoxicity targeted towards either (from left to right) infected cells, infection-resistant cancer cells, stromal cells, infection-sensitive cancer cells, or all cell types present. The six scenarios were studied for three diffusion rates: (B) low (δ=0.01), (C) moderate (δ=0.05), and (D) high (δ=0.1). For each graph in the figure, 10,000 simulations were run for parameter combinations (bi, di) chosen randomly within the specified range. Each simulation is represented by a point, the colour of which indicates the therapeutic outcome. All model parameters were kept at their default values except the ones under investigation.

Similar articles

References

    1. Kelly, E. & Russell, S. J. History of oncolytic viruses: Genesis to genetic engineering. Mol. Ther.15, 651–659 (2007). - PubMed
    1. Martin, N. T. & Bell, J. C. Oncolytic virus combination therapy: Killing one bird with two stones. Mol. Ther.26, 1414–1422 (2018). - PMC - PubMed
    1. Russell, S. J., Peng, K.-W. & Bell, J. C. Oncolytic virotherapy. Nat. Biotechnol.30, 658–670 (2012). - PMC - PubMed
    1. Kaufman, H. L., Kohlhapp, F. J. & Zloza, A. Oncolytic viruses: A new class of immunotherapy drugs. Nat. Rev. Drug Discov.14, 642–662 (2015). - PMC - PubMed
    1. Bhatt, D. K., Wekema, L., Carvalho Barros, L. R., Chammas, R. & Daemen, T. A systematic analysis on the clinical safety and efficacy of Onco-Virotherapy. Mol. Therapy Oncolyt. S2372770521001364 (2021) 10.1016/j.omto.2021.09.008. - PMC - PubMed

LinkOut - more resources