. 2024 Dec;56(12):2646-2658.
doi: 10.1038/s41588-024-01952-y. Epub 2024 Nov 21.

Genome-wide association analysis provides insights into the molecular etiology of dilated cardiomyopathy

Sean L Zheng #  1   2   3 Albert Henry #  4   5 Douglas Cannie  4   6 Michael Lee  1 David Miller  7 Kathryn A McGurk  1   2   8 Isabelle Bond  4 Xiao Xu  1   2 Hanane Issa  5 Catherine Francis  1   3 Antonio De Marvao  1   2   3 Pantazis I Theotokis  1   2   3 Rachel J Buchan  1   2   3 Doug Speed  9 Erik Abner  10 Lance Adams  11 Krishna G Aragam  12   13   8 Johan Ärnlöv  14   15 Anna Axelsson Raja  16 Joshua D Backman  17 John Baksi  3 Paul J R Barton  1   2   3 Kiran J Biddinger  12   8 Eric Boersma  18 Jeffrey Brandimarto  19 Søren Brunak  20 Henning Bundgaard  16 David J Carey  21 Philippe Charron  22   23 James P Cook  24 Stuart A Cook  1   2   3 Spiros Denaxas  5   25   26   27 Jean-François Deleuze  28   29   30 Alexander S Doney  31 Perry Elliott  4   6 Christian Erikstrup  32   33 Tõnu Esko  10   8 Eric H Farber-Eger  34 Chris Finan  4 Sophie Garnier  22 Jonas Ghouse  16 Vilmantas Giedraitis  35 Daniel F Guðbjartsson  36   37 Christopher M Haggerty  21 Brian P Halliday  1   3 Anna Helgadottir  36 Harry Hemingway  5   25 Hans L Hillege  38 Isabella Kardys  18 Lars Lind  39 Cecilia M Lindgren  8   40   41 Brandon D Lowery  34 Charlotte Manisty  4   6 Kenneth B Margulies  20 James C Moon  4   6 Ify R Mordi  31 Michael P Morley  20 Andrew D Morris  42 Andrew P Morris  43 Lori Morton  44 Mahdad Noursadeghi  45 Sisse R Ostrowski  46   47 Anjali T Owens  19 Colin N A Palmer  48 Antonis Pantazis  3 Ole B V Pedersen  47   49 Sanjay K Prasad  1   3 Akshay Shekhar  44 Diane T Smelser  21 Sundararajan Srinivasan  48 Kari Stefansson  36   50 Garðar Sveinbjörnsson  36 Petros Syrris  4 Mari-Liis Tammesoo  10 Upasana Tayal  1   3 Maris Teder-Laving  10 Guðmundur Thorgeirsson  36   50 Unnur Thorsteinsdottir  36   50 Vinicius Tragante  36 David-Alexandre Trégouët  29   51 Thomas A Treibel  4   6 Henrik Ullum  52 Ana M Valdes  53 Jessica van Setten  54 Marion van Vugt  54 Abirami Veluchamy  48 W M Monique Verschuren  55   56 Eric Villard  22 Yifan Yang  19 COVIDsortiumDBDS Genomic ConsortiumEstonian Biobank Research TeamHERMES ConsortiumFolkert W Asselbergs  4   27   57 Thomas P Cappola  19 Marie-Pierre Dube  58   59 Michael E Dunn  44 Patrick T Ellinor  8   60 Aroon D Hingorani  4 Chim C Lang  31   61 Nilesh J Samani  62 Svati H Shah  63   64   65 J Gustav Smith  66   67   68 Ramachandran S Vasan  69   70 Declan P O'Regan  2 Hilma Holm  36 Michela Noseda  1 Quinn Wells  71 James S Ware  72   73   74   75 R Thomas Lumbers  76   77   78
Collaborators, Affiliations

Genome-wide association analysis provides insights into the molecular etiology of dilated cardiomyopathy

Sean L Zheng et al. Nat Genet. 2024 Dec.

Abstract

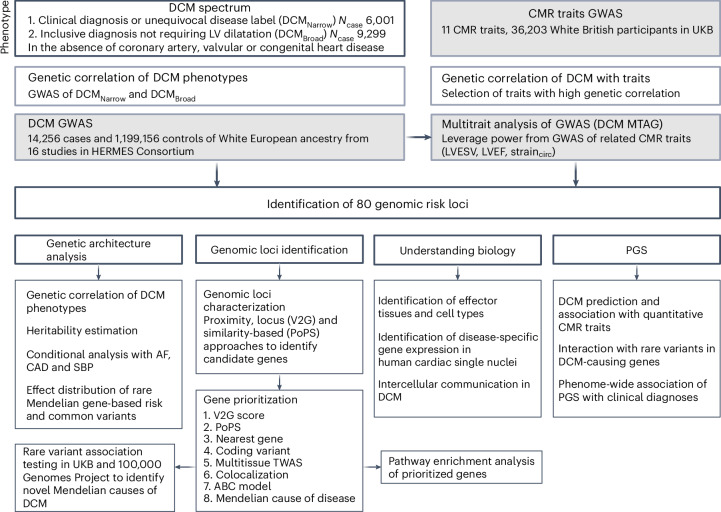
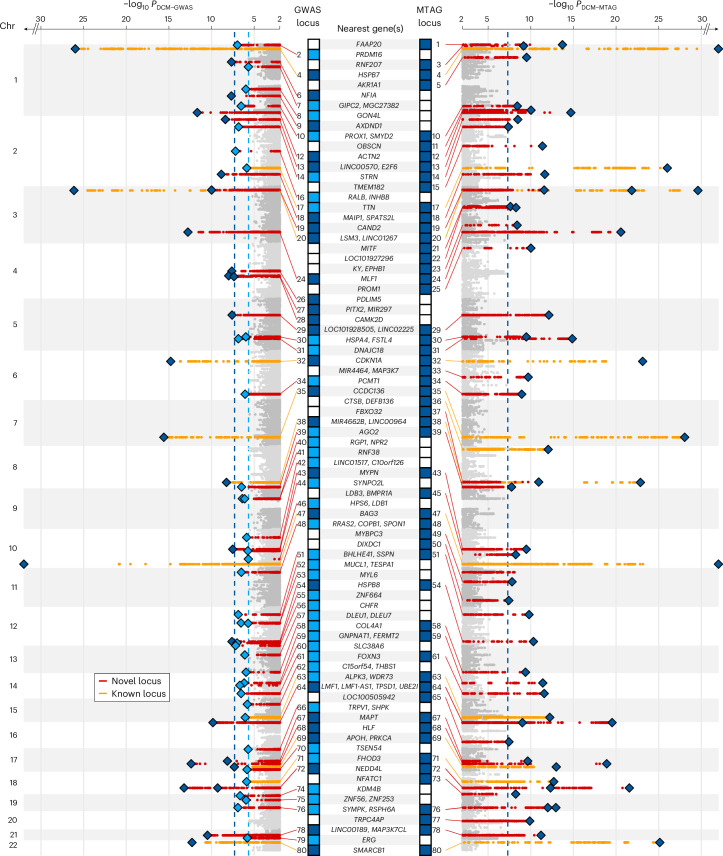
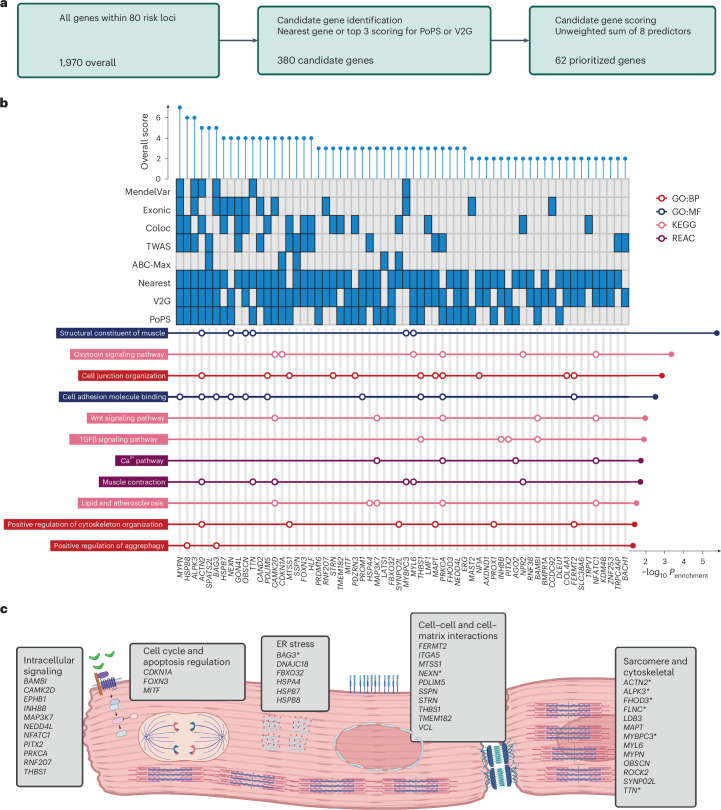
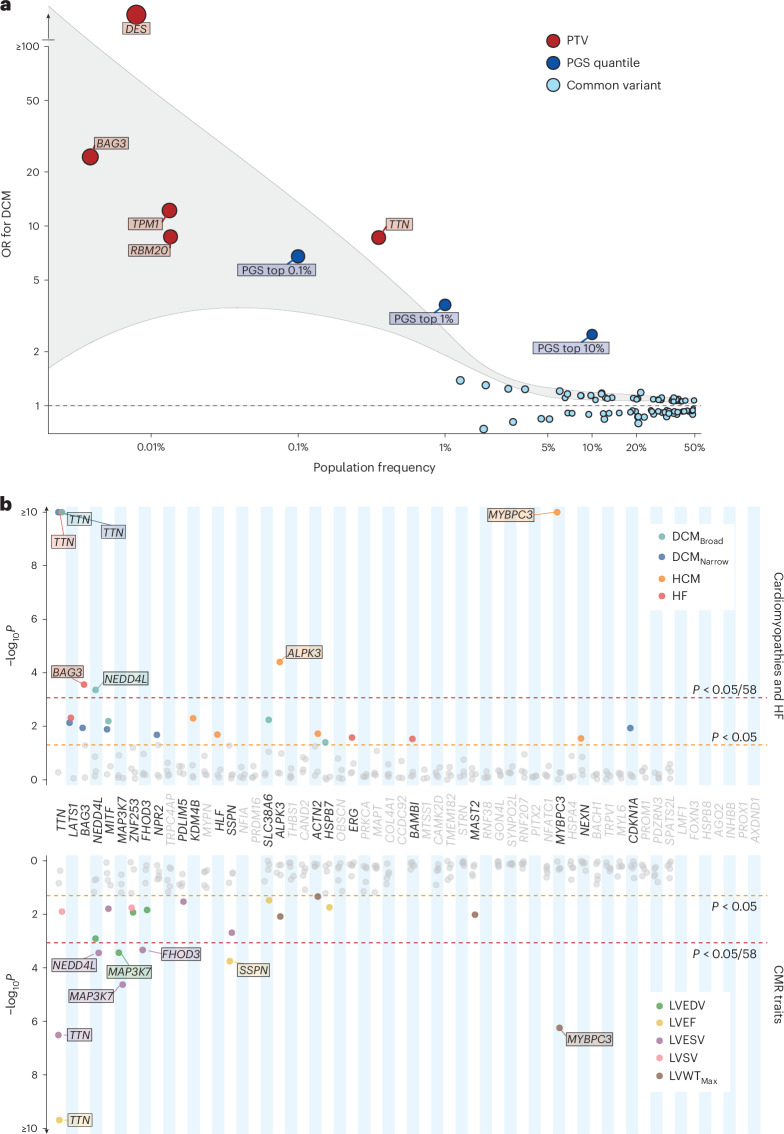
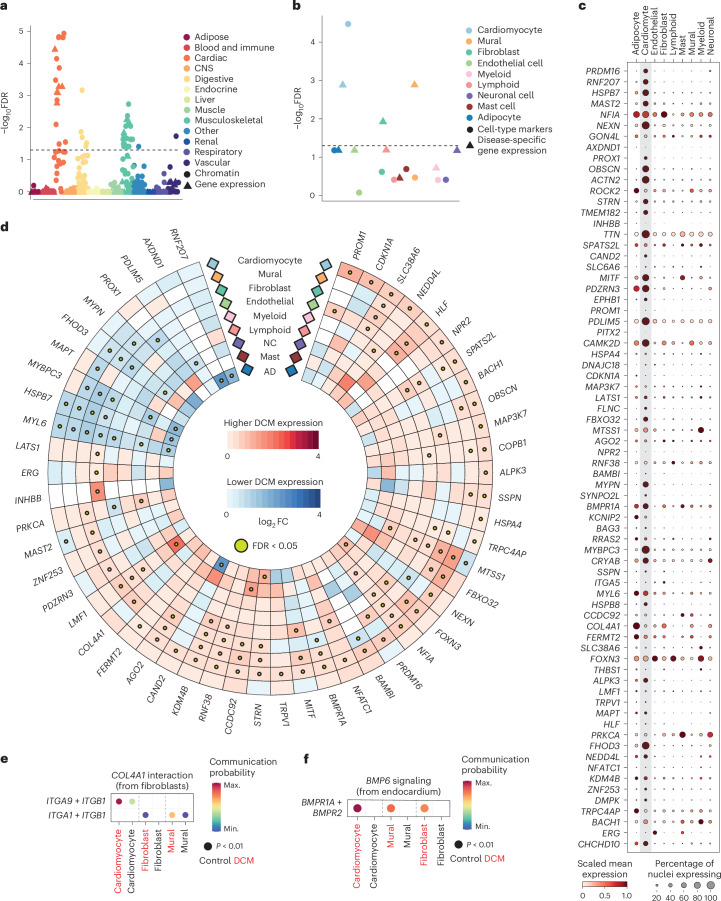
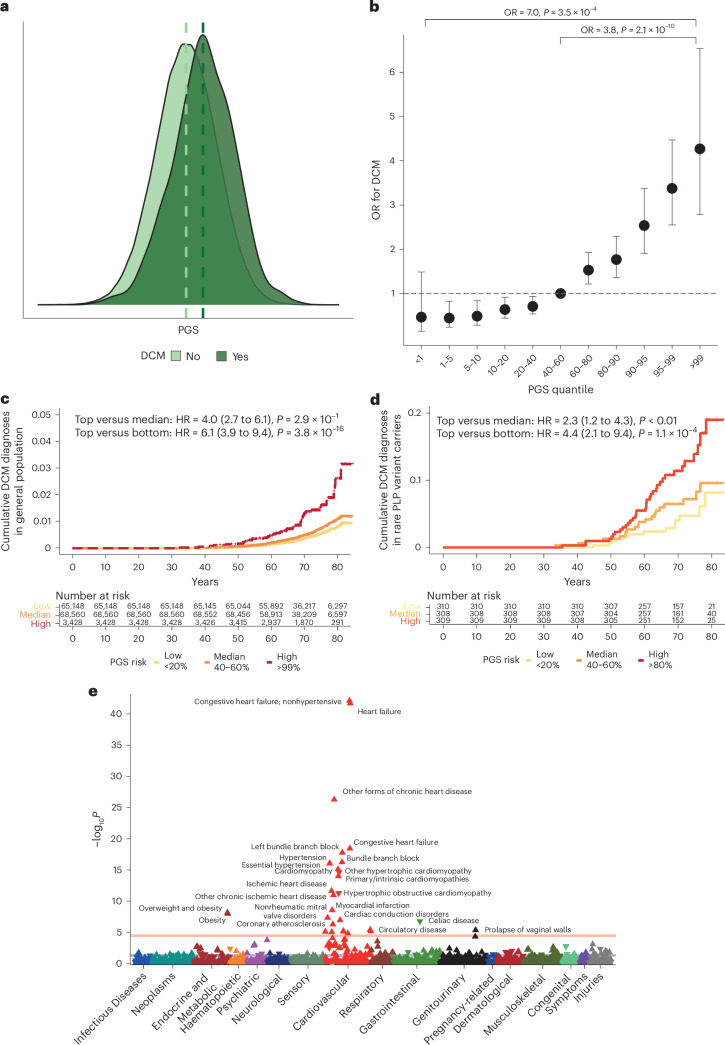
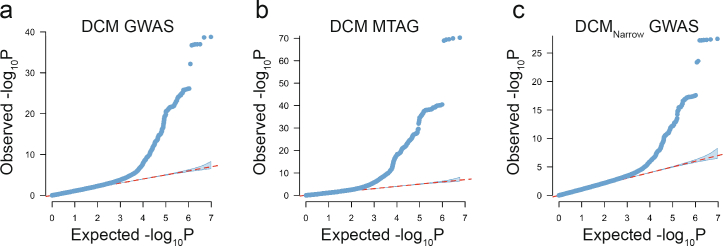
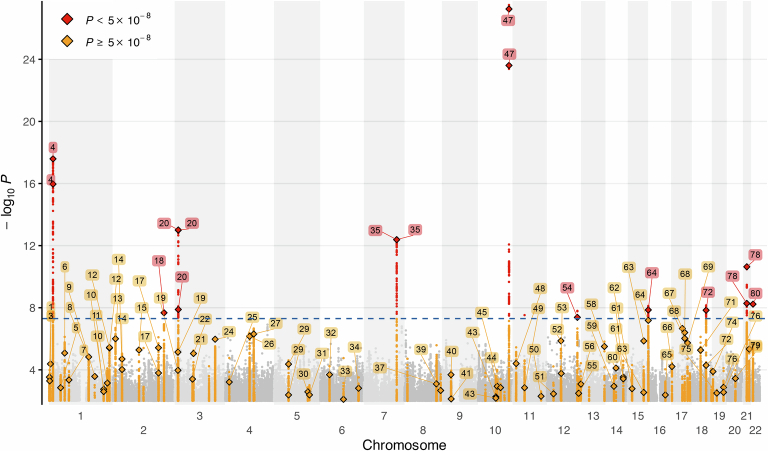
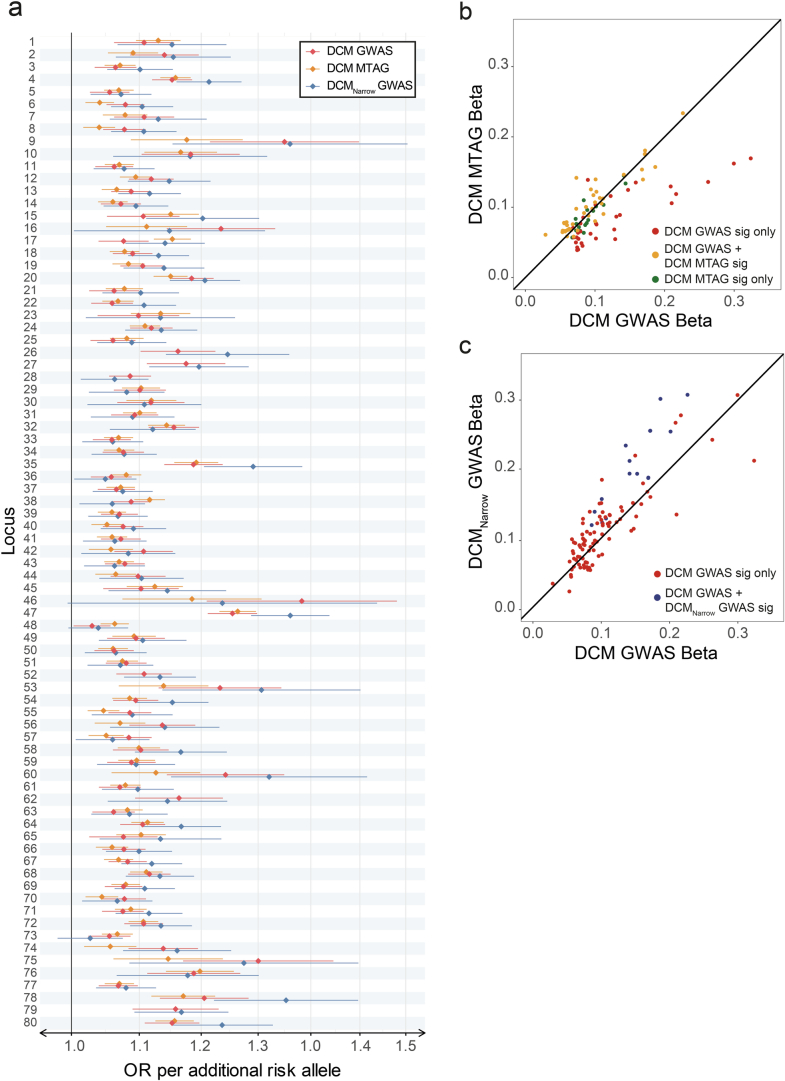
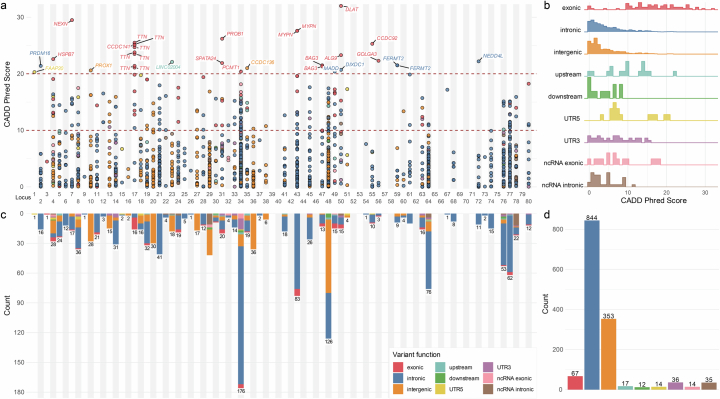
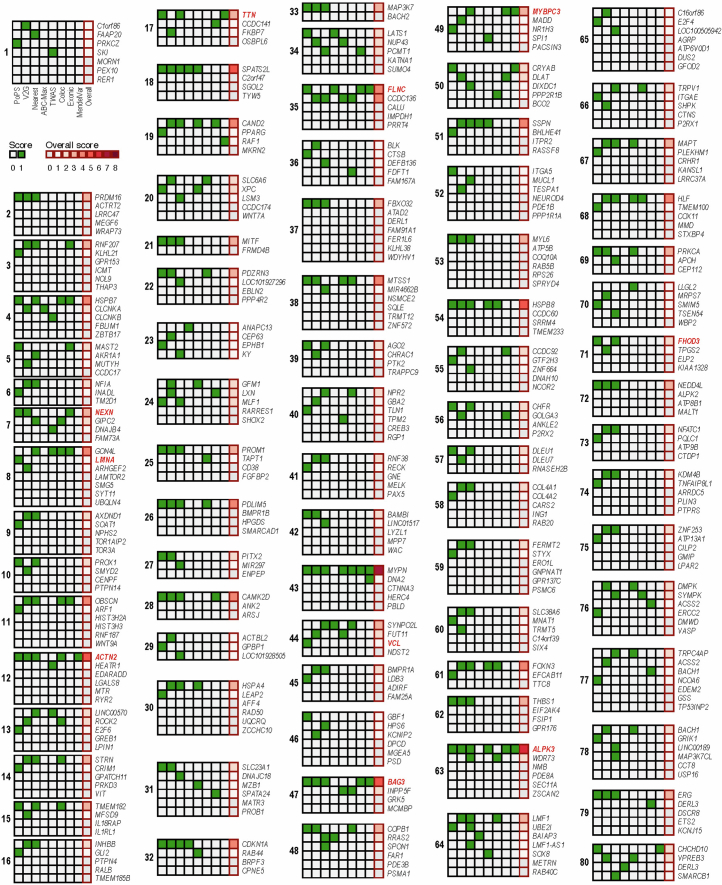
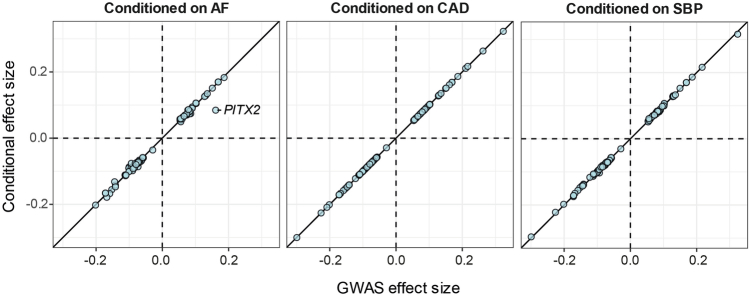
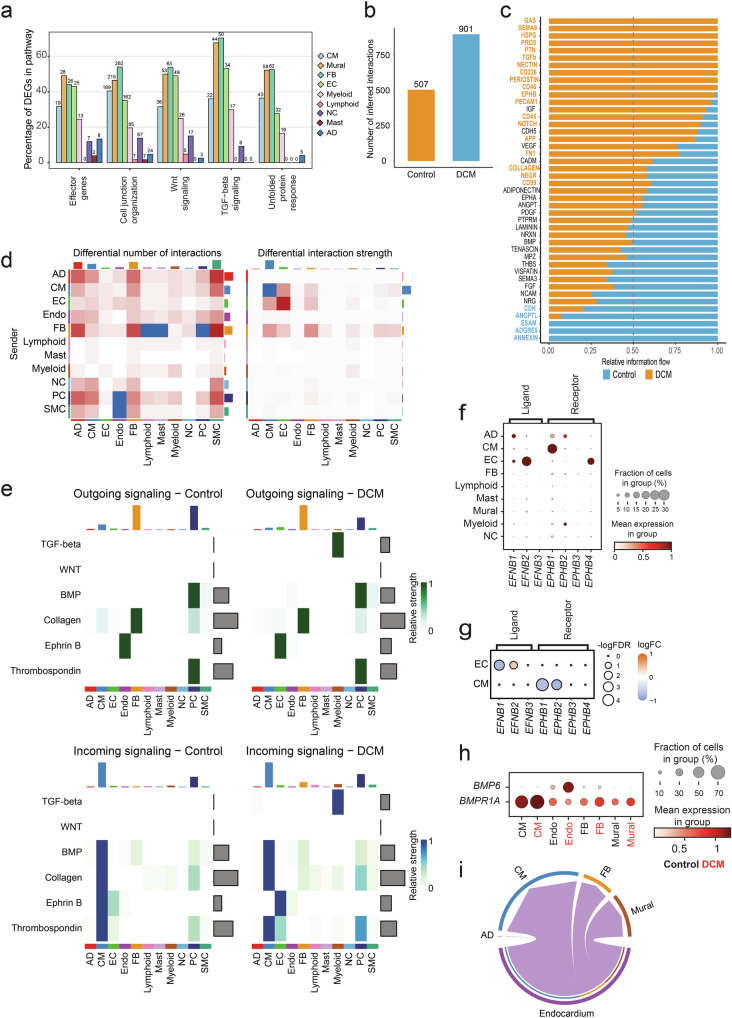
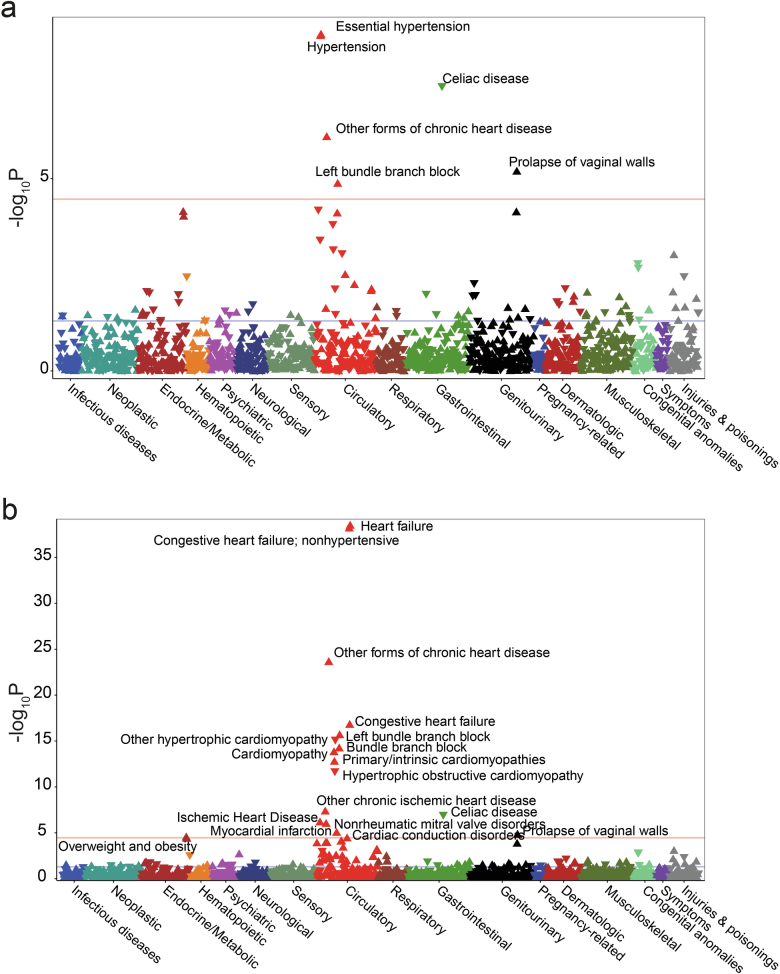
Dilated cardiomyopathy (DCM) is a leading cause of heart failure and cardiac transplantation. We report a genome-wide association study and multi-trait analysis of DCM (14,256 cases) and three left ventricular traits (36,203 UK Biobank participants). We identified 80 genomic risk loci and prioritized 62 putative effector genes, including several with rare variant DCM associations (MAP3K7, NEDD4L and SSPN). Using single-nucleus transcriptomics, we identify cellular states, biological pathways, and intracellular communications that drive pathogenesis. We demonstrate that polygenic scores predict DCM in the general population and modify penetrance in carriers of rare DCM variants. Our findings may inform the design of genetic testing strategies that incorporate polygenic background. They also provide insights into the molecular etiology of DCM that may facilitate the development of targeted therapeutics.


Conflict of interest statement

Competing interests: S.L.Z. has acted as a consultant for Health Lumen. A.H. and R.T.L. have received funding from Pfizer Inc. R.T.L. has performed paid consultancy for Health Lumen and Fitfile Ltd. J.S.W. has acted as a consultant for MyoKardia, Pfizer, Foresite Labs and Health Lumen and received institutional support from Bristol Myers Squibb and Pfizer Inc. P.C. has received personal fees for consultancies, outside the present work, for Amicus, Pfizer Inc., Owkin and Bristol Myers Squibb. M.-P.D. declares holding equity in Dalcor Pharmaceuticals, unrelated to this work. The authors who are affiliated with deCODE genetics/Amgen Inc. and Regeneron Pharmaceuticals declare competing financial interests as employees. The other authors declare no competing interests.

Figures

Fig. 1
Fig. 1. Study overview of European ancestry DCM GWAS performed in 14,256 cases and 1,199,156 controls from 16 studies.
Cases were defined as having a clinical diagnosis or unequivocal disease label for DCM (DCMNarrow) or a more inclusive definition of LV systolic dysfunction, with or without LV dilatation (DCMBroad), in the absence of CAD, severe valvular heart disease or congenital heart disease. Genetic correlation was performed to identify traits suitable for inclusion in meta-analysis and multitrait analysis of GWAS (MTAG). The MTAG analysis combined DCM GWAS with GWAS of genetically correlated quantitative cardiac magnetic resonance (CMR) imaging-derived traits (DCM MTAG). Downstream analyses included elucidating the genetic architecture of DCM, genomic risk loci annotation and prioritization of candidate genes, integration with single-cell transcriptomics to identify perturbations of candidate gene expression, and generation and evaluation of polygenic risk scores (PGS) for DCM. LVESV, LV end systolic volume; LVEF, LV ejection fraction; straincirc, global LV circumferential strain. Figure created with BioRender.com.
Fig. 2
Fig. 2. Manhattan plot of DCM GWAS and DCM MTAG identifying novel (red) and previously reported (orange) genomic loci associated with DCM.
Loci reaching genome-wide (P < 5 × 10−8, dashed blue line) in DCM GWAS and DCM MTAG, and FDR (αFDR < 1%, dashed light blue line) in DCM GWAS are highlighted. Loci are annotated with the nearest protein-coding gene(s) of all conditionally independent variants within the locus and ordered in ascending genomic location. P values were two-sided and based on an inverse-variance weighted fixed-effects model and not adjusted for multiple testing.
Fig. 3
Fig. 3. Locus annotation and candidate gene scoring prioritize genes at risk loci and important biological pathways and processes in DCM pathogenesis.
a, Among all genes located within genomic risk loci (1,970 genes), candidate genes were selected based on proximity and being among the top three genes predicted using PoPS or V2G (380 candidate genes). Sixty-two genes were prioritized at 62 loci after scoring highest among the eight predictors. b, Pathway enrichment analysis of prioritized genes, highlighting pathways related to muscle structural constituents. Enrichment of effector genes within Gene Ontology pathways was performed using Fisher’s one-sided test with Bonferroni adjustment of P values for the total number of pathways tested. c, Schematic overview of pathways and processes highlighted in DCM pathogenesis, manually curated from pathway enrichment analysis and published literature. Genes with existing evidence of being Mendelian causes of cardiomyopathy are highlighted in bold. Asterisk indicates moderate or definitive evidence of causing cardiomyopathy. GO:BP, Gene Ontology: Biological Process; GO:MF, Gene Ontology: Molecular Function; KEGG, Kyoto Encyclopedia of Genes and Genomes; REAC (Reactome Pathway Database); ER, endoplasmic reticulum. a and c were created with BioRender.com.
Fig. 4
Fig. 4. Rare variant analysis highlights the genomic architecture of DCM and identifies novel disease- and trait-associated genes.
a, Genomic architecture of DCM incorporating effects arising from individual sentinel common variants (MAF > 0.01) in DCM loci (light blue), upper PGS quantiles of common variants (dark blue) and cumulative burden testing of rare PTVs (MAF < 0.001) in genes with moderate or definitive evidence of causing DCM (red). Population frequency represents MAF for individual sentinel variants, the proportion of the population contained within the quantile for PGS, and the cumulative population frequency of rare variants in burden-tested genes. Outcome for burden testing was DCM, with presentation of all genes reaching nominal significance (P < 0.05) following logistic ridge regression with Firth correction implemented using REGENIE. The gray highlighted region indicates smoothened regression lines of the upper and lower bounds for each effect estimate. b, Burden analysis of rare PTVs (MAF < 0.001) in 58 prioritized protein-coding genes in UKB (453,455 participants with whole-exome sequencing, and 36,104 with CMR), highlighting established Mendelian cardiomyopathy genes (TTN, BAG3, FHOD3, ALPK3 and MYBPC3) and three novel genes (NEDD4L, MAP3K7 and SSPN). Red line indicates statistical significance (P < 8.6 × 10−4; 0.05 of 58 genes), and orange line indicates nominal significance (P < 0.05). Genes are ordered by mean P value across all tested traits, from lowest to highest, with genes reaching nominal significance (P < 0.05) for at least one trait highlighted in bold. Burden testing was performed using logistic ridge regression with Firth correction implemented using REGENIE. Detailed results are available in Supplementary Tables 11–13. HF, heart failure; LVSV, LV stroke volume; LVWTMax, maximum LV wall thickness.
Fig. 5
Fig. 5. Integration of genomics and transcriptomics identifies genes and biological mechanisms in DCM.
a,b, Partitioned heritability at tissue level (a) and at cell type level (b) from snRNA-seq data of 52 DCM cases and 18 controls. Enrichment P values were adjusted using the Benjamini–Hochberg method. Dashed line indicates FDR-adjusted P value of 0.05. For cell-type-specific heritability enrichment, cardiomyocyte marker and disease-specific expression in cardiomyocytes and mural cell types remained significant when the tau coefficient was used (Supplementary Table 16). c, Cell type expression of prioritized genes in single-nucleus transcriptomics from LV tissue in 18 control donors. Mean expression is scaled from minimum to maximum, and the proportion of expressing nuclei within a cell type is indicated by dot size. Cardiomyocyte expression is indicated in the gray shaded box. d, Differential expression of candidate genes across the range of major cell types. Red and blue indicate increased and reduced gene expression in DCM compared with controls, respectively. Yellow dot indicates significant DEGs within a cell type at FDR < 0.05. Genes are ordered by highest absolute log fold-change difference across cell types. Cell types are ordered by abundance from greatest (outer) to least (inner). e, Increased COL4A1 signaling from fibroblasts to cardiomyocytes, fibroblasts and mural cells via integrins from DCM single-nucleus transcriptomics. Communication probability indicates the scaled strength of interaction from maximum to minimum signaling interactions between cell types. Dot color reflects communication probabilities, and dot size represents P values computed by one-sided permutation test. f, Upregulation of BMP6 (ligand) in endocardial cells, resulting in increased signaling through BMPR1A in cardiomyocytes, fibroblasts and mural cells. Communication probability indicates the scaled strength of interaction from maximum to minimum signaling interactions between cell types. Dot color reflects communication probabilities, and dot size represents P values computed by one-sided permutation test. NC, neuronal cell; AD, adipocyte; FC, fold change; CNS, central nervous system; Max., maximum; Min., minimum.
Fig. 6
Fig. 6. DCM PGS is associated with DCM disease status in the UKB, including in carriers of pathogenic or likely pathogenic variants in DCM-causing genes.
a, PGS distribution among 347,585 UKB participants with and without DCM, showing higher PGS in those with DCM. b, ORs and 95% confidence intervals for DCM in quantile bins among 347,585 UKB participants, comparing individuals in the top centile (n = 3,428) with those in the median 40–60% centiles (n = 68,560) and lowest centile (n = 3,428). P values are two-sided and were calculated from a logistic regression model and not adjusted for multiple testing. c, Cumulative hazards for lifetime diagnosis of DCM in the UKB stratified by high (top 1%, red), median (middle 20%, orange) and low (bottom 20%, yellow) PGS. P values are two-sided and were calculated from a Cox proportional hazards regression model and not adjusted for multiple testing. d, Cumulative hazards for lifetime diagnosis of DCM in carriers of pathogenic or likely pathogenic (PLP) rare variants in DCM-causing genes in UKB, stratified by high (top 20%, red), median (middle 20%, orange) and low (bottom 20%, yellow) PGS. P values are two-sided and were calculated from a Cox proportional hazards regression model and not adjusted for multiple testing. e, Manhattan plot of DCM PGS pheWAS in UKB, showing associations with cardiovascular phenotypes and obesity. ICD-9 and ICD-10 diagnostic codes are mapped to PheCode Map v.1.2. Mapped phenotypes exceeding the phenome-wide significance threshold (P = 2.7 × 10−5, red line, adjusted for the total number of tested phenotypes) are labeled. The blue line indicates the nominal significance level (P < 0.05). The direction of the triangle indicates the direction of effect of the PGS association. P values are two-sided and were calculated from the linear regression model and not adjusted for multiple testing. PheWAS analyses adjusted for DCM or heart failure and hypertension status are shown in Extended Data Fig. 8. HR, hazard ratio.
Extended Data Fig. 1
Extended Data Fig. 1. Quantile-quantile plots.
Quantile-quantile plots for (a) DCM GWAS, (b) DCM MTAG and (c) DCMNarrow GWAS. The shaded error bar indicates the 95% confidence interval under the assumption of a uniform distribution of P values (red dashed line).
Extended Data Fig. 2
Extended Data Fig. 2. Manhattan plot of DCMNarrow GWAS.
Manhattan plot of GWAS of 6,001 strictly defined DCM cases and 449,384 controls (DCMNarrow GWAS). GWAS was performed using the same methods as for DCM GWAS using the subset of studies that recruited participants from specialist clinical cohorts or using unequivocal DCM diagnostic codes (Supplementary Information 1). DCM diagnosis required cardiac imaging, clinical expertise and/or robustly-defined ICD codes. The 80 loci identified from DCM GWAS and DCM MTAG (Fig. 2) are labelled. In total there were 10 loci reaching genome-wide significance (dashed blue line – P < 5 × 10⁻⁸), all of which were significant in the primary GWAS. P-values were two-sided and based on inverse-variance weighted fixed-effects model, and not adjusted for multiple testing.
Extended Data Fig. 3
Extended Data Fig. 3. Comparison of effect sizes across DCM GWAS, DCM MTAG, and DCMNarrow GWAS.
a, Forest plot of effect size across DCM GWAS, DCM MTAG and DCMNarrow GWAS for all 80 genomic risk loci identified in DCM GWAS and DCM MTAG. Effect estimates are derived from DCM GWAS of 12,556 cases and 1,199,156 controls (red), DCM MTAG consisting of the DCM GWAS cohort and 36,203 participants with cardiac magnetic resonance derived quantitative cardiac traits (orange), and DCMNarrow GWAS of 6,001 cases and 449,382 controls (blue). All sentinel variants at the 80 genomic risk loci identified in this study are presented (62 from DCM GWAS using FDR threshold 1% and 54 from DCM MTAG at genome-wide significance). The central effect estimate is represented with a diamond and the tails represent the 95% confidence interval. b, Scatter plot comparing absolute effect sizes for conditionally independent variants in DCM GWAS and DCMNarrow GWAS. c, Scatter plot comparing absolute effect sizes for conditionally independent variants in DCM GWAS and DCM MTAG. Variants tended to have a greater effect in DCMNarrow GWAS than in DCM GWAS, particularly for variants that were genome-wide significant in DCMNarrow GWAS (blue) compared with those that were only FDR significant in DCM GWAS (red). When comparing DCM GWAS and DCM MTAG, variants that were FDR significant in DCM GWAS and genome-wide significant in DCM MTAG (dark green), and that were genome-wide significant only in DCM MTAG (yellow), had similar effect sizes, while variants that were only FDR significant in DCM GWAS (red) tended to have larger effects in DCM GWAS than in DCM MTAG.
Extended Data Fig. 4
Extended Data Fig. 4. Functionally-informed fine-mapped variants at genomic loci.
a, Fine-mapped variants at genomic risk loci with variants with high CADD Phred scores (>20) annotated to the nearest gene. b, Total number and function of fine-mapped variants at each locus. c, Distribution of CADD Phred scores for fine-mapped variants across all genomic risk loci, stratified by variant function. d, Number of fine-mapped variants stratified by function.
Extended Data Fig. 5
Extended Data Fig. 5. Summary of effector gene prioritization results.
A two-step approach was used to identify candidate genes and prioritize potential effector genes at each loci. First, the nearest gene along with the top 3 genes scored using each of PoPs and V2G were highlighted as candidate genes for further evaluation. Second, of these genes, 5 additional features and methods were used to score the overall level of evidence supporting each putative gene by giving one point for any gene that was identified as best from each feature (maximum score of 8), and the highest scoring gene(s) at each locus being identified as the candidate gene(s). The 8 features were: PoPs, V2G, nearest, activity-by-contact (ABC)-model, transcriptome-wide association study (TWAS), colocalization, exonic coding variant, and reported Mendelian cause of cardiomyopathy or muscle disorder. Highlighted in red are genes with moderate or definitive evidence of being Mendelian causes of cardiomyopathy from ClinGen curation.
Extended Data Fig. 6
Extended Data Fig. 6. Conditional analysis of GWAS on atrial fibrillation, coronary artery disease, and systolic blood pressure.
Comparison of effect estimates from the original DCM GWAS (X axis) and from conditional GWAS on atrial fibrillation (AF), coronary artery disease (CAD), and systolic blood pressure (SBP) (Y-axis).
Extended Data Fig. 7
Extended Data Fig. 7. Intercellular interactions in DCM inferred from single nuclei transcriptomics.
a, Percentage of genes within candidate gene enriched pathways that are differentially expressed in DCM compared with controls, stratified by cell type. b, Total number of interactions between cell types in DCM (blue) and control (orange). c, Relative information flow of curated receptor-ligand intercellular, highlighting pathways that are significantly increased in DCM (orange) or control (blue). d, Heat map showing total overall differences in interaction number and strength between cell types (red – increased in DCM, blue – decreased). e, Heat map showing outgoing (green) and incoming (blue) signals for prioritized gene enriched pathways (TGF-beta and WNT pathways) and specific pathways of prioritised genes (BMP, Collagen, Ephrin B and thrombospondin). f, Expression levels of ephrin-B ligand and receptors across major cell types. Mean expression is scaled from minimum to maximum, and proportion of expressing nuclei within a cell type indicated by dot size. g, Increased expression of EFNB2 (ligand) in endothelial cells (EC) and decreased expression of EPHB1 (receptor) in cardiomyocytes (CM) in DCM. Dot colour represents change in expression compared with control, and dot size represents the FDR-adjusted P-value. h, Expression levels of BMP6 and BMPR1A in CM, endocardial, fibroblast (FB), and mural nuclei, stratified by HCM (red) and control (black) status. Mean expression is scaled from minimum to maximum, and proportion of expressing nuclei within a cell type indicated by dot size. i, Chord plot showing that majority of endocardial (purple) BMP6-BMPR1A signaling is to cardiomyocytes (blue), followed by mural (brown) and fibroblasts (orange). Dot colour reflects the communication probabilities and dot size represents P-values computed from one-sided permutation test. AD – adipocyte; CM – cardiomyocyte; EC – endothelial cell; Endo – endocardial cell; FB – fibroblast; NC – neuronal cell; PC – pericyte; and SMC – smooth muscle cell.
Extended Data Fig. 8
Extended Data Fig. 8. DCM-PGS pheWAS adjusted for DCM/heart failure, and hypertension.
Manhattan plot of DCM-PGS associations after adjusting for DCM or heart failure (a), and hypertension (b) status in UK Biobank. Additional co-variates included in the linear regression model include sex, age, age2, and first ten principal components. ICD-9 and ICD-10 diagnostic codes are mapped to Phecode Map version 1.2. Mapped phenotypes exceeding phenome-wide significance threshold (P 2.7 × 10⁻⁵, red line, adjusted for the total number of tested phenotypes) are labelled. Blue line indicates nominal significance (P < 0.05). Direction of triangle indicates the direction of effect of the PGS association. P-values are two-sided and calculated from linear regression model, and not adjusted for multiple testing.

Similar articles

  • Genome-wide association study reveals mechanisms underlying dilated cardiomyopathy and myocardial resilience.
    Jurgens SJ, Rämö JT, Kramarenko DR, Wijdeveld LFJM, Haas J, Chaffin MD, Garnier S, Gaziano L, Weng LC, Lipov A, Zheng SL, Henry A, Huffman JE, Challa S, Rühle F, Verdugo CD, Krijger Juárez C, Kany S, van Orsouw CA, Biddinger K, Poel E, Elliott AL, Wang X, Francis C, Ruan R, Koyama S, Beekman L, Zimmerman DS, Deleuze JF, Villard E, Trégouët DA, Isnard R; FinnGen; VA Million Veteran Program; HERMES Consortium; Boomsma DI, de Geus EJC, Tadros R, Pinto YM, Wilde AAM, Hottenga JJ, Sinisalo J, Niiranen T, Walsh R, Schmidt AF, Choi SH, Chang KM, Tsao PS, Matthews PM, Ware JS, Lumbers RT, van der Crabben S, Laukkanen J, Palotie A, Amin AS, Charron P, Meder B, Ellinor PT, Daly M, Aragam KG, Bezzina CR. Jurgens SJ, et al. Nat Genet. 2024 Dec;56(12):2636-2645. doi: 10.1038/s41588-024-01975-5. Epub 2024 Nov 21. Nat Genet. 2024. PMID: 39572784 Free PMC article.
  • Analysis of cardiac magnetic resonance imaging in 36,000 individuals yields genetic insights into dilated cardiomyopathy.
    Pirruccello JP, Bick A, Wang M, Chaffin M, Friedman S, Yao J, Guo X, Venkatesh BA, Taylor KD, Post WS, Rich S, Lima JAC, Rotter JI, Philippakis A, Lubitz SA, Ellinor PT, Khera AV, Kathiresan S, Aragam KG. Pirruccello JP, et al. Nat Commun. 2020 May 7;11(1):2254. doi: 10.1038/s41467-020-15823-7. Nat Commun. 2020. PMID: 32382064 Free PMC article.
  • Shared genetic pathways contribute to risk of hypertrophic and dilated cardiomyopathies with opposite directions of effect.
    Tadros R, Francis C, Xu X, Vermeer AMC, Harper AR, Huurman R, Kelu Bisabu K, Walsh R, Hoorntje ET, Te Rijdt WP, Buchan RJ, van Velzen HG, van Slegtenhorst MA, Vermeulen JM, Offerhaus JA, Bai W, de Marvao A, Lahrouchi N, Beekman L, Karper JC, Veldink JH, Kayvanpour E, Pantazis A, Baksi AJ, Whiffin N, Mazzarotto F, Sloane G, Suzuki H, Schneider-Luftman D, Elliott P, Richard P, Ader F, Villard E, Lichtner P, Meitinger T, Tanck MWT, van Tintelen JP, Thain A, McCarty D, Hegele RA, Roberts JD, Amyot J, Dubé MP, Cadrin-Tourigny J, Giraldeau G, L'Allier PL, Garceau P, Tardif JC, Boekholdt SM, Lumbers RT, Asselbergs FW, Barton PJR, Cook SA, Prasad SK, O'Regan DP, van der Velden J, Verweij KJH, Talajic M, Lettre G, Pinto YM, Meder B, Charron P, de Boer RA, Christiaans I, Michels M, Wilde AAM, Watkins H, Matthews PM, Ware JS, Bezzina CR. Tadros R, et al. Nat Genet. 2021 Feb;53(2):128-134. doi: 10.1038/s41588-020-00762-2. Epub 2021 Jan 25. Nat Genet. 2021. PMID: 33495596 Free PMC article.
  • Polygenic Risk Scores in Dilated Cardiomyopathy: Towards the Future.
    Kramarenko DR, Jurgens SJ, Pinto YM, Bezzina CR, Amin AS. Kramarenko DR, et al. Curr Cardiol Rep. 2025 May 14;27(1):87. doi: 10.1007/s11886-025-02239-2. Curr Cardiol Rep. 2025. PMID: 40369171 Free PMC article. Review.
  • Inflammatory dilated cardiomyopathy (DCMI).
    Maisch B, Richter A, Sandmöller A, Portig I, Pankuweit S; BMBF-Heart Failure Network. Maisch B, et al. Herz. 2005 Sep;30(6):535-44. doi: 10.1007/s00059-005-2730-5. Herz. 2005. PMID: 16170686 Review.

Cited by

References

    1. Pinto, Y. M. et al. Proposal for a revised definition of dilated cardiomyopathy, hypokinetic non-dilated cardiomyopathy, and its implications for clinical practice: a position statement of the ESC working group on myocardial and pericardial diseases. Eur. Heart J.37, 1850–1858 (2016). - PubMed
    1. Arbelo, E. et al. 2023 ESC Guidelines for the management of cardiomyopathies. Eur. Heart J.44, 3503–3626 (2023). - PubMed
    1. Seferović, P. M. et al. Heart failure in cardiomyopathies: a position paper from the Heart Failure Association of the European Society of Cardiology. Eur. J. Heart Fail.21, 553–576 (2019). - PubMed
    1. Pirruccello, J. P. et al. Analysis of cardiac magnetic resonance imaging in 36,000 individuals yields genetic insights into dilated cardiomyopathy. Nat. Commun.11, 2254 (2020). - PMC - PubMed
    1. Lumbers, R. T. et al. The genomics of heart failure: design and rationale of the HERMES consortium. ESC Heart Fail.8, 5531–5541 (2021). - PMC - PubMed

Substances

LinkOut - more resources