. 2024 Dec;56(12):2636-2645.
doi: 10.1038/s41588-024-01975-5. Epub 2024 Nov 21.

Genome-wide association study reveals mechanisms underlying dilated cardiomyopathy and myocardial resilience

Sean J Jurgens #  1   2   3 Joel T Rämö #  2   3   4 Daria R Kramarenko #  1   5 Leonoor F J M Wijdeveld #  2   6 Jan Haas #  7   8 Mark D Chaffin #  2 Sophie Garnier #  9   10 Liam Gaziano #  2   3 Lu-Chen Weng  2   3 Alex Lipov  1 Sean L Zheng  11   12   13 Albert Henry  14   15 Jennifer E Huffman  16   17   18 Saketh Challa  2 Frank Rühle  19   20 Carmen Diaz Verdugo  2 Christian Krijger Juárez  1 Shinwan Kany  2   3   21 Constance A van Orsouw  22 Kiran Biddinger  2 Edwin Poel  1 Amanda L Elliott  4   18   23   24   25 Xin Wang  2 Catherine Francis  11   13 Richard Ruan  2 Satoshi Koyama  2   3 Leander Beekman  1 Dominic S Zimmerman  1 Jean-François Deleuze  26   27   28 Eric Villard  9   10 David-Alexandre Trégouët  27   29 Richard Isnard  9   10   30 FinnGenVA Million Veteran ProgramHERMES ConsortiumDorret I Boomsma  31 Eco J C de Geus  31   32 Rafik Tadros  1   33   34 Yigal M Pinto  1   5   35 Arthur A M Wilde  1   5   35 Jouke-Jan Hottenga  31   36 Juha Sinisalo  37   38 Teemu Niiranen  39   40   41 Roddy Walsh  1 Amand F Schmidt  35   42   43   44 Seung Hoan Choi  2   45 Kyong-Mi Chang  46   47 Philip S Tsao  48   49 Paul M Matthews  11   12 James S Ware  11   12   13   24 R Thomas Lumbers  15   50 Saskia van der Crabben  22 Jari Laukkanen  51   52 Aarno Palotie  4   53   54 Ahmad S Amin  1   5   35 Philippe Charron  9   10   30 Benjamin Meder  7   8 Patrick T Ellinor  55   56 Mark Daly  57   58   59 Krishna G Aragam  60   61 Connie R Bezzina  62   63
Affiliations

Genome-wide association study reveals mechanisms underlying dilated cardiomyopathy and myocardial resilience

Sean J Jurgens et al. Nat Genet. 2024 Dec.

Erratum in

  • Publisher Correction: Genome-wide association study reveals mechanisms underlying dilated cardiomyopathy and myocardial resilience.
    Jurgens SJ, Rämö JT, Kramarenko DR, Wijdeveld LFJM, Haas J, Chaffin MD, Garnier S, Gaziano L, Weng LC, Lipov A, Zheng SL, Henry A, Huffman JE, Challa S, Rühle F, Verdugo CD, Krijger Juárez C, Kany S, van Orsouw CA, Biddinger K, Poel E, Elliott AL, Wang X, Francis C, Ruan R, Koyama S, Beekman L, Zimmerman DS, Deleuze JF, Villard E, Trégouët DA, Isnard R; FinnGen; VA Million Veteran Program; HERMES Consortium; Boomsma DI, de Geus EJC, Tadros R, Pinto YM, Wilde AAM, Hottenga JJ, Sinisalo J, Niiranen T, Walsh R, Schmidt AF, Choi SH, Chang KM, Tsao PS, Matthews PM, Ware JS, Lumbers RT, van der Crabben S, Laukkanen J, Palotie A, Amin AS, Charron P, Meder B, Ellinor PT, Daly M, Aragam KG, Bezzina CR. Jurgens SJ, et al. Nat Genet. 2024 Dec;56(12):2843. doi: 10.1038/s41588-024-02047-4. Nat Genet. 2024. PMID: 39633063 Free PMC article. No abstract available.

Abstract

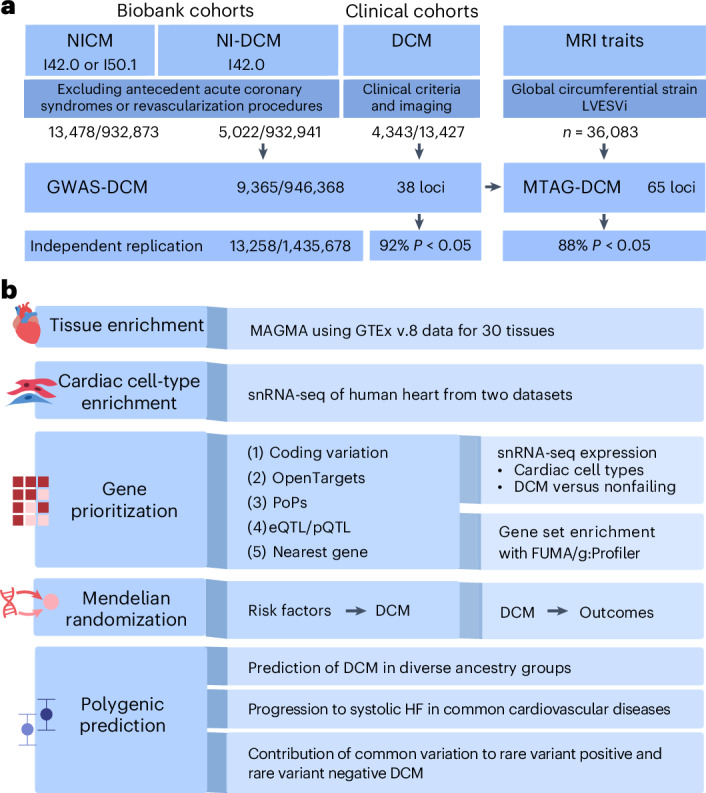
Dilated cardiomyopathy (DCM) is a heart muscle disease that represents an important cause of morbidity and mortality, yet causal mechanisms remain largely elusive. Here, we perform a large-scale genome-wide association study and multitrait analysis for DCM using 9,365 cases and 946,368 controls. We identify 70 genome-wide significant loci, which show broad replication in independent samples and map to 63 prioritized genes. Tissue, cell type and pathway enrichment analyses highlight the central role of the cardiomyocyte and contractile apparatus in DCM pathogenesis. Polygenic risk scores constructed from our genome-wide association study predict DCM across different ancestry groups, show differing contributions to DCM depending on rare pathogenic variant status and associate with systolic heart failure across various clinical settings. Mendelian randomization analyses reveal actionable potential causes of DCM, including higher bodyweight and higher systolic blood pressure. Our findings provide insights into the genetic architecture and mechanisms underlying DCM and myocardial function more broadly.


Conflict of interest statement

Competing interests: P.T.E. has received sponsored research support from Bayer AG, IBM Health, Bristol Myers Squibb and Pfizer; he has consulted for Bayer AG, Novartis and MyoKardia. K.G.A. has received sponsored research support from Sarepta Therapeutics and Bayer AG, and reports a research collaboration with Novartis. Y.M.P. is involved in the development of therapies for DCM as an advisor to Forbion and Medical Director at ARMGO pharma and CMO at Phlox Therapeutics. P.C. reports personal fees for consultancies, outside the present work, for Amicus, OWKIN, Pfizer and SANOFI. J.S.W. has received research support from Bristol Myers Squibb, and has acted as a consultant for MyoKardia, Pfizer, Foresite Labs, Health Lumen and Tenaya Therapeutics. The remaining authors declare no competing interests.

Figures

Fig. 1
Fig. 1. Study design and flowchart.
a, Design of genetic discovery analyses. GWAS were conducted in biobank cohorts for NICM and NI-DCM, and in clinical cohorts that ascertained DCM cases. GWAS results for NI-DCM and clinical DCM were aggregated in a meta-analysis (GWAS-DCM). GWAS-DCM was further combined with GWAS data for cardiac MRI traits (global circumferential strain and left ventricular end systolic volume) in an MTAG. Case and control numbers are represented as no. of cases/no. of controls. b, Various downstream analyses conducted using GWAS-DCM and MTAG-DCM results. We used tissue and cardiac-cell-type-specific enrichment analyses to identify tissues and cell types of relevance to DCM. To identify potentially causal genes from the analyses, five complementary methods were used to prioritize genes from associated loci. Prioritized genes were further evaluated in gene set enrichment and cell-type-specific DE analyses. To identify potential causes and consequences of DCM, we used Mendelian randomization analyses, modeling DCM both as exposure and outcome, across a range of common diseases and traits. PRS for DCM were constructed and their utility in predicting NI-DCM was assessed across different ancestries; we assessed the prediction of systolic heart failure across a range of clinical settings. Within the Amsterdam cohort, we assessed the predictive capacity of PRS for DCM, and assessed whether PRS distributions and contributions differed depending on rare pathogenic variant status.
Fig. 2
Fig. 2. Locus and gene discovery for DCM.
a, Miami plot for the GWAS and MTAG for DCM. Top, results from the GWAS meta-analysis for DCM (GWAS-DCM) that included 9,365 cases and 946,368 controls; bottom, results from the MTAG integrating the GWAS-DCM with cardiac MRI traits (MTAG-DCM). In both plots, the y axis represents the −log10 of the P value, and the x axis represents genomic positions (chromosome, and chromosomal positions) of variants, where each dot represents a single test statistic for a single variant. P values are derived from inverse-variance-weighted meta-analysis of logistic regression models (GWAS-DCM) or from MTAG analysis of such statistics (MTAG-DCM); reported P values are two-sided and unadjusted for multiple testing. The significance threshold is determined by the dotted lines at the conventional genome-wide level (α = 5 × 10−8). Significant loci are annotated with their most highly prioritized gene (Methods); loci not overlapping with previous genome-wide significant loci (from published DCM-GWAS or published multitrait studies) are highlighted in bold. b, Gene prioritization overview for the top prioritized genes from MTAG-DCM. The heatmaps show the different gene prioritization methods on the y axis and prioritized genes on the x axis. Genes are ordered from left to right based on their priority score (high to low); the top part of the heatmap shows the genes with the highest scores. A color mar indicates assignation of points based on the given prioritization method; prioritized genes were defined as genes with 2.5 or higher points, which were also the most highly prioritized in their respective loci. For a similar plot for GWAS-DCM, see Extended Data Fig. 6. coloc, colocalization analyses.
Fig. 3
Fig. 3. Cell-type-specific expression and DE of the top prioritized genes for DCM from three single-cell LV datasets.
Bubble-heatmap showing data collected from three published sn/scRNA-seq datasets of DCM and control LVs,,. The y axis represents a shortlist of highly prioritized genes from GWAS-DCM and MTAG-DCM (63 genes), while the x axis shows different LV cell types harmonized across the three expression datasets. Cell type expression data were computed by combining reformatted data from the three datasets, after restricting to LV samples from nonfailing donors (nmax = 61 donors; Supplementary Note and Supplementary Table 24). The size of the dots represent the percentage of nuclei/cells expressing a given gene in a given cell type at nonzero values, while the color of the dot represents the scaled relative normalized expression of the given gene in the given cell type (as compared with all other cell types). A black border indicates that the given gene is significantly differentially expressed in the given cell type in DCM LVs (nmax = 82 patients) as compared with the nonfailing LVs (nmax = 61 donors); significant DE was declared if the gene reached Padj < 0.05 with concordant direction of effect in at least two of the sn/scRNA-seq datasets within similar cell types (Supplementary Table 25). P values were derived from DEseq2 DE frameworks; P values are two-sided. Of note, not all cell types were assessed in DE testing in all three datasets, and therefore the approach is conservative for less-abundant cell types (for example, epicardial, adipocyte, lymphatic endothelial), although useful for more abundant cell types (for example, cardiomyocyte, fibroblast, cardiac endothelial). Padj, transcriptome-wide multiple-testing-adjusted two-sided P value.
Fig. 4
Fig. 4. Bidirectional MR screen for DCM and 73 common diseases and quantitative traits.
a, Bubble plot showing results from the MR screen using the WM method. Left panel, results from analysis modeling DCM as outcome; right panel, results modeling DCM as exposure. In both panels, the y axis represents the signed −log10 of the P value from the MR analysis where each bubble represents a different disease/trait (exposure or outcome) and −log10 (P values) are signed by the direction of the MR effect estimate. In both panels, the diseases/traits are ordered by their signed −log10 (P values) from high (left) to low (right). The full red and blue lines represent the Bonferroni-corrected significance level (P < 0.05; 146 tests), while the dotted lines represent P < 0.01. Traits/diseases reaching Bonferroni significance in the screen are annotated with their names. Reported P values are two-sided and unadjusted for multiple testing. b, Forest plots showing more detailed results and sensitivity analyses performed for two traits associated with increased DCM that passed all MR filters. Left panel, results for MR of bodyweight; right panel, results for SBP. The different MR effect estimates represent results from different methods: WM (discovery analysis), MR-Egger and CAUSE. The MR-Egger and WM P values are two-sided. For CAUSE, the P value is not based on the CI of the estimate, but rather represents a one-sided P value for the comparison with a pleiotropy model (Methods). For weight, ninstruments = 733 in the WM and MR-Egger analyses, while ninstruments = 2,286 in the CAUSE analysis. For SBP, ninstruments = 376 in the WM and MR-Egger analyses, while ninstruments = 1,846 in the CAUSE analysis. Error bars, 95% CIs for the estimated effect. All reported P values are unadjusted for multiple testing.
Fig. 5
Fig. 5. DCM genetic liability as a predictor of systolic HF across a range of settings in All of Us.
a, MR scatter plot for DCM liability on risk of HF. The x axis shows beta coefficients (±s.e.) for 37 genetic instruments identified from GWAS-DCM, while the y axis shows the corresponding beta coefficients on general HF. The estimated causal association lines for two methods are added, including the WM method (black line) and CAUSE (dotted line). b, Forest plot for associations of DCM PRS in the All of Us dataset: NI-DCM (n = 928/181,773 cases/controls);systolic HF (n = 5,123/190,410 cases/controls) and systolic HF after removing DCM/NICM (n = 4,273/189,976 cases/controls). Statistics are derived from logistic regression models (two-sided, unadjusted for multiple testing). c, Prevalence of systolic HF in the All of Us dataset across a range of settings, stratified by DCM PRS. Left, results for individuals who carry rare disease-causing variants for DCM (n = 1,429), where the y axis represents the percentage with systolic HF at any time and the x axis stratifies those individuals into low, middle and high PRS tertiles. Right, a similar plot restricting to three different clinical settings: after hypertension diagnosis (n = 76,985), after AF diagnosis (n = 11,369) and after myocardial infarction (n = 5,098). Cases with systolic HF coded before or concurrently to the index event were removed, leaving n = 3,877; 1,634 and 1,028 cases, respectively. Data are presented as percentages with 95% CIs. Beneath each setting, the OR and P value for PRS are added, from logistic regression with the quantitative PRS used as predictor (two-sided, unadjusted for multiple testing). ClinGen PLP, carriers of disease-causing rare variants for DCM; T1, tertile 1 of PRS; T2, tertile 2 of PRS; T3, tertile 3 of PRS.
Fig. 6
Fig. 6. Distribution and association of PRS among DCM patients by rare variant genotype status in the Amsterdam cohort.
a, Density plot with standardized PRS values for individuals from the Amsterdam UMC cohort on the x axis, and density representing the frequency of those PRS values in the cohort on the y axis. Dotted lines, means of the distributions. b, Forest plot showing effect sizes for the PRS in various subsets of the Amsterdam UMC dataset; x axis, ORs computed per s.d. of the standardized PRS distribution from logistic regression, adjusting for sex and ancestral PCs. Data are presented as estimated ORs with 95% CIs. c, Density plot with standardized PRS values on the x axis and density representing the frequency of those PRS values on the y axis. Dotted lines, means of the distributions. A two-sided P value from a linear regression model, testing the difference between genotype-positive and negative, is added. d, Forest plot showing effect sizes for the PRS where only genotype-positive or only genotype-negative cases are tested against the control cohort using logistic regression, adjusting for sex and ancestral PCs. Data are presented as estimated ORs with 95% CIs. Other performance metrics are presented in Supplementary Table 32. geno−, DCM case without a rare pathogenic or likely pathogenic rare variant; geno+, DCM case with a rare pathogenic or likely pathogenic rare variant.
Extended Data Fig. 1
Extended Data Fig. 1. Manhattan plots for biobank meta-analysis for NI-DCM and NICM.
Each panel shows a Manhattan for a GWAS meta-analysis of a phenotype across biobank datasets (FinnGen+UKB+MGB), where the top plot shows the results for the strict NI-DCM phenotype (N = 5,022 cases; N = 932,941 controls), and the bottom plot shows results for the broader NICM phenotype (N = 13,478 cases; N = 932,873 controls). In both figures, each dot represents a single tested variant, the x-axis shows genomic coordinates for those variants (chromosome, and position on chromosome), while the y-axis shows the -log10 of the P-value from GWAS. P-values are derived from inverse-variance-weighted meta-analysis of logistic regression models; reported P-values are two-sided and unadjusted for multiple testing. The red line indicates the conventional genome-wide significance level (alpha = 5 × 10−8). Loci reaching above the significance line are annotated with a gene name, where the annotated gene is harmonized with the locus name from our main GWAS (ie, highest prioritized gene in locus from GWAS-DCM/MTAG-DCM) for easy comparisons; sometimes an additional gene is highlighted to serve easier comparison to previously-published GWAS; if locus was not identified in GWAS-DCM/MTAG-DCM, the closest protein-coding gene is used. Note: GWAS, genome-wide association study; NICM, nonischemic cardiomyopathy; NI-DCM, nonischemic dilated cardiomyopathy.
Extended Data Fig. 2
Extended Data Fig. 2. Quantile-quantile plots for the final meta-analysis (GWAS-DCM) and the final MTAG analysis (MTAG-DCM).
The quantile-quantile plots show results for the GWAS meta-analysis of DCM (left) and for the MTAG analysis of DCM with cardiac MRI traits (right). In each quantile-quantile plot, the x-axis represents the expected -log10 of the P-value of variants under the null hypothesis, while the y-axis represents the observed -log10 of the P-value in the analysis. The top corner shows calibration statistics, namely i) the inflation factor lambda, computed as the observed X^2 statistic at the median over the expected under the null, from all plotted variants, ii) the inflation factor computed by LDSC, which filters to high-confidence common genetic variants found in their internal reference, iii) the LDSC intercept which quantifies the residual inflation (computed as the intercept in a regression of X^2 statistics over linkage-disequilibrium scores), due to biases. P-values are derived from inverse-variance-weighted meta-analysis of logistic regression models (GWAS-DCM) or from MTAG analysis of such results (MTAG-DCM); reported P-values are two-sided and unadjusted for multiple testing. Note: GWAS, genome-wide association study; MTAG, multi-trait analysis GWAS; DCM, dilated cardiomyopathy; LDSC, linkage-disequilibrium score regression.
Extended Data Fig. 3
Extended Data Fig. 3. Venn Diagram highlighting the loci identified in GWAS-DCM and MTAG-DCM.
This Venn diagram shows loci that were significantly associated in GWAS-DCM, MTAG-DCM, or both. The right ellipse shows results from GWAS-DCM, the left ellipse shows results from MTAG-DCM, and the overlapping area shows loci found in both. A genomic locus was defined based on distance, taking the top index variant in a region, and merging with other potential index variants if within a 1 Mb window up or downstream (and merging MTAG-DCM and GWAS-DCM loci based on distance as well). Loci are annotated with the most highly-prioritized gene using our methodology (Methods); in case of different genes prioritized by MTAG-DCM or GWAS-DCM (for overlapping loci), one was chosen at random for annotation. Loci are also annotated with the genomic coordinates (chromosome:position in megabases) for GRCh37. Loci annotated in red were ‘novel’, which was defined as: Not within 1 Mb distance with a previously described locus from a peer-reviewed published genome-wide association study for DCM, or MTAG for DCM, by querying GWAScatalog, OpenTargets and two previous larger studies,. Note: GWAS, genome-wide association study; MTAG, multi-trait analysis GWAS; DCM, dilated cardiomyopathy.
Extended Data Fig. 4
Extended Data Fig. 4. Independent replication of GWAS-DCM and MTAG-DCM loci.
The figure shows the summary of the replication effort performed within HERMES, the Million Veteran’s Program (MVP) and All of Us (AoU) datasets. Part a shows the replication effort for GWAS-DCM loci, while part b shows results for replication of the MTAG-DCM loci. In both parts, data are restricted to loci passing quality-control for replication, and are restricted to a single lead variant per locus (the lead variant with strongest significance in discovery). The left panels show dot plots, with on the x-axis the effect sizes from discovery (ie, GWAS-DCM or MTAG-DCM) and on the y-axis the estimated effect size from the replication set (a meta-analysis of independent cohorts/samples from HERMES, MVP, and AoU), totalling up to 13,258 DCM/NICM cases and 1,435,287 controls (see Supplementary Note and Supplementary Tables 13 and 14). Data represent estimated beta coefficients ± standard errors. A trend line from linear regression is added to the plot, with the estimated beta coefficient and standard error from this regression added to the top left of the panels. Genes showing substantial deviation from the line are annotated with their gene names. The right panels represent bar charts that show the replication rate (ie, the percentage of replicating loci) using different definitions for replication; the green bars (left) represent directional concordance, the light blue bars (middle) represent replication at nominal unadjusted one-sided P < 0.05, while the dark blue (right) bars represent replication at Bonferroni-adjusted significance (one-sided P < 0.05/# loci) which leaves cutoffs of P < 0.0014 and P < 0.002 in part a and cutoffs of P < 0.00078 and P < 0.0015 in part b. Given the estimated attenuation of effect sizes for previously-established DCM loci, we computed ‘expected’ replication rates under the assumption that all loci are true and share the same degree of attenuation (Supplementary Note); the expected replication rates are added as light gray bars behind the colored bars. Note: OR, odds ratio.
Extended Data Fig. 5
Extended Data Fig. 5. Cardiac cell type enrichment of DCM heritability from two snRNA sequencing datasets.
Bar charts represent the -log10 of the P-value from the analysis testing for enrichment of cell type-specific gene programs in our GWAS/MTAG results. The x-axis shows different cell types from the respective snRNAseq datasets. Part a shows results from enrichment analysis using the Chaffin et al. snRNAseq dataset, while part b shows results for the Reichart et al. snRNAseq dataset. The dotted lines represent the significance cutoffs within the panel, using a Bonferroni correction for the number of included cell types. The left panels show the results from testing for enrichment of GWAS-DCM heritability, while the right panels show results for testing for enrichment of MTAG-DCM heritability. P-values are derived from the Tau statistic from stratified LD score regression, and represent one-sided P-values that are unadjusted for multiple testing. Note: GWAS, genome-wide association study; MTAG, multi-trait analysis GWAS; DCM, dilated cardiomyopathy.
Extended Data Fig. 6
Extended Data Fig. 6. Gene prioritization scores for top prioritized genes from GWAS-DCM.
The bottom side of the figure shows a heatmap with different gene prioritization methods on the y-axis and highly-prioritized genes on the x-axis. The top side of the figure shows the corresponding gene prioritization scores, represented in bar charts, that show the sum of the individual components from the heatmap. Genes are ordered from left to right based on their priority score (high to low). In the heatmap, a very light blue panel indicates no points, a middle-blue panel indicates 0.5 points, while a dark blue panel indicates 1 point assigned to the given gene based on the given prioritization method. Highly-prioritized genes were defined as genes with 2.5 or higher points, which were also the most highly-prioritized genes in their respective loci. For the similar plot for MTAG-DCM, see Fig. 2b. Note: GWAS, genome-wide association study; DCM, dilated cardiomyopathy; MTAG, multi-trait analysis GWAS; PoPs, polygenic priority score method; eQTL, expression quantitative trait locus; pQTL, protein quantitative trait locus.
Extended Data Fig. 7
Extended Data Fig. 7. Associations between polygenic risk score and DCM across three European ancestry datasets.
This forest plot shows association results for the PRS constructed from GWAS-DCM and MTAG-DCM with DCM status across three different datasets. In all cases, association data are shown in a European ancestry ‘testing set’ (dataset in which PRS is tested) that is made as independent as possible from the ‘training data’ (ie, the base GWAS and MTAG data used to construct PRS). In the Amsterdam UMC (AUMC) dataset, AUMC samples were omitted from the PRS training data, and PRS was used to discriminate clinical DCM cases (N = 783) from referents (N = 6,978). In the All of Us (AoU) dataset, samples from Massachusetts General Hospital (MGB) were omitted from the PRS training data, and PRS was used to discriminate NI-DCM cases (N = 506) from controls (N = 95,510). In the UK Biobank (UKB) dataset, samples from UKB were omitted from the base GWAS, and participants were excluded from the testing set if they contributed to the MRI sub-study of UKB (first 45k); PRS was used to discriminate NI-DCM cases (N = 793) from controls (N = 325,313). All PRS were constructed using the PRScs algorithm (Methods). In the plot, the x-axis shows odds ratios per standard deviation of the PRS distribution, estimated from logistic regression (adjusted at least for ancestral principal components in all cases). Data are presented as estimated odds ratios with 95% confidence intervals.The first three rows with dark green color show results for PRS constructed from GWAS-DCM, while the bottom three rows in light green color show results for PRS constructed from MTAG-DCM. On the right of the plot we show the R^2 for each PRS in the respective dataset, where R^2 represents the residual variance explained by the PRS (computed as the improvement of model R^2 inclusive of PRS as compared to the model without PRS, divided by the proportion of residual variance); all R^2 values were computed on the liability-scale to allow better comparisons across datasets. Note: Other performance metrics are presented in Supplementary Table 41. GWAS, genome-wide association study; DCM, dilated cardiomyopathy; NI-DCM, nonischemic dilated cardiomyopathy; MTAG, multi-trait analysis of GWAS; OR, odds ratio; 95%CI, 95% confidence interval; SD, standard error; R^2, variance explained.
Extended Data Fig. 8
Extended Data Fig. 8. Associations between DCM polygenic risk score and NI-DCM across different ancestries in the All of Us dataset.
This forest plot shows association results for the PRS constructed from GWAS-DCM and MTAG-DCM with NI-DCM in the All of Us dataset. PRS were constructed using the PRScs algorithm (Methods), with x-axis showing odds ratios per standard deviation of the PRS distribution, estimated from logistic regression, adjusting for age, age^2, sex and ancestral principal components. Data are presented as estimated odds ratios with 95% confidence intervals. The figure shows results for all samples (N = 928 cases and 181,773 controls), European ancestry only (N = 506 cases and 95,510 controls), African ancestry only (N = 246 cases and 36,864 controls), and Admixed-American ancestry only (N = 107 cases and 28,784 controls). The top of the figure shows results for the PRS constructed from GWAS-DCM, while the bottom shows results for PRS constructed from MTAG-DCM. Reported P-values are two-sided and unadjusted for mutliple testing. Note: Other performance metrics are presented in Supplementary Table 32. GWAS, genome-wide association study; NI-DCM, nonischemic dilated cardiomyopathy; MTAG, multi-trait analysis of GWAS; OR, odds ratio; 95%CI, 95% confidence interval; SD, standard error.
Extended Data Fig. 9
Extended Data Fig. 9. The additive contribution of PRS and rare pathogenic variants to NI-DCM risk in the All of Us dataset.
The figures show bar charts, where the x-axis shows different strata based on genetics, including three tertiles of PRS (tertile one [T1] in very-light blue, tertile two [T2] in light blue, and tertile three [T3] in dark blue) and two strata based on rare variant carrier status, that is non-carriers and carriers of rare pathogenic or likely pathogenic variants for DCM. The y-axis shows the estimated odds ratio for the given group as compared to a reference group; odds ratios were estimated using logistic regression analyses. Data are presented as estimated odds ratios with 95% confidence intervals. Part a shows results inclusive of all individuals passing our quality-control in All of Us (N = 928 cases and 181,773 controls), while part b is additionally restricted to samples with genetically-determined European ancestry (N = 506 cases and 95,510 controls). In both parts, the left panel shows results where the reference group is represented by individuals without rare variants in the second tertile of PRS; the right panel shows results where the reference group is represented by individuals without rare variants who are in the first tertile of PRS. Note: NI-DCM, nonischemic dilated cardiomyopathy; P/LP, likely pathogenic or pathogenic rare variants; CI, confidence interval; ALL, all individuals irrespective of ancestry; EUR, individuals of genetically-determined European ancestry.

References

    1. Schultheiss, H.-P. et al. Dilated cardiomyopathy. Nat. Rev. Dis. Prim.5, 32 (2019). - PMC - PubMed
    1. McNally, E. M. & Mestroni, L. Dilated cardiomyopathy: genetic determinants and mechanisms. Circ. Res.121, 731–748 (2017). - PMC - PubMed
    1. McDonagh, T. A. et al. 2021 ESC Guidelines for the diagnosis and treatment of acute and chronic heart failure. Eur. Heart J.42, 3599–3726 (2021). - PubMed
    1. Arbelo, E. et al. 2023 ESC Guidelines for the management of cardiomyopathies. Eur. Heart J.44, 3503–3626 (2023). - PubMed
    1. Seferović, P. M. et al. Heart failure in cardiomyopathies: a position paper from the Heart Failure Association of the European Society of Cardiology. Eur. J. Heart Fail.21, 553–576 (2019). - PubMed

LinkOut - more resources