. 2025 Feb;15(2):335-345.
doi: 10.1002/2211-5463.13930. Epub 2024 Nov 21.

Effect of Cordyceps militaris extract containing cordycepin on the adipogenesis and lipolysis of adipocytes

Affiliations

Effect of Cordyceps militaris extract containing cordycepin on the adipogenesis and lipolysis of adipocytes

Kazuya Kusama et al. FEBS Open Bio. 2025 Feb.

Abstract

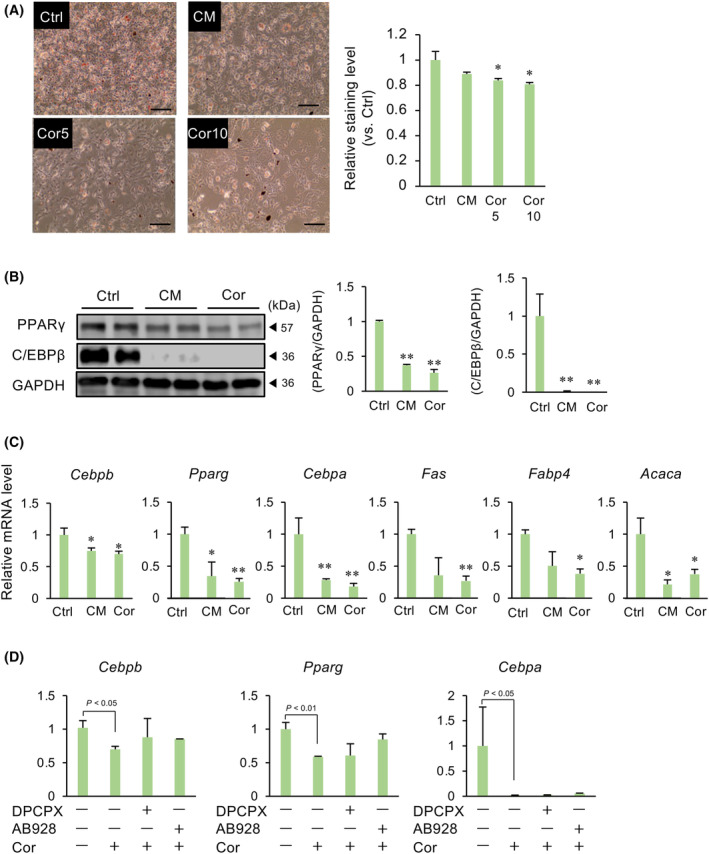
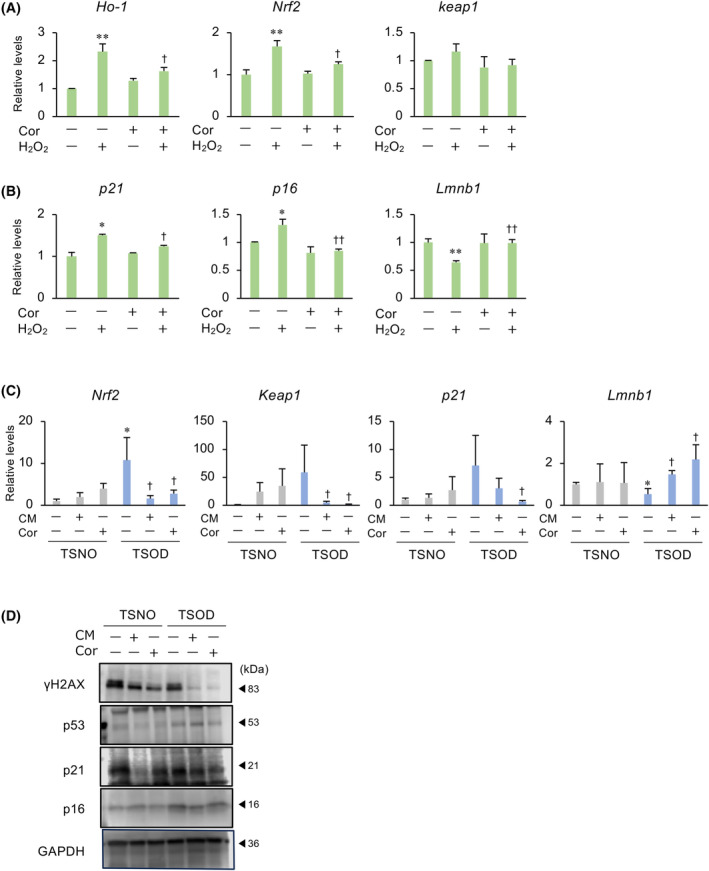
Obesity, a global health concern, results from an energy imbalance leading to lipid accumulation. In the present study, Cordyceps militaris extract (CM) and its primary component, cordycepin, were investigated to characterize their potential effects on adipogenesis and lipolysis. Treatment with CM or cordycepin reduced lipid droplets and increased hormone-sensitive lipase activation in 3T3-L1 cells. In a diabetic obese mouse model, CM and cordycepin lowered serum low-density lipoprotein/very low-density lipoprotein levels and reduced oxidative stress and cell senescence markers. Thus, cordycepin inhibits preadipocyte differentiation and promotes lipolysis, which may serve as a novel obesity treatment. Further studies, including clinical trials, are required to validate the clinical potential of cordycepin.

Keywords: Cordyceps militaris; adipocyte; cell senescence; cordycepin; oxidative stress.


Conflict of interest statement

The authors declare that they have no conflicts of interest.

Figures

Fig. 1
Fig. 1
Effects of CM and cordycepin (Cor) on the differentiation of 3T3‐L1 preadipocytes into adipocytes. 3T3‐L1 cells were cultured in a differentiation medium in the presence of CM (50 μg·mL−1) or cordycepin (5 or 10 μg·mL−1) for 3 days, and then cultured in a normal medium with insulin for 3 days and in a normal medium for 1 day. (A) Lipid droplets were visualized with Oil Red O solution. The graph shows the relative level measured at 500 nm absorbance. The levels were normalized by the number of total cells each well. Values represent the mean ± SEM from three independent experiments performed in triplicates. *P < 0.05 vs. Ctrl. Scale bar = 100 μm. (B) Lysates prepared from adipocytes treated with CM or Cor were subjected to immunoblotting. Gapdh served as a loading control. The relative expression of target proteins, normalized to that of Gapdh, is shown. Values are the mean ± SEM. **P < 0.01 vs. Ctrl. (C) Changes in the expression of adipocyte differentiation markers were determined after CM or Cor (10 μg·mL−1) treatment using quantitative PCR. Gapdh was used as the reference gene. Values represent the mean ± SEM of three independent experiments performed in triplicates. *P < 0.05, **P < 0.01 vs. Ctrl. (D) Cells were cultured in a differentiation medium in the presence of 8‐cyclopentyl‐1,3‐dipropylxanthine (10 μg·mL−1), AB928 (1 μg·mL−1) and Cor (10 μg·mL−1) for 3 days, and then cultured normal medium with insulin for 3 days and normal medium for 1 day. Changes in the expression of adipocyte differentiation markers were determined. Gapdh was used as the reference gene. Values represent the mean ± SEM of three independent experiments. Dunnett's test was used to determine statistical significance.
Fig. 2
Fig. 2
Effects of CM and cordycepin (Cor) on the lipolysis of adipocytes. Matured adipocytes were treated with CM (50 μg·mL−1) or Cor (10 μg·mL−1) for 24 h. (A) Lipid droplets were visualized with Oil Red O solution. The graph shows the relative stained level measured at 500 nm absorbance. The levels were normalized by the number of total cells each well. Values represent the mean ± SEM from three independent experiments performed in triplicates. *P < 0.05, **P < 0.01 vs. Ctrl. Scale bar = 100 μm. (B) Lysates prepared from adipocytes treated with CM or Cor were subjected to immunoblotting. GAPDH served as a loading control. The relative expression of phosphorylated HSL proteins, normalized to total HSL proteins, is shown. Values represent the mean ± SEM. **P < 0.01 vs. Ctrl. (C) Cultured media of matured adipocytes treated with CM or Cor were subjected to glycerol assay. Values represent the mean ± SEM from three independent experiments performed in triplicates. Dunnett's test was used to determine statistical significance.
Fig. 3
Fig. 3
Effects of CM and cordycepin (Cor) on the adipogenesis in mouse diabetic model. TSOD or TSNO mice were fed a diet containing CM (0.1%) or Cor (0.000357%) for 21 days. The total body weight (A), the weights of adipose tissue (B), and the concentrations of serum glucose (C), triglyceride (D) or cholesterol (E) were measured on the next day after administration of CM or Cor into TSNO or TSOD mice. Data represent the mean ± SEM of five mice. (F) Changes in Cebpb, Pparg, Cebpa, Adipoq, Lep, Acaca and Fabp4 mRNA levels in the adipose tissue. Gapdh was used as an internal control for RNA integrity. Data from five individual animals are shown. *P < 0.05 vs. TSNO‐Ctrl. P < 0.05 vs. TSOD‐Ctrl. (G) Lysates prepared from adipose tissue were subjected to immunoblotting. GAPDH served as a loading control. Dunnett's test was used to determine statistical significance.
Fig. 4
Fig. 4
Effects of CM and cordycepin (Cor) on the oxidative stress and senescence in adipocytes. (A, B) 3T3‐L1 cells were treated with H₂O₂ (200 μm) and/or Cor (10 μg·mL−1) for 48 h. Changes in the expression of oxidative stress markers (A) and cell senescence markers (B) were determined using quantitative PCR. Gapdh was used as the reference gene. Values represent the mean ± SEM of three independent experiments performed in triplicates. *P < 0.05, **P < 0.01 vs. Ctrl. P < 0.05, †† P < 0.01 vs. H₂O₂ treatment. (C) TSOD or TSNO mice were fed a diet containing CM (0.1%) or Cor (0.000357%) for 21 days. Changes in oxidative stress marker and cell senescence marker mRNA levels in the adipose tissue. Gapdh was used as an internal control for RNA integrity. Data from five individual animals are shown. *P < 0.05 vs. TSNO‐Ctrl. P < 0.05 vs. TSOD‐Ctrl. (D) Lysates prepared from adipose tissue were subjected to immunoblotting. GAPDH served as a loading control. Dunnett's test was used to determine statistical significance.

Similar articles

References

    1. Styne DM, Arslanian SA, Connor EL, Farooqi IS, Murad MH, Silverstein JH and Yanovski JA (2017) Pediatric obesity‐assessment, treatment, and prevention: an Endocrine Society clinical practice guideline. J Clin Endocrinol Metab 102, 709–757. - PMC - PubMed
    1. Kopelman PG (2000) Obesity as a medical problem. Nature 404, 635–643. - PubMed
    1. Ahmadian M, Duncan RE and Sul HS (2009) The skinny on fat: lipolysis and fatty acid utilization in adipocytes. Trends Endocrinol Metab 20, 424–428. - PMC - PubMed
    1. Jaworski K, Sarkadi‐Nagy E, Duncan RE, Ahmadian M and Sul HS (2007) Regulation of triglyceride metabolism. IV. Hormonal regulation of lipolysis in adipose tissue. Am J Physiol Gastrointest Liver Physiol 293, G1–G4. - PMC - PubMed
    1. Brasaemle DL (2010) Lipolysis control: the plot thickens. Cell Metab 11, 173–174. - PubMed

LinkOut - more resources