. 2024 Aug 26;32(18):31142-31161.
doi: 10.1364/OE.529199.

High refresh rate display for natural monocular viewing in AOSLO psychophysics experiments

High refresh rate display for natural monocular viewing in AOSLO psychophysics experiments

Benjamin Moon et al. Opt Express. .

Abstract

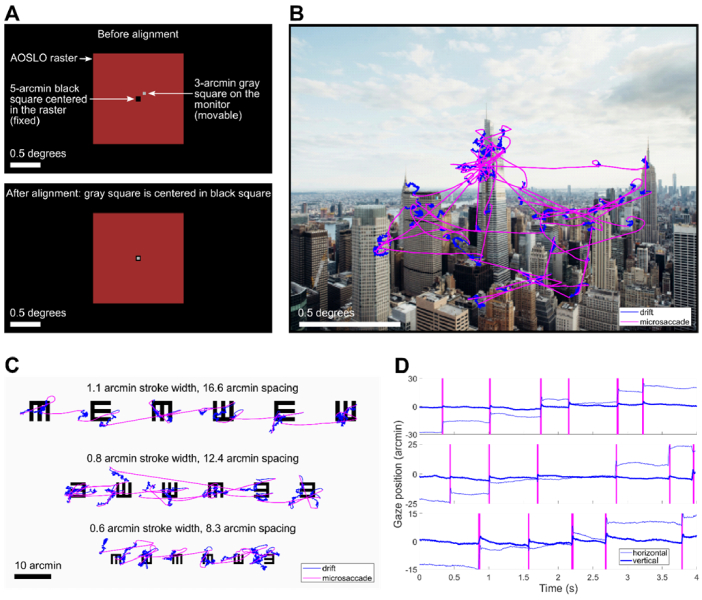
By combining an external display operating at 360 frames per second with an adaptive optics scanning laser ophthalmoscope (AOSLO) for human foveal imaging, we demonstrate color stimulus delivery at high spatial and temporal resolution in AOSLO psychophysics experiments. A custom pupil relay enables viewing of the stimulus through a 3-mm effective pupil diameter and provides refractive error correction from -8 to +4 diopters. Performance of the assembled and aligned pupil relay was validated by measuring the wavefront error across the field of view and correction range, and the as-built Strehl ratio was 0.64 or better. High-acuity stimuli were rendered on the external display and imaged through the pupil relay to demonstrate that spatial frequencies up to 54 cycles per degree, corresponding to 20/11 visual acuity, are resolved. The completed external display was then used to render fixation markers across the field of view of the monitor, and a continuous retinal montage spanning 9.4 by 5.4 degrees of visual angle was acquired with the AOSLO. We conducted eye-tracking experiments during free-viewing and high-acuity tasks with polychromatic images presented on the external display. Sub-arcminute eye position uncertainty was achieved over a 1.5 by 1.5-degree trackable range, enabling precise localization of the line of sight on the stimulus while simultaneously imaging the fine structure of the human central fovea. This high refresh rate display overcomes the temporal, spectral, and field of view limitations of AOSLO-based stimulus presentation, enabling natural monocular viewing of stimuli in psychophysics experiments conducted with AOSLO.


Conflict of interest statement

The authors declare that there are no conflicts of interest related to this article.

Figures

Fig. 1.
Fig. 1.
System layout showing the high-speed display integrated with our custom AOSLO [44]. A 7.2-mm diameter beam exits the AOSLO, consisting of 840 nm imaging light and 940 nm wavefront sensing light to measure and correct ocular aberrations. The AOSLO field of view is adjusted to its maximum value of 1.5 degrees to enable imaging and eye-tracking over a larger region of the retina compared with the standard 1-degree field of view. A 360 Hz monitor is positioned across the room from where the subject is seated. Light from the monitor is directed toward a fold mirror and then through the entrance pupil of a custom optical relay. After passing through the two lens groups of the optical relay, the visible light from the monitor is reflected off a dichroic mirror toward the eye. Imaging and eye-tracking, both working at 840 nm, are conducted with the AOSLO while visual stimuli are presented on the 360 Hz monitor and viewed through an external pupil with a diameter of 3 mm.
Fig. 2.
Fig. 2.
Lens drawing of the optical relay showing the motion of the moving group across the full correction range from -8 diopters to +4 diopters. The lenses and the aperture that make up the moving group are attached to a lens tube, and the whole assembly moves together on a motorized translation stage. The total travel range of the moving group is 280 mm (11 inches). The eye clearance from the edge of the dichroic mirror to the eye pupil is 83 mm.
Fig. 3.
Fig. 3.
Performance evaluation for the optical design of the custom optical relay. Polychromatic MTF curves are shown for different refractive error correction settings. The dashed horizontal and vertical lines show the MTF value at 30 cycles per degree, which is greater than 0.45 for all fields and configurations. The maximum RMS wavefront error for each configuration is also reported, and all values are better than the performance target of 0.07 waves for the design.
Fig. 4.
Fig. 4.
Mechanical layout of the external display components. A. A CAD model shows the custom optical relay design. A moving lens group, which includes a 3-mm diameter aperture stop, translates vertically on a motorized stage. A dichroic mirror combines the high-speed display with the AOSLO and is mounted on a precision flip mount, enabling the high-speed display to be quickly added or removed from the full system. B. The external display after integration with the AOSLO. The optical axis for the custom optical relay is traced from the monitor to the eye pupil to demonstrate the light path.
Fig. 5.
Fig. 5.
Wavefront measurements across the field of view for the 0-diopter configuration. Measurements were collected at 17 different points across the field of view. The reported values are the RMS wavefront error after subtracting the field-averaged residual focus and the piston, tip, and tilt for each field point measurement. The RMS wavefront error satisfies the diffraction limit for the horizontal and vertical meridians across the full field of view, but some of the diagonal points are slightly above the diffraction-limited criterion, while still meeting the as-built performance target of less than 0.114 waves. Over the full field of view, the maximum RMS wavefront error is 0.079 waves, which occurs toward the lower left corner of the field of view. The average RMS wavefront error is 0.054 waves. The units are waves at 543 nm, which is the wavelength used for testing.
Fig. 6.
Fig. 6.
Resolution measurement of the assembled and aligned optical relay. A. A custom tumbling E test stimulus was designed and displayed on the monitor. It was then imaged with a fixed-focal-length camera. The test stimulus was placed in the center and each of the four corners of the monitor to assess resolution over the full field of view. B. Magnified view of the smallest features in the test stimulus, showing that row 5 is resolved. C. Further magnified view of row 5 with lines drawn to show where the pixel value lineouts were sampled. D. Pixel value lineouts for the three vertical lines. E. Pixel value lineouts for the three horizontal lines.
Fig. 7.
Fig. 7.
Full-field composite retinal image of a healthy human retina captured with the AOSLO using 840 nm imaging light and visible fixation markers presented across the full field of view of the display. A. The image spans 9.4 × 5.4 degrees of visual angle and encompasses the entirety of the 5-degree fovea. The dark region at the center of the image is the foveola, where cones are smallest and most densely packed. Superior retina is oriented up and nasal retina is to the right in the image. The subject’s right eye was imaged. B. Magnified inset (3x magnification) of the nasal retina showing the variation in cone size and packing from the edge of the foveola at the left side of the inset (0.43 degrees eccentricity) into the parafovea at the right side of the inset (3.56 degrees of eccentricity).
Fig. 8.
Fig. 8.
Results from the eye-tracking tasks conducted with the combined AOSLO and external display. A. Illustration of the alignment procedure for registering the monitor coordinates to the center of the AOSLO raster. The subject moved a 3-arcmin gray square on the monitor until it was centered in a 5-arcmin square rendered at the center of the AOSLO raster. B. Eye movements during the free-viewing task overlaid on the image that the subject viewed. The subject exhibited microsaccades and drifts while exploring the image during a 30-second viewing interval. C. Eye movements during the high-acuity task overlaid on the eye chart image that the subject viewed. Each line of the eyechart was viewed during a 10-second interval D. Time-course of the eye movements during the high-acuity task trimmed to 4-seconds for each line. The three rows correspond to the three rows of the eye chart, and the y-axis scale is adjusted for each line to account for the difference in microsaccade amplitude between the rows. The vertical magenta bars denote microsaccades.

Update of

Similar articles

Cited by

References

    1. Liang J., Williams D. R., Miller D. T., “Supernormal vision and high-resolution retinal imaging through adaptive optics,” J. Opt. Soc. Am. A 14(11), 2884 (1997). 10.1364/JOSAA.14.002884 - DOI - PubMed
    1. Roorda A., Romero-Borja F., Donnelly W. J. I., et al. , “Adaptive optics scanning laser ophthalmoscopy,” Opt. Express 10(9), 405–412 (2002). 10.1364/OE.10.000405 - DOI - PubMed
    1. Grieve K., Tiruveedhula P., Zhang Y., et al. , “Multi-wavelength imaging with the adaptive optics scanning laser Ophthalmoscope,” Opt. Express 14(25), 12230 (2006). 10.1364/OE.14.012230 - DOI - PubMed
    1. Hammer D. X., Ferguson R. D., Bigelow C. E., et al. , “Adaptive optics scanning laser ophthalmoscope for stabilized retinal imaging,” Opt. Express 14(8), 3354 (2006). 10.1364/OE.14.003354 - DOI - PMC - PubMed
    1. Gómez-Vieyra A., Dubra A., Malacara-Hernández D., “First-order design of off-axis reflective ophthalmic adaptive optics systems using afocal telescopes,” Opt. Express 17(21), 18906 (2009). 10.1364/OE.17.018906 - DOI - PMC - PubMed

LinkOut - more resources