Microalgae and cyanobacteria as microbial substrate and their influence on the potential postbiotic capability of a bacterial probiotic
- PMID: 39573896
- PMCID: PMC11582085
- DOI: 10.1111/1751-7915.70046
Microalgae and cyanobacteria as microbial substrate and their influence on the potential postbiotic capability of a bacterial probiotic
Abstract
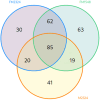
Postbiotics are metabolic by-products from microorganisms that provide health benefits to the host. Their secretion can be influenced by various conditions affecting bacterial metabolism. This study presents a novel approach for producing potential postbiotics, specifically extracellular products (ECPs), from the probiotic strain Shewanella putrefaciens SpPdp11, grown under different culture conditions. These conditions include aquafeed media, with partial or total microalgae/cyanobacteria replacement as the microbial substrate, as well as variations in temperature and growth phase. The use of microalgae/cyanobacteria as substrates may represent a valuable strategy for generating novel postbiotics with unique properties. The ECPs assessed were evaluated for their in vitro cytotoxic, hydrolytic and antimicrobial activities. Three conditions (ECPs derived from aquafeed media with partial (FM2324 and FM1548) or total (M2324) microalgae/cyanobacteria replacement) were non-cytotoxic to various fish cell lines and hydrolysed key nutritional compounds (casein, lipids, amylase and gelatin). Proteomic analysis of these ECP conditions revealed common structural and regulatory DNA-associated proteins, while differentially expressed proteins were associated with amino acid metabolism and antioxidant system (FM2324 and FM1548) and chemotaxis system (M2324). The results highlight the potential of the selected postbiotics as feed additives for future in vivo studies, aligning with sustainable development for aquaculture.
© 2024 The Author(s). Microbial Biotechnology published by John Wiley & Sons Ltd.
Conflict of interest statement
The authors declare no conflict of interest.
Figures


Similar articles
-
Evaluation of the Differential Postbiotic Potential of Shewanella putrefaciens Pdp11 Cultured in Several Growing Conditions.Mar Biotechnol (NY). 2024 Feb;26(1):1-18. doi: 10.1007/s10126-023-10271-y. Epub 2023 Dec 28. Mar Biotechnol (NY). 2024. PMID: 38153608 Free PMC article.
-
Dietary administration of the probiotic Shewanella putrefaciens Pdp11 promotes transcriptional changes of genes involved in growth and immunity in Solea senegalensis larvae.Fish Shellfish Immunol. 2018 Jun;77:350-363. doi: 10.1016/j.fsi.2018.04.018. Epub 2018 Apr 7. Fish Shellfish Immunol. 2018. PMID: 29635066
-
Potential of microalgae as a sustainable feed ingredient for aquaculture.J Biotechnol. 2021 Nov 20;341:1-20. doi: 10.1016/j.jbiotec.2021.09.003. Epub 2021 Sep 15. J Biotechnol. 2021. PMID: 34534593 Review.
-
Co-bioaugmentation with microalgae and probiotic bacteria: Sustainable solutions for upcycling of aquaculture wastewater and agricultural residues into microbial-rice bran complexes.Environ Res. 2024 Nov 15;261:119760. doi: 10.1016/j.envres.2024.119760. Epub 2024 Aug 8. Environ Res. 2024. PMID: 39121700
-
A perspective on biotechnological applications of thermophilic microalgae and cyanobacteria.Bioresour Technol. 2019 Apr;278:424-434. doi: 10.1016/j.biortech.2019.01.063. Epub 2019 Jan 17. Bioresour Technol. 2019. PMID: 30685131 Review.
Cited by
-
Metabolite-Driven Modulation of Biofilm Formation in Shewanella: Insights from Shewanella sp. Pdp11 Extracellular Products.Microb Ecol. 2025 May 27;88(1):55. doi: 10.1007/s00248-025-02552-x. Microb Ecol. 2025. PMID: 40423845 Free PMC article.
References
-
- Ahmad, A. , Abdullah, S.R.S. , Hasan, H.A. , Othman, A.R. & Ismail, N.I. (2021) Aquaculture industry: supply and demand, best practices, effluent and its current issues and treatment technology. Journal of Environmental Management, 287, 112271. Available from: 10.1016/j.jenvman.2021.112271 - DOI - PubMed
-
- Ali, M.M. , Provoost, A. , Mijnendonckx, K. , van Houdt, R. & Charlier, D. (2020) DNA‐binding and transcription activation by unphosphorylated response regulator AgrR from Cupriavidus metallidurans involved in silver resistance. Frontiers in Microbiology, 11, 1635. Available from: 10.3389/fmicb.2020.01635 - DOI - PMC - PubMed
-
- Arijo, S. , Rico, R. , Chabrillon, M. , Diaz‐Rosales, P. , Martinez‐Manzanares, E. , Balebona, M.C. et al. (2005) Effectiveness of a divalent vaccine for sole, Solea senegalensis (Kaup), against Vibrio harveyi and Photobacterium damselae subsp. piscicida. Journal of Fish Diseases, 28, 33–38. Available from: 10.1111/j.1365-2761.2004.00597.x - DOI - PubMed
Publication types
MeSH terms
Substances
Grants and funding
LinkOut - more resources
Full Text Sources
Molecular Biology Databases

