. 2024 Nov 21;17(1):343.
doi: 10.1186/s13104-024-06980-9.

Investigation the role of SIRT3, SIRT7, NFATC1, and PDL-1 genes in androgenetic alopecia

Affiliations

Investigation the role of SIRT3, SIRT7, NFATC1, and PDL-1 genes in androgenetic alopecia

Hadis Abbasian et al. BMC Res Notes. .

Abstract

Background: Androgenetic alopecia (AGA) stands as the most prevalent form of hair loss, affecting the hair follicles (HFs). Aging emerges as a prominent contributor in this condition. In this study, our aim is to elucidate the expression patterns of candidate genes-SIRT3, SIRT7, NFATC1, and PDL-1-known to exhibit differential expression levels during HF aging, and to underscore the role of aging in AGA.

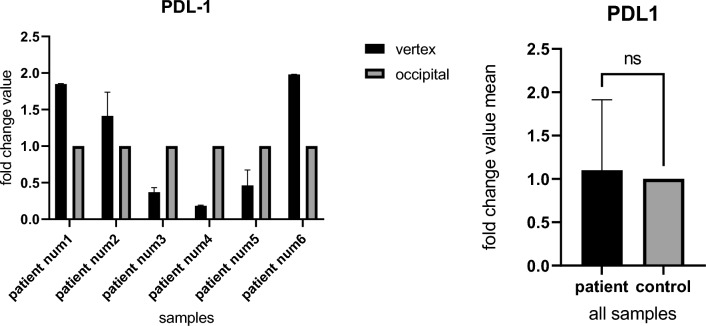
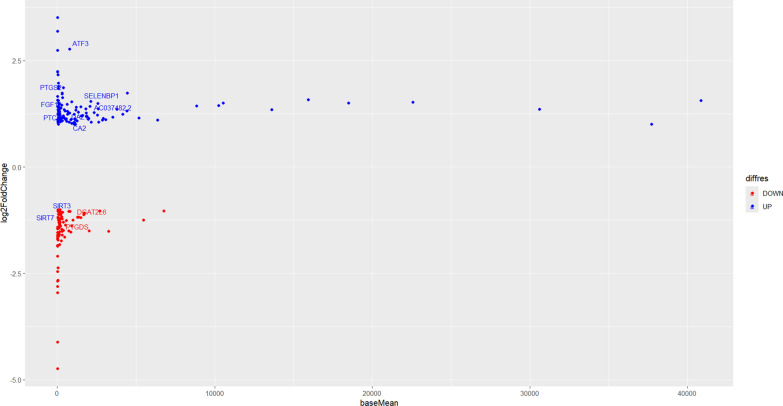
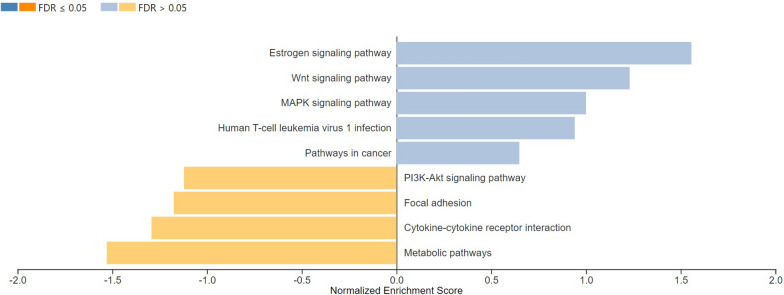
Material and methods: Mesenchymal stem cells (MSCs) were isolated from the vertex and occipital regions of six men affected by AGA. The aim was to assess the expression levels of SIRT3, SIRT7, NFATC1, and PDL-1 genes. RNA extraction was performed followed by cDNA synthesis, and gene expression levels were quantified using real-time PCR. To validate the experimental findings, two different RNA-seq datasets relevant to the study were analyzed using R software.

Results: In the present study, experimental tests revealed that the expression levels of SIRT3 and SIRT7, known to decrease during HF aging, were diminished in AGA-affected samples as well. Conversely, the mean value of NFATC1 and PDL-1 expression level, which are known to increase during HF aging, were found to be elevated in AGA-affected samples. Moreover, bioinformatic analyses provide additional support for the role of SIRT3, SIRT7 and NFATC1in AGA pathogenesis.

Conclusion: While SIRT3 and SIRT7 may play critical roles in AGA development, further research is needed to elucidate the significance of NFATC1 and PDL-1 in this context and to explore their potential as therapeutic targets for AGA treatment.

Keywords: NFATC1; PDL1; SIRT3; SIRT7; Androgenetic alopecia.


Conflict of interest statement

Declarations. Ethical approval and consent to participate: This research was approved by the Ethics Committee of Tarbiat Modares University (IR.MODARES.REC.1402.244), Tehran, Iran. All the participants have accepted and signed the informed consent during the standard genetic counselling sessions. Written informed consent was obtained from the patients for publication of this study. A copy of the written consent is available for review by the Editor of this journal. Consent for publication: All authors reviewed the results and approved the final version of the manuscript. Competing interests: The authors declare no competing interests.

Figures

Fig. 1
Fig. 1
cDNA bands on agarose gel electrophoresis. Each gene has a length between 100 to 200 bp
Fig. 2
Fig. 2
A, B Different gene expression between control (occipital part) and AGA (vertex part) samples in each patient. In each graph, the horizontal axis represents the patient samples, while the vertical axis illustrates the fold change value. All AGA samples have lower expression (A). The average fold change ratio of SIRT3 gene expression between the control and AGA-affected groups was statistically analyzed using a paired t-test (p < 0.05). The difference in gene expression was found to be statistically significant, with a p-value of 0.0431 (B)
Fig. 3
Fig. 3
A, B Different gene expression between control (occipital part) and AGA (vertex part) samples in each patient. In each graph, the horizontal axis represents the patient samples, while the vertical axis illustrates the fold change value. All AGA samples have lower expression (A). The average fold change ratio of SIRT7 gene expression between the control and AGA-affected groups was statistically analyzed using a paired t-test (p < 0.05). The difference in gene expression was found to be statistically significant, with a p-value of 0.0301 (B)
Fig. 4
Fig. 4
A, B Different gene expression between control (occipital part) and AGA (vertex part) samples in each patient. In each graph, the horizontal axis represents the patient samples, while the vertical axis illustrates the fold change value (A). The average fold change ratio of NFATC1 gene expression between the control and AGA-affected groups was statistically analyzed using a paired t-test (p < 0.05). The difference in gene expression was found to be statistically non-significant (B)
Fig. 5
Fig. 5
A, B Different gene expression between control (occipital part) and AGA (vertex part) samples in each patient. In each graph, the horizontal axis represents the patient samples, while the vertical axis illustrates the fold change value. Results vary (A). The average fold change ratio of PDL-1 gene expression between the control and AGA-affected groups was statistically analyzed using a paired t-test (p < 0.05). The difference in gene expression was found to be statistically non-significant (B)
Fig. 6
Fig. 6
Heatmap across all the samples using the top 50 most DE genes between the control and AGA patient groups, based on (GSE212301) dataset. rows represent genes, while columns represent samples. Fifty differential genes, identified based on DESeq2 normalized gene expression with the lowest padj < 0.05, were included in the analysis. genes with similar expression patterns are clustered together, with up-regulated genes depicted in red and down-regulated genes in blue
Fig. 7
Fig. 7
MA plot from differential expression between control vs AGA patient groups, based on (GSE212301) dataset. plot represents individual genes as dots, with the x-axis denoting the average expression over all samples and the y-axis representing the log2 fold change between the normal and patient groups (padj < 0.05). Genes exhibiting greater expression in AGA-affected samples are depicted in blue, whereas those with lower expression in AGA-affected samples are represented in red
Fig. 8
Fig. 8
MA plot from differential expression between control vs AGA patient groups, based on (GSE101451) dataset. plot represents individual genes as dots, with the x-axis denoting the average expression over all samples and the y-axis representing the log2 fold change between the normal and patient groups (padj < 0.05). Genes exhibiting greater expression in AGA-affected samples are depicted in blue, whereas those with lower expression in AGA-affected samples are represented in red
Fig. 9
Fig. 9
Volcano plot of the differentially expressed genes between control and AGA patient groups. Red vertical lines highlight log fold changes of -1 and 1, while red horizontal lines represent a Padj of 0.05, based on (GSE212301) dataset. In this plot, blue dots represent genes that are upregulated in expression (Padj < 0.05, log2 FC > 1) between control and Androgenetic Alopecia (AGA) patient groups, while red dots represent genes that are downregulated in expression (Padj < 0.05, log2 FC < − 1) between these groups
Fig. 10
Fig. 10
Gene Ontology analysis of biological process,cellular component, and molecular function for the genes which have the most significant Pvalues, based on the first RNA-seq (GSE212301) dataset
Fig. 11
Fig. 11
Kyoto Encyclopedia of genes and genomes (KEGG) pathway enrichment for up- and down-regulated genes between control and AGA patient groups. Up-regulated groups are shown in blue, while the down-regulated groups are shown in orange, based on the first RNA-seq (GSE212301) dataset

References

    1. Heilmann S, Brockschmidt FF, Hillmer AM, Hanneken S, Eigelshoven S, Ludwig KU, et al. Evidence for a polygenic contribution to androgenetic alopecia. Br J Dermatol. 2013;169(4):927–30. - PubMed
    1. Ellis JA, Sinclair R, Harrap SB. Androgenetic alopecia: pathogenesis and potential for therapy. Expert Rev Mol Med. 2002;4(22):1–11. - PubMed
    1. Hamilton JB. Patterned loss of hair in man: types and incidence. Ann N Y Acad Sci. 1951;53(3):708–28. 10.1111/j.1749-6632.1951.tb31971.x. - PubMed
    1. Sinclair R. Male pattern androgenetic alopecia. BMJ. 1998;317(7162):865–9. - PMC - PubMed
    1. Kidangazhiathmana A, Santhosh P. Pathogenesis of androgenetic alopecia. Clin Dermatol Rev. 2022;6(2):69–74.

LinkOut - more resources