[Preprint]. 2025 Jul 7:2024.11.08.620918.
doi: 10.1101/2024.11.08.620918.

Paired and solitary ionocytes in the zebrafish olfactory epithelium

Affiliations

Paired and solitary ionocytes in the zebrafish olfactory epithelium

Julia Peloggia et al. bioRxiv. .

Abstract

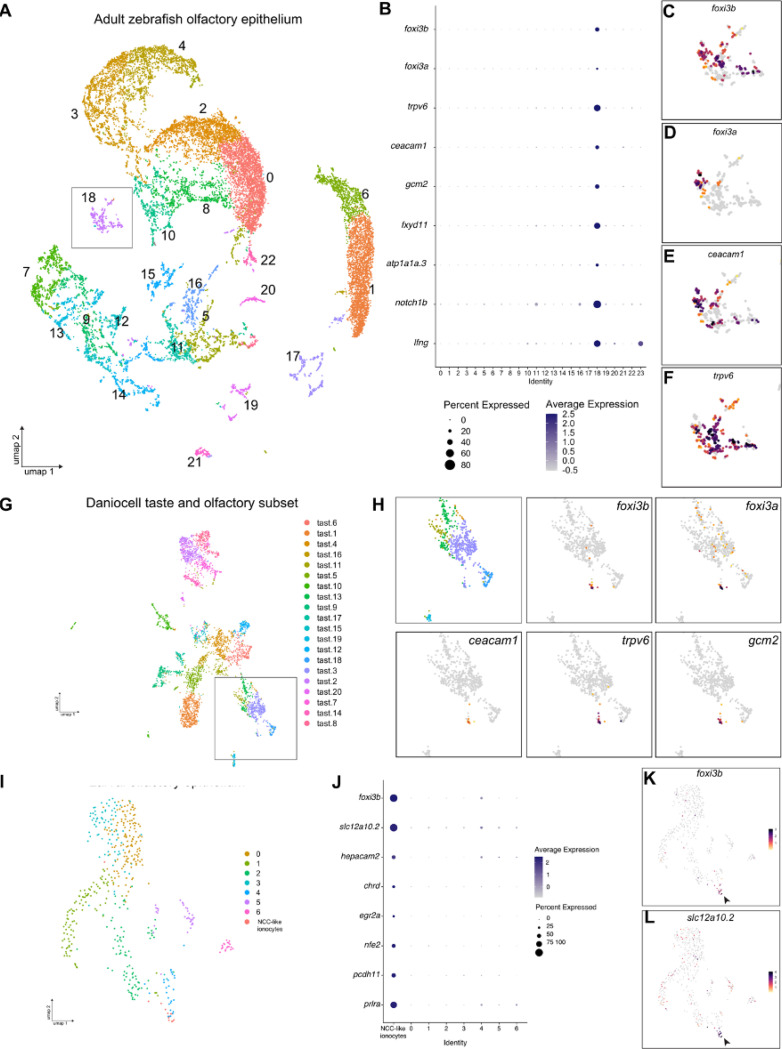
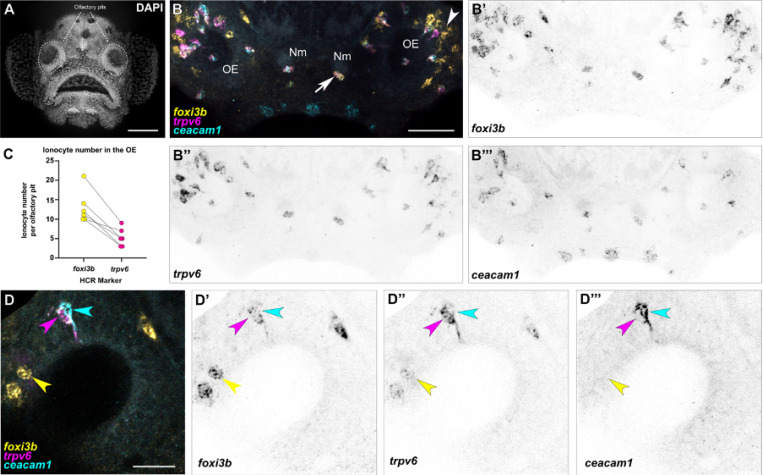
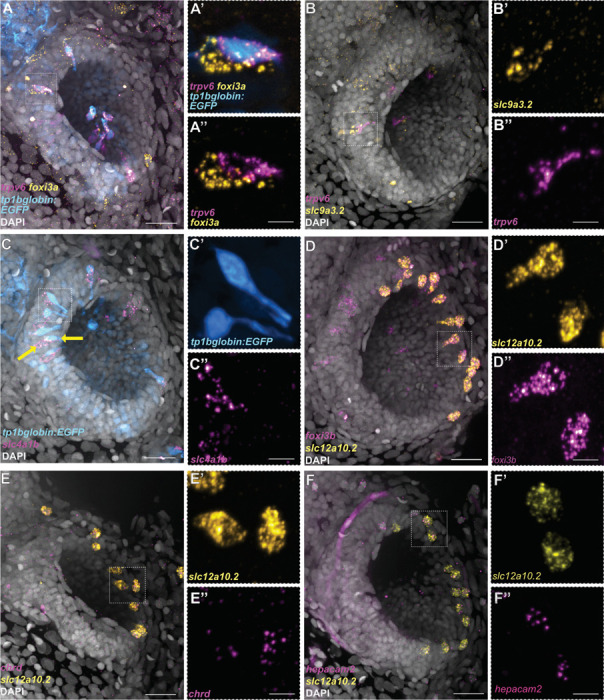
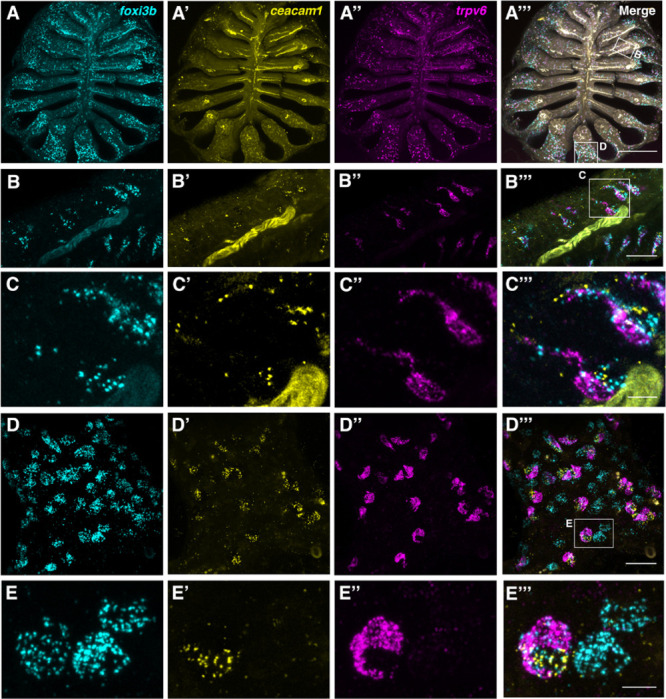
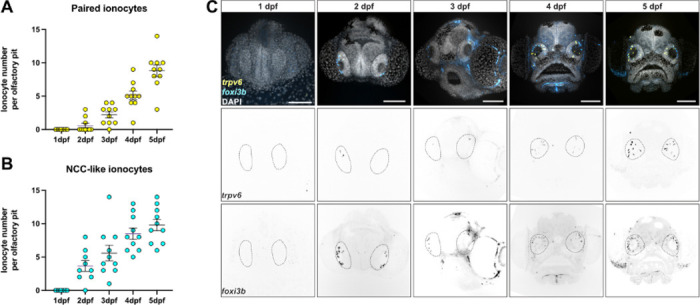
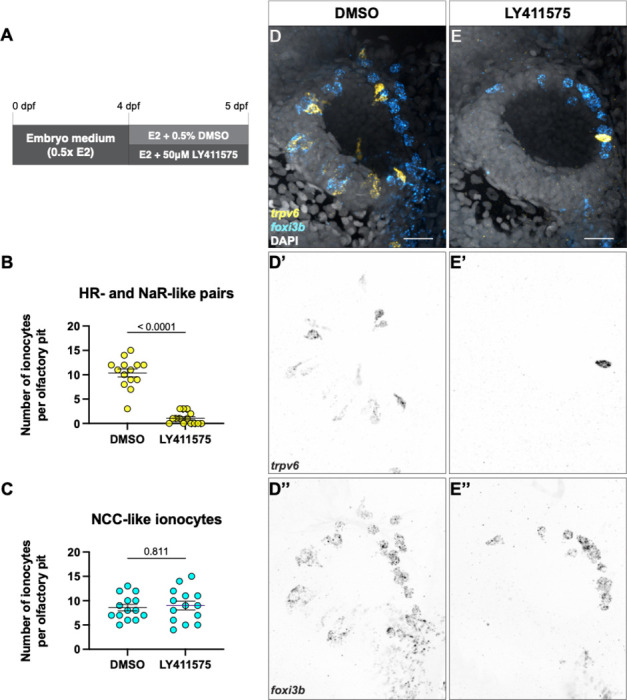
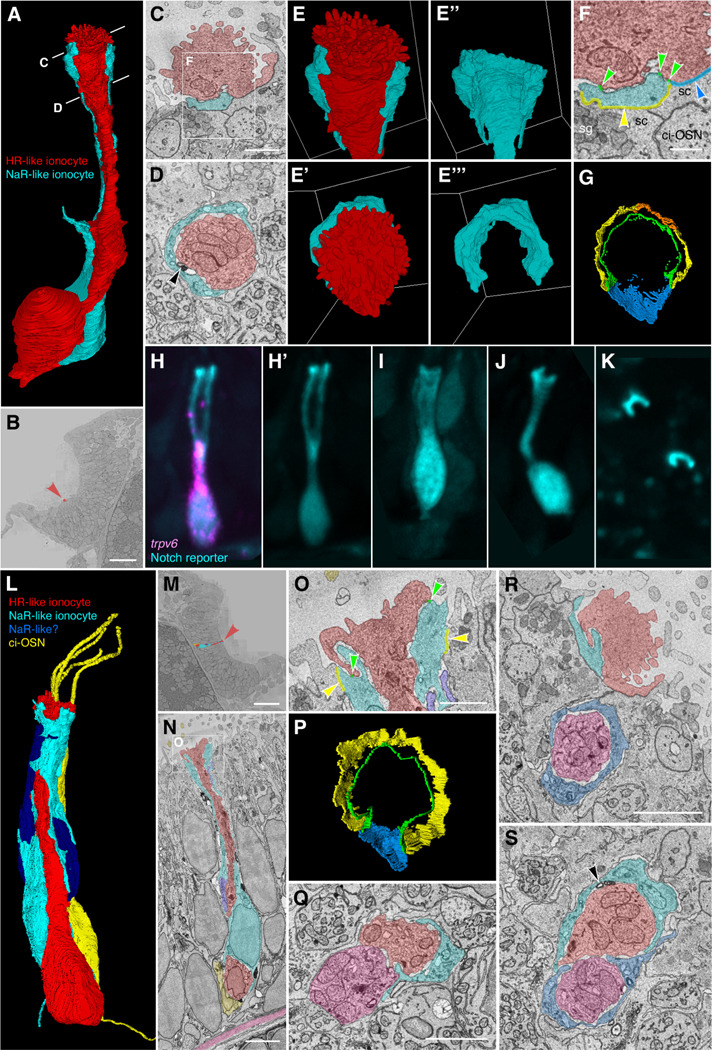
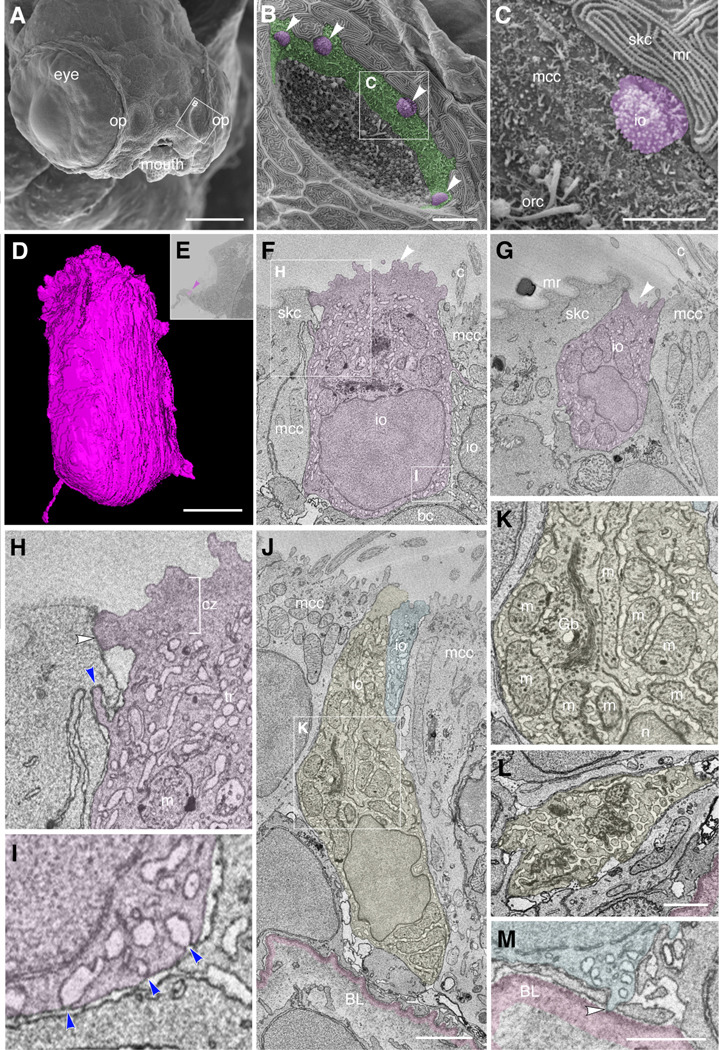
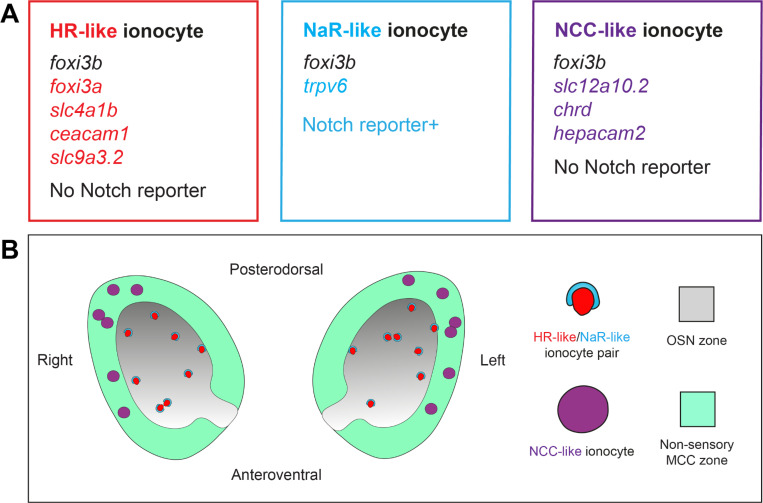
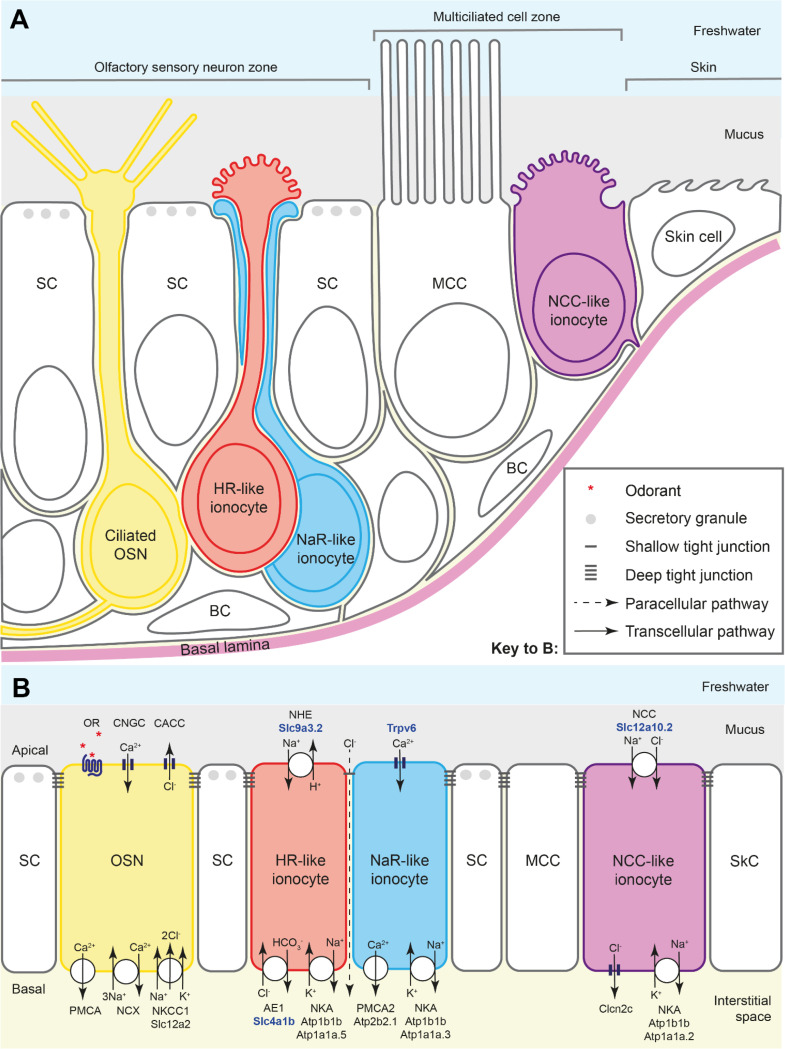
The sense of smell is generated by electrical currents that are influenced by the concentration of ions in olfactory sensory neurons and mucus. In contrast to the extensive morphological and molecular characterization of sensory neurons, there has been little description of the cells that control ion concentrations in the zebrafish olfactory system. Here, we report the molecular and ultrastructural characterization of zebrafish olfactory ionocytes. Transcriptome analysis suggests that the zebrafish olfactory epithelium contains at least three different ionocyte types, which resemble Na+/K+-ATPase-rich (NaR), H+-ATPase-rich (HR), and Na+/Cl- cotransporter (NCC) cells, responsible for calcium, pH, and chloride regulation, respectively, in the zebrafish skin. In the olfactory epithelium, NaR-like and HR-like ionocytes are usually adjacent to one another, whereas NCC-like cells are usually solitary. The distinct subtypes are differentially distributed: NaR-like/HR-like cell pairs are found broadly within the olfactory epithelium, whereas NCC-like cells reside within the peripheral non-sensory multiciliated cell zone. Comparison of gene expression and serial-section electron microscopy analysis indicates that the NaR-like cells wrap around the HR-like cells and are connected to them by shallow tight junctions. The development of olfactory ionocyte subtypes is also differentially regulated, as pharmacological Notch inhibition leads to a loss of NaR-like and HR-like cells, but does not affect NCC-like ionocyte number. These results provide a molecular and anatomical characterization of olfactory ionocytes in a stenohaline freshwater teleost. The paired ionocytes suggest that both transcellular and paracellular transport regulate ion concentrations in the olfactory epithelium, while the solitary ionocytes may enable independent regulation of ciliary beating.


Conflict of interest statement

Competing Interests The authors declare no competing interests.

Figures

Figure 1.
Figure 1.. Single-cell RNA sequencing data analysis reveals expression of classical ionocyte-marker genes in the zebrafish olfactory organ
(A) UMAP plot showing 24 unannotated cell clusters (Identity) in the scRNA-seq dataset generated from dissected adult zebrafish olfactory organs. (B) Dot plot of data from A depicting several known ionocyte markers expressed in cluster 18. (C) Feature plots for foxi3b, (D) foxi3a, (E) ceacam1, and (F) trpv6. (G) UMAP plot of taste/olfactory subset from Daniocell, a scRNA-seq dataset generated from whole embryos and larvae (Sur et al., 2023). (H) Zoomed in feature plots for the ionocyte markers foxi3b, foxi3a, ceacam1, trpv6, and gcm2. (I) UMAP plot of olfactory subset from (Peloggia et al., 2021). (J) Dot plot of data from J showing several NCC ionocyte markers in foxi3b+ cells in the olfactory epithelium. (K) Feature plots for foxi3b and (L) slc12a10.2.
Figure 2.
Figure 2.. The larval zebrafish olfactory epithelium contains three distinct subtypes of ionocytes
(A) Maximum intensity projection of a 4 dpf larva stained with DAPI showing the two olfactory pits; frontal view. Scale bar: 50 μm. (B–B’’’) Maximum intensity projection of a confocal image of HCR RNA-FISH for foxi3b (B’), trpv6 (B’’), ceacam1 (B’’’), and merged signals (B) in the head of a 5 dpf wild-type larva; dorsal view, anterior to the bottom. White arrowhead marks an example of an olfactory ionocyte in the posterolateral region of the olfactory pit with expression of foxi3b. White arrow marks an example neuromast ionocyte with expression of all three selected genes. Scale bar: 50 μm. Abbreviations: OE; olfactory epithelium, Nm; neuromast. (C) Numbers of foxi3b+ ionocytes per olfactory pit in 5 dpf larvae raised in 0.5× E2 medium, of which also express trpv6. Connecting lines indicate the same olfactory pit. (D–D’’’) Confocal image of HCR RNA-FISH signals for foxi3b (D’), trpv6 (D’’), ceacam1 (D’’’), and merged signals (D) in the olfactory epithelium of a 5 dpf wild-type larva; dorsal view, anterior to the bottom, lateral to the left. Magenta and cyan arrowheads mark an example pair of ionocytes, with the magenta arrowhead marking a strong trpv6-expressing cell, and the cyan arrowhead marking a ceacam1+ cell with weak foxi3b expression. Yellow arrowhead marks an example solitary ionocyte, which has strong expression of foxi3b and weak expression of trpv6. Scale bar: 20 μm.
Figure 3.
Figure 3.. Differential expression of Notch reporter and ion channel genes in the three distinct subtypes of olfactory ionocytes
(A–A’’) HCR RNA-FISH for foxi3a (yellow) and trpv6 (magenta), combined with the Notch reporter tp1bglobin:EGFP (cyan) and DAPI stain (grey). (B–B’’) HCR RNA-FISH for slc9a3.2 (yellow) and trpv6 (magenta) with DAPI stain (grey). (C–C’’) HCR RNA-FISH for slc4a1b (magenta) combined with the Notch reporter tp1bglobin:EGFP (cyan) and DAPI stain (grey). The arrows indicate adjacent cells with EGFP and slc4a1b expression. (D–D’’) Maximum intensity projection of a HCR RNA-FISH for slc12a10.2 (yellow) and foxi3b (magenta) with DAPI stain (grey) shows solitary, NCC-like ionocytes in the olfactory epithelium. (E–E’’) HCR RNA-FISH for slc12a10.2 (yellow) and chrd (magenta) with DAPI stain (grey). (F–F’’) HCR RNA-FISH for slc12a10.2 (yellow) and hepacam2 (magenta) with DAPI stain (grey). Scale bars: A, B, C, D, E, F, 20 μm; A’’, B’’, C’’, D’’, E’’, F’’, 5 μm.
Figure 4.
Figure 4.. The adult zebrafish olfactory epithelium contains three distinct subtypes of ionocytes
(A–A’’’) Overview of a dissected adult olfactory rosette. Maximum intensity projections of an Airyscan2 confocal image of HCR RNA-FISH for foxi3b (A), ceacam1 (A’), trpv6 (A’’), and merged signals (A’’’). Scale bar: 200 μm. (B–B’’’) Enlargement of the boxed region ‘B’ in A’’’, within the central (sensory) zone of the olfactory rosette. Maximum intensity projections of a subset of optical sections; HCR RNA-FISH for foxi3b (B), ceacam1 (B’), trpv6 (B’’), and merged signals (B’’’). Pairs of elongated ionocytes with cell bodies located deep in the epithelium are visible. (The yellow stripe running through the image is autofluorescence from a blood vessel.) Scale bar: 20 μm. (C–C’’’) Enlargement (maximum intensity projection of a subset of z-slices used in B) of boxed region in B’’’, featuring two ionocyte pairs: HR-like ionocytes expressing ceacam1 (yellow) and foxi3b (cyan), adjacent to NaR-like ionocytes expressing trpv6 (magenta) and a low level of ceacam1. HCR RNA-FISH for foxi3b (C), ceacam1 (C’), trpv6 (C’’), and merged signals (C’’’). Scale bar: 5 μm. (D–D’’’) Enlargement of boxed region ‘D’ in A’’’, within the peripheral (non-sensory, multiciliated) zone of the olfactory rosette. Maximum intensity projections of a subset of z-slices used in A; HCR RNA-FISH for foxi3b (D), ceacam1 (D’), trpv6 (D’’), and merged signals (D’’’). Both paired and solitary ionocytes are present. Scale bar: 20 μm. (E–E’’’). Enlargement (maximum intensity projection of a subset of z-slices) of the boxed region in D’’’, featuring one HR-like/NaR-like ionocyte pair, and two NCC-like ionocytes. An HR-like ionocyte, expressing ceacam1 (yellow) and foxi3b (cyan), sits adjacent to an NaR-like ionocyte expressing trpv6 (magenta) and a lower level of ceacam1. The NCC-like ionocytes express foxi3b (cyan) but not ceacam1 or trpv6. Ionocytes near the periphery of the rosette were rounded in shape. Scale bar: 5 μm.
Figure 5.
Figure 5.. The subtypes of olfactory ionocytes develop at different times
(A) Developmental time course of NaR-/HR-like ionocyte pairs and (B) Number of NCC-like ionocytes from 1 to 5 dpf observed by confocal images of HCR RNA-FISH. (C) Representative maximum intensity projection confocal images of HCR RNA-FISH for trpv6 (yellow) and foxi3b (cyan) with DAPI stain (grey) from A and B. Scale bar: 20 μm
Figure 6.
Figure 6.. Notch signalling is required for paired ionocyte survival, but does not affect NCC-like ionocyte number
(A) Schematic of experimental design. (B) Number of NaR- and HR-like ionocyte pairs in DMSO controls and treated with the Notch inhibitor LY411575. Mann Whitney test (P < 0.0001). (C) Number of NCC-like ionocytes in DMSO controls and treated with the Notch inhibitor LY411575. Mann-Whitney test (P = 0.7811). (D–E’’) Representative maximum intensity projection confocal images of HCR RNA-FISH for trpv6 (yellow) and foxi3b (cyan) with DAPI stain (grey) in DMSO-treated (D–D’’) and LY411575-treated (E–E’’) olfactory pits. N = 14 olfactory pits per condition. Scale bars: 20 μm.
Figure 7.
Figure 7.. Ultrastructure and 3D reconstruction of olfactory HR-like/NaR-like ionocyte cell pairs and multicellular complexes in the wild-type zebrafish larva
(A–G) Representative example of an ionocyte cell pair in the 7 dpf zebrafish larval olfactory pit. The HR-like ionocyte is shown in red, with the NaR-like ionocyte in cyan. (A) Volume-EM 3D reconstruction of the cell pair; see also Supplementary Movie 6. (B) Location of the cell pair (red arrowhead) in the left olfactory pit (just within the OSN zone). Coronal section; anterior to the top. (C,D) Sections at the approximate levels shown in A. Black arrowhead in D marks an electron-dense structure in the extracellular space between the cell pair (see also S). (E–E’’’) 3D reconstructions of the apical part of the cell pair, showing the microvillous apical knob of the HR-like ionocyte (red), which projects above the surrounding olfactory supporting cells. Side views (top panels) and top-down views (lower panels). The neck of the HR-like ionocyte is wrapped by a thin layer of cytoplasm of the NaR-like cell (cyan). (F,G) Tight junctions (zonulae occludentes) of the ionocyte pair. (F) Enlargement of the box in C, showing color-coded labelling of the junctions. Green, shallow tight junction between the two ionocytes; yellow, deep tight junction between NaR-like ionocyte and olfactory supporting cell; orange, deep tight junction between NaR-like ionocyte and multiciliated cell; blue, deep tight junction between HR-like ionocyte and olfactory supporting cell. Abbreviations: ci-OSN, ciliated olfactory sensory neuron; sc, olfactory supporting cell; sg, secretory granule. (G) 3D reconstruction of the tight junctions (top-down view); see also Supplementary Movie 7. (H–K) Examples of NaR-like olfactory ionocytes in a live 5 dpf embryo, labelled by EGFP (cyan) in the Notch reporter line Tg(tp1bglob:EGFP). (H) Co-expression of EGFP (Notch reporter; cyan) with HCR RNA-FISH for trpv6 (magenta), confirming the cell as an NaR-like ionocyte (see also Fig. 3B–B’’). (H’,I–K) EGFP (cyan) channel only. (I,J) Additional examples in longitudinal view. (K) The apices of EGFP+ cells (NaR-like ionocytes) appear as crescents in a top-down view. (L–S) Examples of three- and four-cell ionocyte complexes in the wild-type zebrafish olfactory epithelium at 7 dpf. (L–P) Example of a 3-cell complex, consisting of an HR-like ionocyte (red), NaR-like ionocyte (cyan), and possible second NaR-like ionocyte (dark blue). A nearby ciliated OSN (yellow) is included for context. (L) 3D reconstruction of the ionocyte complex and ciliated OSN; see also Supplementary Movie 8. (M) Location of the cells in the OSN zone of the right-hand olfactory pit (red arrowhead). Coronal section; anterior to the top. (N) Longitudinal section through the complex, showing close association between the HR-like ionocyte (red) and the ciliated OSN (yellow) at the base, and location relative to the basal lamina (pink). (O) Enlargement of the box in N, showing color-coded labelling of the tight junctions of the HR-like (red) and NaR-like (cyan) cells (color code as in F). (P) 3D reconstruction of the tight junctions of the HR-like (red) and NaR-like (cyan) cells (top-down view; compare to G; see also Supplementary Movie 9). (Q) Example section through a three-cell complex consisting of an HR-like cell (red), an NaR-like cell (cyan), and possible second HR-like cell (pink). (R,S) Example sections through a four-cell complex consisting of two HR-like/NaR-like pairs. The cell pairs are separate at their apices (R), but are closely associated beneath the epithelial surface (S). Black arrowhead in S marks electron-dense structures between the ionocytes. Scale bars: B, 20 μm; C; 1 μm (applies to D–E’’’, G); F, 0.5 μm; M, 20 μm; N, 3 μm; O, 1 μm (applies to P); Q, 2 μm; R, 2 μm (applies to S).
Figure 8.
Figure 8.. Ultrastructure and 3D reconstruction of NCC-like olfactory ionocytes in the non-sensory multiciliated cell zone of the zebrafish olfactory pit
(A–C) Scanning electron micrographs of an ift88−/− zebrafish mutant embryo at 4 dpf. (A) Whole head showing location of the two olfactory pits (op). (B) Enlargement of the left-hand olfactory pit, boxed in A. The rounded apical surfaces of four ionocytes (presumed NCC-like) are highlighted in magenta (arrowheads). The peripheral zone of non-sensory multiciliated cells (mcc) is highlighted in green. (All olfactory cilia are missing in the ift88−/− mutant, allowing visualization of the apical surface of cells in the pit.) (C) Enlargement of the boxed region in B. An ionocyte (magenta) sits in the MCC zone, in contact with a skin cell with microridges (mr, top right). The rods of two or three olfactory rod cells are also visible (orc, bottom left; see also Fig. 3I in (Cheung et al., 2021)). (D–M) Ultrastructure and 3D reconstruction of ionocytes in the non-sensory multiciliated zone of the olfactory pit in a wild-type zebrafish larva at 7 dpf. (D) 3D reconstruction of a presumed NCC-like ionocyte, showing the microvillous apical surface. (E) Location of the ionocyte in D (magenta; arrowhead) at the lateral edge of the left olfactory pit. Coronal section; anterior to the top. (F,G) Selected sections through the ionocyte shown in D, highlighted in magenta. The ionocyte makes contact with at least four other cell types: apically, with a skin cell on one side and a multiciliated cell on the other; basolaterally, with multiciliated cells, a basal cell, and another ionocyte. The microvillous apical surface is rounded in one area (F, arrowhead) but also forms a pit-like structure (G, arrowhead) in the same cell. (H) Enlargement of the boxed region in F (top left), highlighting tight junctional contact (white arrowhead) and interdigitation (blue arrowhead) between the ionocyte and a neighbouring skin cell. (I) Enlargement of the boxed region in F (bottom right), showing that pores where the tubular reticulum meets the plasma membrane are covered by a thin electron-dense structure (blue arrowheads). (J) Two examples of more elongated ionocytes highlighted in yellow and blue, with their apices sitting between multiciliated cells. (K) Enlargement of the boxed region in J, showing the mitochondria-rich cytoplasm, Golgi apparatus and extensive tubular reticulum. (L) Section through the base of the yellow cell in J, showing the tubular reticulum. (M) An end-foot (arrowhead) of the blue ionocyte in J makes direct contact with the basal lamina (pink). Abbreviations: bc, basal cell; BL, basal lamina (pink); c, cilia of multiciliated cell; cz, cortical zone (free of mitochondria; bracketed in H); Gb, Golgi body; io, presumed NCC-like ionocyte; m, mitochondrion; mcc, multiciliated cell; mr, microridges on skin cell; n, cell nucleus; op, olfactory pit; orc, olfactory rod cell (apical rods visible); skc, skin cell; tr, tubular reticulum. Scale bars: A, 100 μm; B, 10 μm; C, 5 μm; D, 2 μm (applies to F, G); J; 2 μm; L, 1 μm; M, 1 μm.
Figure 9.
Figure 9.. Summary of findings.
(A) Gene expression in three different classes of olfactory ionocytes. (B) Schematic diagram showing the approximate number and distribution of ionocytes in the zebrafish larval olfactory pit (viewed from the front; not to scale).
Figure 10.
Figure 10.. Ionocyte types and their proposed function in the zebrafish larval olfactory epithelium
(A) Schematic diagram to show the arrangement of HR- and NaR-like ionocyte pairs and NCC-like ionocytes in the zebrafish larval olfactory epithelium. The NCC-like cells have variable morphologies, some with a rounded microvillous apical surface. The diagram illustrates approximate cell shapes (not to scale). (B) Model for the contribution of olfactory ionocytes to ionic homeostasis in the zebrafish olfactory epithelium. This is a tentative proposal, based on mRNA expression data (see Figs. 1–4 and Supplementary Tables) and comparison to ionocytes in other tissues (see text for citations). The number and subcellular location of the relevant proteins in olfactory ionocytes have not yet been validated. Protein names in bold blue text are based on validated mRNA expression patterns in this study. Color coding as in panel A. The dotted line indicates the proposed paracellular pathway, via a shallow tight junction, between the HR-like and NaR-like olfactory ionocyte pair. This provides a route for recycling chloride ions, generated by sensory transduction in OSNs, within the OSN zone. Abbreviations: AE1 (Slc4a1b), anion exchanger 1; BC, basal cell; CACC, calcium-activated chloride channel; Clcn2c, chloride channel 2c; CNGC, cyclic-nucleotide-gated calcium channel; MCC, multiciliated cell; NCC (Slc12a10.2), sodium-chloride symporter; NCX, sodium-calcium exchanger; NHE (Slc9a3.2), sodium-proton exchanger; NKA (Atp1b1b, with cell-type-specific expression of alpha subunits), sodium-potassium ATPase; NKCC1 (Slc12a2), sodium-potassium-chloride cotransporter 1; OR, odorant receptor (GPCR), with odorant ligand (red asterisks); OSN, olfactory sensory neuron; PMCA, plasma membrane calcium ATPase; PMCA2 (Atp2b2.1), plasma membrane calcium ATPase 2; SC, supporting cell; SkC, skin cell; Trpv6, transient receptor potential vanilloid 6 (epithelial calcium channel).

Similar articles

References

    1. Bautista J.L., Cramer N.T., Miller C.N., Chavez J., Berrios D.I., Byrnes L.E., Germino J., Ntranos V., Sneddon J.B., Burt T.D., et al. 2021. Single-cell transcriptional profiling of human thymic stroma uncovers novel cellular heterogeneity in the thymic medulla. Nat Commun. 12:1096. - PMC - PubMed
    1. Berger D.R., Seung H.S., and Lichtman J.W. 2018. VAST (Volume Annotation and Segmentation Tool): Efficient Manual and Semi-Automatic Labeling of Large 3D Image Stacks. Front Neural Circuits. 12:88. - PMC - PubMed
    1. Bertmar G. 1972. Labyrinth cells, a new cell type in vertebrate olfactory organs. Z Für Zellforsch Mikrosk Anat. 132:245–256. - PubMed
    1. Butler A., Hoffman P., Smibert P., Papalexi E., and Satija R. 2018. Integrating single-cell transcriptomic data across different conditions, technologies, and species. Nat Biotechnol. 36:411–420. - PMC - PubMed
    1. Casellas C.P., Pleguezuelos-Manzano C., Rookmaaker M.B., Verhaar M.C., and Clevers H. 2023. Transcriptomic profile comparison reveals conservation of ionocytes across multiple organs. Sci Rep. 13:3516. - PMC - PubMed

Publication types

LinkOut - more resources