[Preprint]. 2024 Nov 7:2024.11.07.622495.
doi: 10.1101/2024.11.07.622495.

Phenotypic plasticity in bacterial elongation among closely related species

Affiliations

Phenotypic plasticity in bacterial elongation among closely related species

Marie Delaby et al. bioRxiv. .

Update in

Abstract

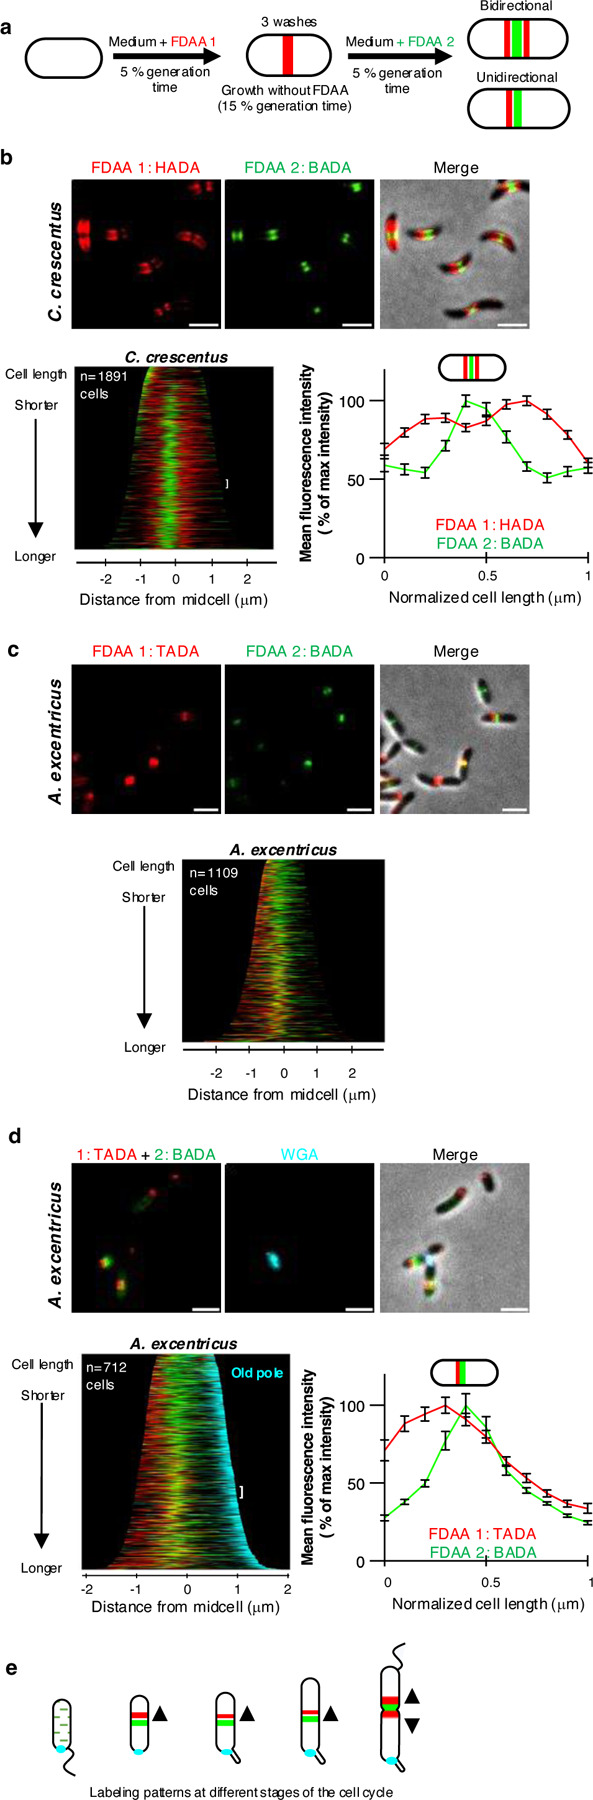
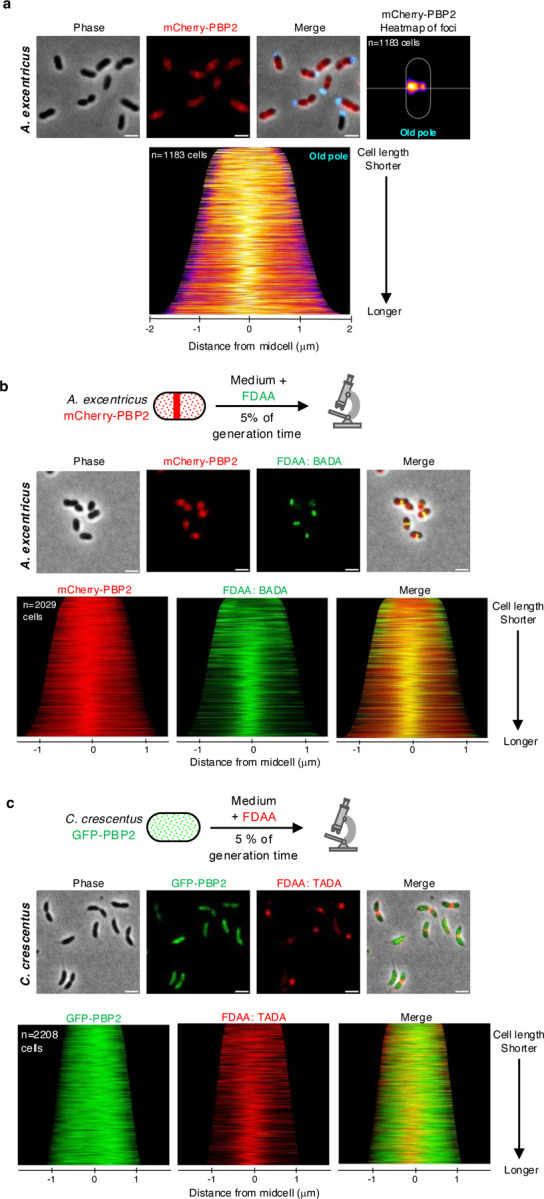
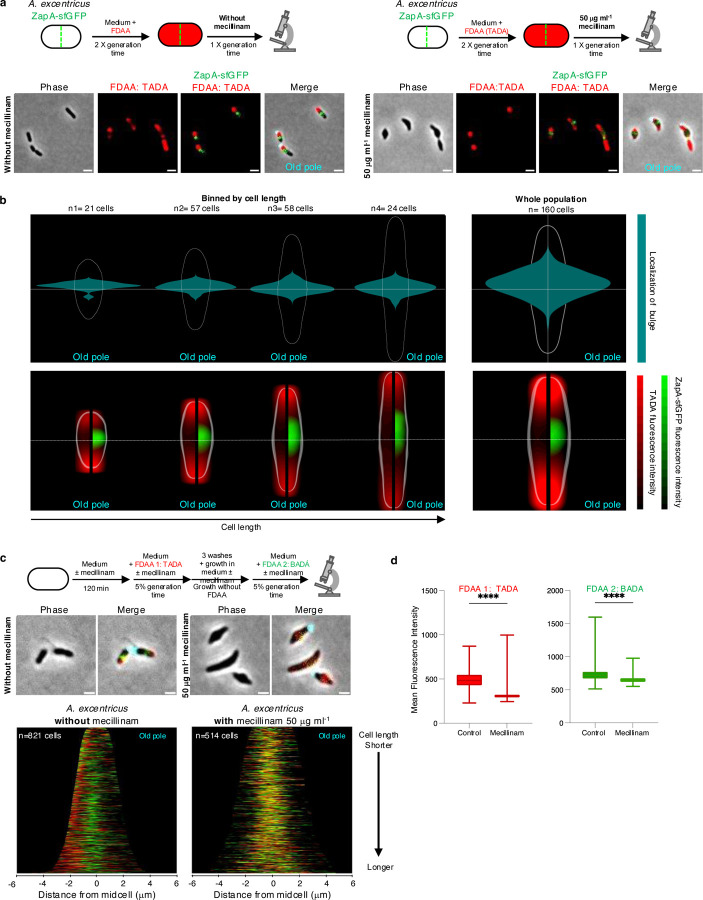
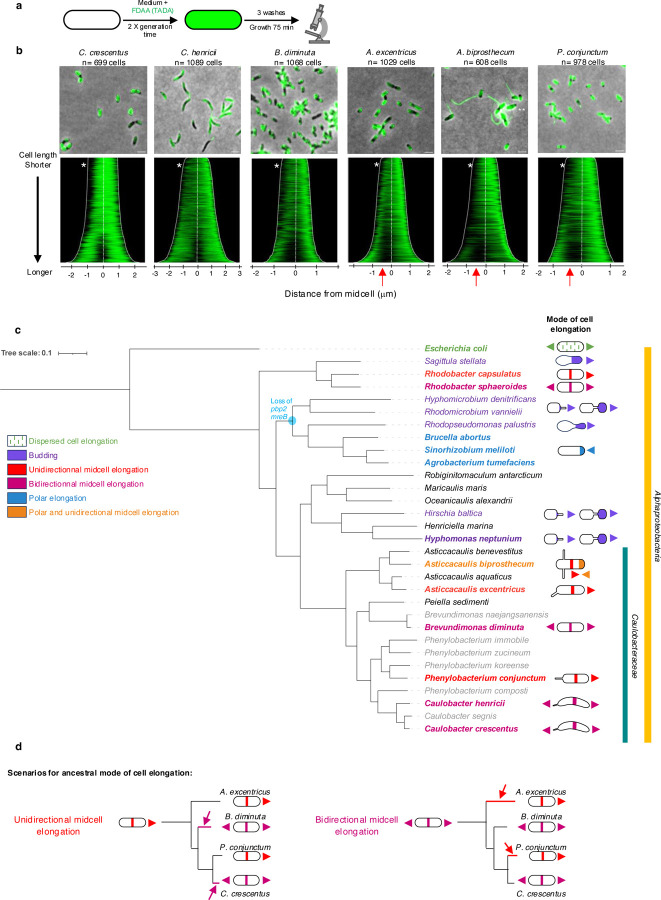
Cell elongation is a fundamental component of the bacterial cell cycle and has been studied over many decades, in part owing to its mechanisms being a target of numerous antibiotic classes. While several distinct modes of cell elongation have been described, these studies have largely relied on a handful of model bacterial species. Therefore, we have a limited view of the diversity of cell elongation approaches that are employed by bacteria, and how these vary in response to evolutionary and environmental influences. Here, by employing fluorescent D-amino acids (FDAAs) to track the spatiotemporal dynamics of elongation, we reveal previously unsuspected diversity of elongation modes among closely related species of the Caulobacteraceae, with species-specific combinations of dispersed, midcell and polar elongation that can be either unidirectional or bidirectional. Using genetic, cell biology, and phylogenetic approaches, we demonstrate that evolution of unidirectional-midcell elongation is accompanied by changes in the localization pattern of the peptidoglycan synthase PBP2 and infer that elongation complexes display a high degree of phenotypic plasticity, both among the Caulobacteraceae and more widely among the Alphaproteobacteria. Demonstration that even closely related bacterial species employ highly distinct mechanisms of cell elongation reshapes our understanding of the evolution and regulation of bacterial cell growth, with broad implications for bacterial morphology, adaptation, and antibiotic resistance.

Keywords: Caulobacter; Caulobacteraceae; Elongation modes; Peptidoglycan; midcell elongation.


Conflict of interest statement

Competing interests The authors declare no competing interests.

Figures

Fig. 1:
Fig. 1:. Diversity of growth modes in rod-shaped bacteria and members of the Caulobacteraceae family.
(a) Schematic illustrating different growth modes observed among rod-shaped bacteria. Green lines represent lateral or dispersed elongation, solid green denotes different modes of localized cell elongation, and solid blue marks cell division. (b) Dimorphic cell cycles and growth modes in C. crescentus, A. excentricus and A. biprosthecum. At the beginning of their cell cycle, C. crescentus swarmer cells elongate by dispersed insertion of new PG material (green lines) before bidirectional elongation near the midcell (green), followed by cell division (blue). In this study, we show that A. excentricus swarmer cells also undergo dispersed elongation (green lines) during the swarmer stage. However, this is followed by a novel, unidirectional-midcell elongation towards the new pole (green) prior to bidirectional cell division (blue). Finally, we identified that A. biprosthecum cells elongate through yet another novel mode of elongation – a combination of polar and unidirectional-midcell elongation. (c) Schematic depicting the pulse-chase experiment using FDAA. Whole-cell PG was labeled with 500 µm FDAA (the “pulse,” colored in green) over two generations, followed by washes with PYE to remove free FDAA from the medium. Subsequent growth in the absence of FDAA (the “chase”) was observed using time-lapse microscopy. During the chase period, the loss of FDAA signal corresponds to new PG synthesis/turnover. The red dashed line indicates the position of the ZapA fluorescent protein fusion, as a marker of the future division site. (d) Pulse-chase experiments using FDAAs in C. crescentus and A. excentricus cells carrying fluorescent fusions of the cell division protein ZapA. Images were taken every 5 minutes during the chase period. Kymographs show the loss of FDAA fluorescence as the cells grow. In C. crescentus (left), the FDAA BADA was used in combination with ZapA-mCherry. In A. excentricus (right), the FDAA TADA was used in combination with ZapA-sfGFP. Kymographs from both these species present the FDAA signal in green and the ZapA fluorescent fusion signal in red. White stars indicate cells starting division. See Extended Data Fig.1 for additional kymographs from each species. (e) Schematic of FDAA signal loss in C. crescentus and A. excentricus cells. The red dashed line indicates the position of ZapA as a marker of the future division site. Green shading represents the old PG labeled with FDAA.
Fig. 2.
Fig. 2.. Sequential FDAA labeling reveals that C. crescentus grows bidirectionally from the midcell, while A. excentricus grows unidirectionally from the midcell towards the new pole.
(a) Schematic depicting the dual short-pulse experiment: sequential, dual short FDAA pulses show sites of active PG synthesis. Cells were first labeled with one FDAA (HADA in C. crescentus or TADA in A. excentricus, red) for 5% of their generation time, washed with PYE to remove the free FDAA, allowed to grow for 15 % of their generation time and then labeled with a second FDAA (green) for 5% of their generation time, washed again, and imaged with phase and fluorescence microscopy. (b-d) Sequential FDAA labeling in C. crescentus (b) and A. excentricus (c-d). Top: Representative images are shown. Left to right: FDAA 1, FDAA 2 and merge images. Scale bars: 2 µm. Middle: population-level demographs showing the localization of the fluorescence intensities of FDAA 1 and FDAA 2. Bottom: fluorescence intensity plots showing the fluorescence signals from both FDAAs. In Panel d, the old pole in A. excentricus cells is additionally labeled with fluorescent WGA (cyan). In all demographs, cells are arranged by length, with 50% of maximum fluorescence intensities shown. Demographs in Panels b-c are oriented with the maximum fluorescence intensity of the second FDAA to the left, and in Panel d with the WGA-labeled old pole (cyan) to the right. In Panels b and d, the white brackets show the 50 cells selected to plot the fluorescence intensities of the two FDAAs along the cell length, shown in the graphs adjacent to the demographs. To generate these graphs, points were selected along the medial axis of each cell, and the normalized signals of FDAA 1 (red) and FDAA 2 (green) were plotted relative to their normalized position along the cell length. The lines represent the mean values, with error bars showing the standard error of the mean (SEM). See Extended Data Fig. 2 for additional demographs showing each FDAA individually, and at 50% and 100% fluorescence intensities. (e) Schematic illustrating PG synthesis at different stages of the A. excentricus cell cycle. Smaller swarmer cells undergo dispersed cell elongation (green dots). As they differentiate into stalked cells, they elongate unidirectionally from the midcell towards the new cell pole, with the first FDAA signal (red) located on the new pole side of the second FDAA signal (green). Predivisional cells or cells undergoing septation exhibit bidirectional growth at the midcell, with red signals on both sides of the second FDAA signal (green). The old pole is indicated by the holdfast (cyan).
Fig 3.
Fig 3.. Distinct PBP2 localization in A. excentricus and C. crescentus and its correlation with active PG synthesis.
(a) Subcellular localization of mCherry-PBP2 in A. excentricus. Top: Representative images are shown. Left to right: Phase, mCherry-PBP2 fluorescence and merged images. Scale bar: 2 µm. A heatmap of mCherry-PBP2 foci at the population level is displayed. In the heatmap, cells were oriented using the old pole labeled with WGA (cyan), with the white line indicating the midcell. Bottom: A demograph showing the localization of mCherry-PBP2 fluorescence at the population level, with cells arranged by length and oriented with the old pole towards the right. (b) Short-pulse FDAA (BADA) labeling of the A. excentricus mCherry-PBP2 strain. Top: A schematic depicting the experiment. Cells were labeled with 250 µM BADA for 5% of their generation time, fixed with 70% (v/v) ethanol and imaged. Middle: Representative phase, fluorescence (mCherry-PBP2 and BADA) and merged images are shown. Scale bar: 2 µm. Bottom: Population-level demographs showing the localization of the fluorescence intensities of mCherry-PBP2, BADA and their overlays. See Extended Data Fig. 4a for heatmaps and density maps of mCherry-PBP2 and BADA at the population level. (c)Short-pulse FDAA (TADA) labeling of the C. crescentus GFP-PBP2 strain. Top: A schematic depicting the experiment. Cells were labeled with 250 µM TADA for 5% of their generation time, fixed with 70% (v/v) ethanol and imaged. Middle: Representative phase, fluorescence (GFP-PBP2 and TADA) and merged images are shown. Scale bar: 2 µm. Bottom: Population-level demographs showing the localization of the fluorescence intensities of GFP-PBP2, TADA and their overlays. See Extended Data Fig. 4b–c for additional fluorescence images and population-level demographs showing the differences in localization of PBP2 in A. excentricus vs. C. crescentus.
Fig 4.
Fig 4.. PBP2 is responsible for unidirectional PG synthesis at the midcell in A. excentricus
(a) Top: Schematic depicting pulse-chase experiments in A. excentricus ZapA-sfGFP cells with (right) or without (left) mecillinam treatment. Whole-cell PG was labeled with TADA (red) over two generations, followed by washing and growth with or without mecillinam (50 µg ml−1) over one generation before imaging. Bottom: Representative phase, fluorescence and merged images from both conditions are shown. The fluorescence images show TADA individually as well as overlaid with ZapA-sfGFP. The merged image shows phase overlaid with TADA, ZapA-sfGFP and WGA fluorescence. Scale bar: 2 µm. (b) ShapePlots of A. excentricus cells after an FDAA pulse-chase experiment, with mecillinam treatment during the chase period. Top: Shape plots showing bulge localization. Bottom: ShapePlots show ZapA-sfGFP and FDAA signal loss following the chase period. Each ShapePlot is divided longitudinally (black line) to show the loss of FDAA signal exclusively on the left, and overlaid with ZapA-sfGFP on the right. ShapePlots are presented individually for four categories of cells binned by cell length (left) as well as for the entire population of 160 cells (right). All cells are oriented using WGA-labeling of the holdfast, positioning the old pole at the bottom. Horizontal white lines represent the midcell. (c) Top: Schematic of a dual short-pulse experiment with or without mecillinam (50 µg ml−1) to show active PG synthesis. A. excentricus cells were first allowed to grow over 120 min with or without mecillinam. Cells were then labeled with TADA (red) for 5% of their generation time, washed to remove excess FDAA, allowed to grow for 18 min, and then labeled with BADA (green) for 5% of their generation time, with or without mecillinam. They were then washed again and imaged with phase and fluorescence microscopy. Middle: Representative phase and merged images from both treatment conditions – with and without mecillinam. Merged images show phase contrast overlaid with fluorescence signals from the two FDAAs as well as WGA-labeled holdfast (cyan). Scale bar: 2 µm. Look up tables (LUTs) were adjusted for each condition to have a visible FDAA signal, and therefore were not identical. Bottom: Population-level demographs showing the fluorescence intensities of both FDAA signals, with and without mecillinam treatment. Cells were arranged by length, with the old pole to the right. 50% of the maximum fluorescence intensities are shown. (d) Box graphs showing quantification of fluorescence intensities for each FDAA pulse in the presence or absence of mecillinam (for the same cells quantified in the demographs in 4c). **** P<0.0001 (Welch One-Way ANOVA Test). Error bars show the standard error of the mean (SEM).
Fig. 5.
Fig. 5.. Diversity of cell elongation modes in members of the Caulobacteraceae family
(a) Schematic depicting the pulse-chase experiment using FDAAs. Whole-cell PG was labeled with TADA for two generations, washed to remove excess FDAA, followed by a chase period of 75 minutes before imaging. (b) Demograph analysis of pulse-chase experiments in WT cells of C. crescentus, C. henricii, P. conjunctum, B. diminuta, A. excentricus, and A. biprosthecum. Loss of FDAA labeling shows sites of PG synthesis/remodeling. Cells are arranged by length, with each cell oriented so that the pole with the maximum fluorescence intensity is to the right. White stars indicate signal loss at one pole. Red arrows highlight unidirectional midcell elongation in A. excentricus, A. biprosthecum, and P. conjunctum, as observed by greater FDAA signal loss towards the left of the demograph. (c) Phylogenetic tree of representative species from the Alphaproteobacteria, which includes the family Caulobacteraceae. Taxon label colors correspond to different modes of cell elongation: dispersed cell elongation (green), unidirectional midcell elongation (red), polar elongation (blue), budding (violet), polar and unidirectional midcell elongation (orange and red), bidirectional midcell elongation (magenta), binary fission (black), and unknown (grey). Species for which the cell elongation mode has been studied using FDAAs, TRSE or other methods are highlighted in bold. The node where pbp2 and mreB (and the associated mreCD and rodA genes) are predicted to have been lost within the Rhizobiales is highlighted in blue. The tree, based on a concatenation conserved protein-coding gene sequences, is fully supported, with posterior probabilities of 1 for all clades. See the online Methods section for details on phylogenetic reconstruction and refer to Table S3 for genome IDs and mode of cell elongation. (d) This schematic, derived from a pruned version of the phylogenetic tree in Fig. 5a to highlight the species of interest, illustrates the identified modes of cell elongation and the possible number of transitions. The transitions are depicted assuming two scenarios: unidirectional cell elongation as the ancestral state (left, red) or bidirectional midcell elongation as the ancestral state (right, magenta). Colored lines and arrows (red or magenta) indicate where the transitions might have occurred.
Fig. 6.
Fig. 6.. FDAA labeling experiments demonstrate polar and unidirectional midcell elongation in A. biprosthecum and unidirectional midcell elongation in R. capsulatus.
(a) Schematic depicting the FDAA pulse-chase experiments in A. biprosthecum and R. capsulatus. Whole-cell PG was labeled with 500 µm TADA (green) over two generations, followed by washes with medium to remove free FDAA from the medium. Subsequent growth in the absence of the FDAA (the chase) was followed by time-lapse microscopy. Loss of FDAA signal during the chase period corresponds to new PG synthesis/turnover. (b,f) Kymographs of the pulse chase experiments showing the loss of FDAA fluorescence during the chase period in (b) A. biprosthecum and (f) R. capsulatus. Images were taken every 5 minutes. See Extended Data Fig. 6 and 7 for additional kymographs. (c) Schematic depicting the dual short-pulse experiment showing active PG synthesis. Cells were first labeled with TADA for 5% of their generation time, washed with fresh media to remove free FDAA, allowed to grow without FDAA and then labeled with BADA for 5% of their generation time. Cells were then washed again and imaged with phase and fluorescence microscopy. (d,g) Representative images and demographs showing the fluorescence intensity of both FDAA signals in (d) A. biprosthecum and (g) R. capsulatus. In the demographs, cells were arranged by length, with the old pole (labelled with WGA, not shown) to the right in A. biprosthecum, and with the maximum fluorescence intensity of the first FDAA to the left in R. capsulatus. 50% of the maximum fluorescence intensities are shown. The white brackets indicate the 50 cells selected to show the fluorescence profiles of the two FDAAs in (e) and (f). Scale bars: 2 µm. See Extended Data Fig. 6 and 7 for demographs showing each FDAA individually and with the full range of fluorescence signal. (e,h) Fluorescence intensity profiles of FDAA 1 (TADA, red line) and FDAA 2 (BADA, green line) in (e) A. biprosthecum cells and (h) R. capsulatus cells, plotted from n = 50 cells for both species. Points were selected along the medial axis of each cell, and the normalized signal was plotted relative to position along the cell length. The lines represent the mean values, with error bars showing the standard error of the mean (SEM).

References

    1. Curtis P. D. & Brun Y. V. Getting in the loop: regulation of development in Caulobacter crescentus. Microbiol Mol Biol Rev 74, 13–41, doi:10.1128/MMBR.00040-09 (2010). - DOI - PMC - PubMed
    1. Woldemeskel S. A. & Goley E. D. Shapeshifting to Survive: Shape Determination and Regulation in Caulobacter crescentus. Trends Microbiol 25, 673–687, doi:10.1016/j.tim.2017.03.006 (2017). - DOI - PMC - PubMed
    1. Egan A. J., Errington J. & Vollmer W. Regulation of peptidoglycan synthesis and remodelling. Nature Reviews Microbiology 18, 446–460 (2020). - PubMed
    1. Kysela D. T., Randich A. M., Caccamo P. D. & Brun Y. V. Diversity Takes Shape: Understanding the Mechanistic and Adaptive Basis of Bacterial Morphology. PLoS Biol 14, e1002565, doi:10.1371/journal.pbio.1002565 (2016). - DOI - PMC - PubMed
    1. Randich A. M. & Brun Y. V. Molecular mechanisms for the evolution of bacterial morphologies and growth modes. Front Microbiol 6, 580, doi:10.3389/fmicb.2015.00580 (2015). - DOI - PMC - PubMed

Publication types

LinkOut - more resources