[Preprint]. 2024 Nov 5:2024.11.04.621964.
doi: 10.1101/2024.11.04.621964.

A rare HSC-derived megakaryocyte progenitor accumulates via enhanced survival and contributes to exacerbated thrombopoiesis upon aging

Affiliations

A rare HSC-derived megakaryocyte progenitor accumulates via enhanced survival and contributes to exacerbated thrombopoiesis upon aging

Bryce A Manso et al. bioRxiv. .

Update in

Abstract

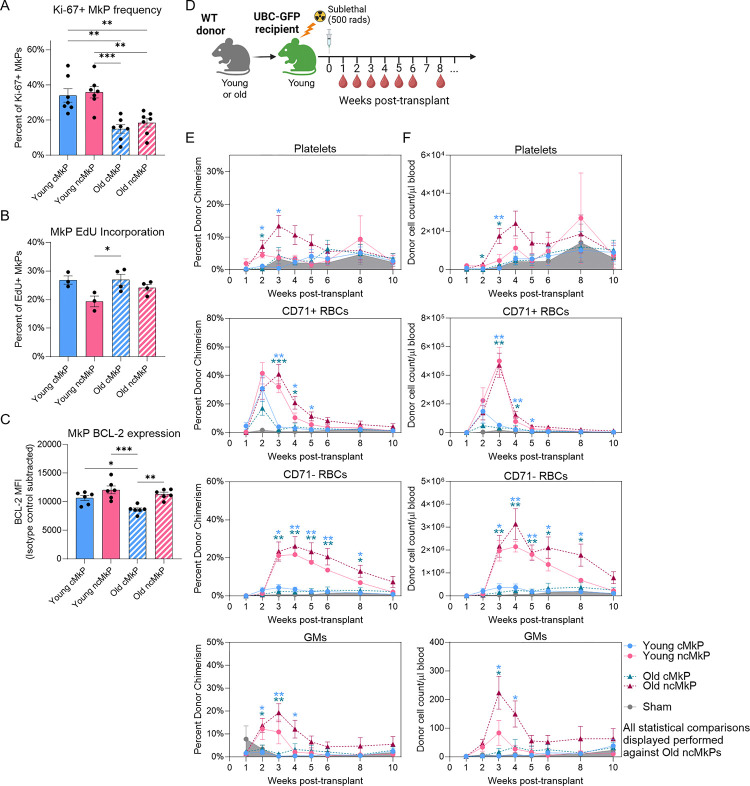
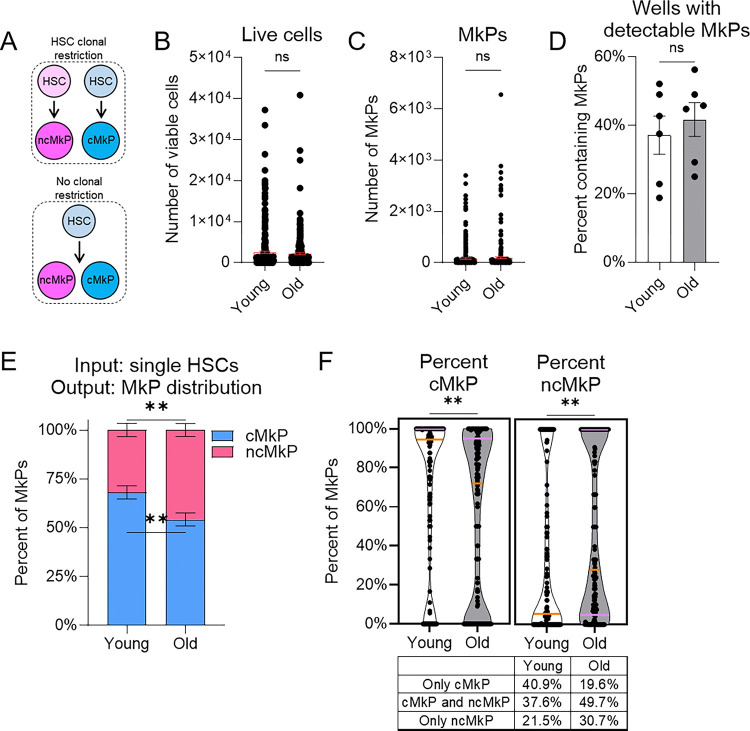
Distinct routes of cellular production from hematopoietic stem cells (HSCs) have defined our current view of hematopoiesis. Recently, we challenged classical views of platelet generation, demonstrating that megakaryocyte progenitors (MkPs), and ultimately platelets, can be specified via an alternate and additive route of HSC-direct specification specifically during aging. This "shortcut" pathway generates hyperactive platelets likely to contribute to age-related platelet-mediated morbidities. Here, we used single-cell RNA/CITEseq to demonstrate that these age-unique, non-canonical (nc)MkPs can be prospectively defined and experimentally isolated from wild type mice. Surprisingly, this revealed that a rare population of ncMkPs also exist in young mice. Young and aged ncMkPs are functionally distinct from their canonical (c)MkP counterparts, with aged ncMkPs paradoxically and uniquely exhibiting enhanced survival and platelet generation capacity. We further demonstrate that aged HSCs generate significantly more ncMkPs than their younger counterparts, yet this is accomplished without strict clonal restriction. Together, these findings reveal significant phenotypic, functional, and aging-dependent heterogeneity among the MkP pool and uncover unique features of megakaryopoiesis throughout life, potentially offering cellular and molecular targets for mitigation of age-related adverse thrombotic events.


Conflict of interest statement

Declaration of interests The authors declare no competing interests.

Figures

Figure 1.
Figure 1.. Aged GFP+ and Tom+ MkPs possess unique transcriptomic and proteomic profiles.
A. Schematic of hematopoiesis in aged FlkSwitch mice,,. In this model, HSCs express the tdtomato (Tom) transgene. Upon differentiation to multipotent progenitors (MPPs), recombination mediated by Flk2− (Flt3)-Cre deletes the Tom transgene and allows irreversible expression of GFP+. Thus, all downstream progenitors and mature cells remain GFP+ for life. Canonical megakaryocytic specification then progresses through a series of increasingly restricted myeloid progenitors including common myeloid progenitors (CMPs), megakaryocyte-erythroid progenitors (MEPs), and megakaryocyte progenitors (MkPs). During aging, a unique and additive population of Tom-expressing MkPs and platelets arise directly from HSCs. Shaded area represents the view of canonical hematopoiesis. Red and green colors represent Tom and GFP expression, respectfully. GMP: granulocyte monocyte progenitor, EP: erythroid progenitor, and CLP: common lymphoid progenitor. B. Schematic of candidate marker determination from bulk RNAseq and scRNA/CITEseq. C-D. Volcano plots of C. bulk and D. single cell pseudobulked RNAseq data comparing aged FlkSwitch GFP+ and Tom+ MkPs from Poscablo et al., 20242. Restrictive thresholds are adjusted p-value <0.01 and absolute log2 fold change ≥2.5, indicated by blue points. Labeled genes indicate those predicted to encode cell surface proteins that have commercially available flow cytometry compatible antibodies. C. 8120 total genes and D. 11570 total genes plotted. E. CITEseq analysis of aged GFP+ and Tom+ MkPs ran simultaneously with scRNAseq. Dashed lines indicate Wilcoxon Score cutoffs (restrictive cutoffs at 10 and −10, black lines, and relaxed thresholds at 5 and −5, blue lines). F. Flow cytometry analysis of CD48 expression (background subtracted median fluorescent intensity [MFI]) among aged FlkSwitch GFP+ and Tom+ MkPs. Each point represents a single mouse with lines connecting cells from the same animal. Paired t-test, ***p<0.001. Example flow cytometry histogram indicating the fluorescence minus one (FMO) control (grey), GFP+ MkPs (green), and Tom+ MkPs (red). n=8 mice across 5 independent experiments. G. Uniform Manifold Approximation and Projection (UMAP) of aged GFP+ and Tom+ MkPs from FlkSwitch mice. Top panel indicates MkPs classified as either GFP+ or Tom+ as in Poscablo et al., 20242. Bottom panel demonstrates CD48 CITEseq protein expression intensity across the same cells. H. Histogram display of CD48 CITEseq protein expression across aged GFP+ and Tom+ MkPs from the scRNAseq data in G. GFP+ MkPs (green) and Tom+ MkPs (red). I. Flow cytometry analysis of CD321 expression (background subtracted MFI) among aged FlkSwitch GFP+ and Tom+ MkPs. Each point represents a single mouse with lines connecting cells from the same animal. Paired t-test, ***p<0.001. Example flow cytometry histogram indicating the fluorescence minus one (FMO) control (grey), GFP+ MkPs (green), and Tom+ MkPs (red). n=9 mice across 6 independent experiments. J. Summary of cell surface candidates as a measure of fold change in relative protein expression. Horizontal lines indicate two-fold change threshold. Shaded areas indicate if markers are more prevalent on GFP+ (green) or Tom+ (red) aged FlkSwitch MkPs. See also Supplemental Figure 1. Data for CD119 and CD105 from Poscablo et al., 20242.
Figure 2.
Figure 2.. CD48 and CD321 efficiently enrich for GFP+ and Tom+ MkPs in old mice.
A-B. Example flow cytometry plots demonstrating the efficiency of using CD48 and CD321 in combination to enrich for aged GFP+ and Tom+ MkPs among FlkSwitch mice. C-D. The C. frequency and D. number of aged MkPs defined as GFP+, Tom+, cMkP, or ncMkP. Unpaired t-tests comparing GFP+ to cMkP and Tom+ to ncMkP. C. n=14 across 9 independent experiments and D. n=5 across 2 independent experiments. E. Frequency of cMkP and ncMkP among aged MkPs from wild-type (WT) mice. n=43 across more than 10 independent experiments. F. Number of cMkPs and ncMkPs among WT mice at the ages indicated. n=11, 12, 12, 17, 12, and 14 for ages 2–3, 6, 9, 12, 18, and 20–24 months, respectfully across 10 independent experiments. **p<0.01 and ****p<0.0001 evaluated across cMkPs and ncMkPs individually by one-way ANOVA with Dunnett’s multiple comparisons test comparing all populations against the 2–3 month group. Color of the asterisks indicates statistically significant comparisons.
Figure 3.
Figure 3.. Aged cMkP and ncMkP transcriptomic signatures recapitulate their analogous GFP+ and Tom+ counterparts.
A. Schematic of additional transcriptomic MkP subtype annotations. B. Comparison of the four annotation methods and how they perform compared to the original aged GFP+ and Tom+ MkPs identified via “RNA only, GFP and Tom” annotation. C. Venn diagrams comparing the overlap in the numbers of DEGs generated by the three best annotation methods, comparing either aged GFP+ and Tom+ or cMkP and ncMkP populations. Left, DEG comparisons using strict statistical thresholds. Right, DEG comparisons using relaxed statistical thresholds. D-F. GO Term Analysis between aged MkP subpopulations across three annotation methods. Top 15 GO Terms displayed. D. GFP+ and Tom+ MkPs from the “RNA only, GFP and Tom” annotation. E. cMkPs and ncMkPs from the “RNA and CITE” annotation. F. cMkPs and ncMkPs from the “CITE only annotation.
Figure 4.
Figure 4.. ncMkPs gain a survival advantage with age.
A. Fold change over input (2000 MkPs) for the number of phenotypic MkPs recovered following three days in culture. Each point represents the average of up to three technical replicates as cell number allowed. n=11–16 mice across 8 independent experiments. ****p<0.0001 by one-way ANOVA and adjusted for multiple comparisons via Tukey’s test. B. Histogram representations of CellTrace Violet (CTV) distribution among MkPs cultured in vitro for three days. C. Proportion of in vitro cultured MkPs that proliferated or not over the three day culture. n=3–4 across 4 independent experiments. Up to three technical replicates per mouse were averaged together. Statistical non-significance determined via one-way ANOVA adjusted for multiple comparisons via Tukey’s test, no proliferation and proliferation groups tested separately. D. Representative flow cytometry plots of in vitro viability determination following three days of culture. Cells were defined as dead if they were fixable viability dye (FVD) positive. Determination of non-dead cell states were made among cells that were FVD negative. E. Proportion of viability cell states of three day cultured MkPs. n=3–4 across 4 independent experiments. Up to three technical replicates per mouse were averaged together. *p<0.05, **p<0.01, and ****p<0.0001 by one-way ANOVA adjusted for multiple comparisons via Tukey’s test, each cell state tested separately.
Figure 5.
Figure 5.. ncMkPs have distinct functional capacity from cMkPs and gain enhanced platelet specification ability upon aging.
A-C. Flow cytometry analysis of MkP populations from freshly isolated BM. Each point represents an individual mouse, and the frequency or MFI is background-subtracted from an isotype or negative control. *p<0.05, **p<0.01, and ***p<0.001 by one-way ANOVA adjusted for multiple comparisons via Tukey’s test. A. Frequency of cells expressing Ki-67. n=7 across 5 independent experiments. B. Frequency of cells incorporating EdU 24 hours post-injection. n=3–4 across 4 independent experiments. C. Relative BCL-2 abundance as determined by standardized flow cytometry. n=6 across 5 independent experiments. D. MkP transplantation experimental design. E-F. The E. percent donor chimerism and F. donor-derived cell number/μl of blood for the indicated populations. Shaded area represents the sham control. Each point represents the mean ± SEM. See supplemental Figure 7A–B, 5 independent experiments. *p<0.05, **p<0.01, and ***p<0.001 by two-way ANOVA adjusted via Dunnett’s multiple comparisons test, comparing each group at each time point to the aged ncMkPs for display simplification.
Figure 6.
Figure 6.. Aged HSCs specifically generate ncMkPs and restore output balance upon exposure to a young environment.
A-B. Number of A. total live cells or B. phenotypic MkPs generated following seven days of in vitro HSC culture. Each point represents the average of three technical replicates from individual mice. *p<0.05 by unpaired t-test. n=15 across 9 individual experiments. C. Representative flow cytometry plots of in vitro HSC-derived phenotypic MkPs, cMkPs, and ncMkPs. D-E. Proportion D. and number E. of cMkPs and ncMkPs generated by HSCs following seven days of in vitro culture. **p<0.01 and ****p<0.0001 by unpaired t-test. n and number of experiments as in A-B. F. Frequency of cMkPs and ncMkPs generated by CD41− MyPros following seven days of in vitro culture. Statistical non-significance by unpaired t-test. n=5 across 3 individual experiments. G-I. Young or old HSCs were transplanted into young sublethally irradiated (500 Rad) young WT hosts. After 16–20 weeks, BM was analyzed for the G. number of donor-derived total MkPs and H-I. number and frequency of cMkPs and ncMkPs, respectfully. Each point represents an individual mouse. n=6 young and 5 old from 2 independent experiments. Statistical non-significance by unpaired t-test.
Figure 7.
Figure 7.. ncMkPs are not exclusively generated by clonally-restricted HSCs.
A. Model of potential HSC clonal restriction to MkP subtype. B-C. Number of B. total live cells or C. phenotypic MkPs generated following seven days of in vitro single cell HSC culture. Each point represents an individual input HSC. Statistical non-significance by unpaired t-test. For young and old, n=288 individual HSCs each from 5 individual mice across 3 individual experiments. D. Among single HSC cultures, frequency of HSCs giving rise to at least one phenotypic MkP. Each point represents an individual mouse, n=6 per age across 4 individual experiments. Statistical non-significance by unpaired t-test. E-F. MkP subtype distribution produced by single HSC cultures. E. Overall MkP subtype distribution. F. Granular analysis of data from E. Frequency of cMkP (left) or ncMkP (right) among young and old single-cultured HSCs. Orange line indicates the median whereas the purple lines indicates the quartiles. Each point represents an individually-cultured HSC that gave rise to at least one phenotypic MkP. **p<0.01 by unpaired t-test. Table provides summary of MkP output distribution from individual HSCs. n=149 young and n=163 old across 6 individual experiments.

References

    1. Manso B. A., Rodriguez Y. B. A. & Forsberg E. C. From Hematopoietic Stem Cells to Platelets: Unifying Differentiation Pathways Identified by Lineage Tracing Mouse Models. Cells 13, doi: 10.3390/cells13080704 (2024). - DOI - PMC - PubMed
    1. Poscablo D. M. et al. An age-progressive platelet differentiation path from hematopoietic stem cells causes exacerbated thrombosis. Cell 187, 3090–3107 e3021, doi: 10.1016/j.cell.2024.04.018 (2024). - DOI - PMC - PubMed
    1. de Haan G. & Lazare S. S. Aging of hematopoietic stem cells. Blood 131, 479–487, doi: 10.1182/blood-2017-06-746412 (2018). - DOI - PubMed
    1. Geiger H., de Haan G. & Florian M. C. The ageing haematopoietic stem cell compartment. Nat Rev Immunol 13, 376–389, doi: 10.1038/nri3433 (2013). - DOI - PubMed
    1. Rossi D. J., Jamieson C. H. & Weissman I. L. Stems cells and the pathways to aging and cancer. Cell 132, 681–696, doi: 10.1016/j.cell.2008.01.036 (2008). - DOI - PubMed

Publication types

LinkOut - more resources