[Preprint]. 2024 Nov 4:2024.11.03.621734.
doi: 10.1101/2024.11.03.621734.

A PERTURBATION CELL ATLAS OF HUMAN INDUCED PLURIPOTENT STEM CELLS

Affiliations

A PERTURBATION CELL ATLAS OF HUMAN INDUCED PLURIPOTENT STEM CELLS

Sami Nourreddine et al. bioRxiv. .

Abstract

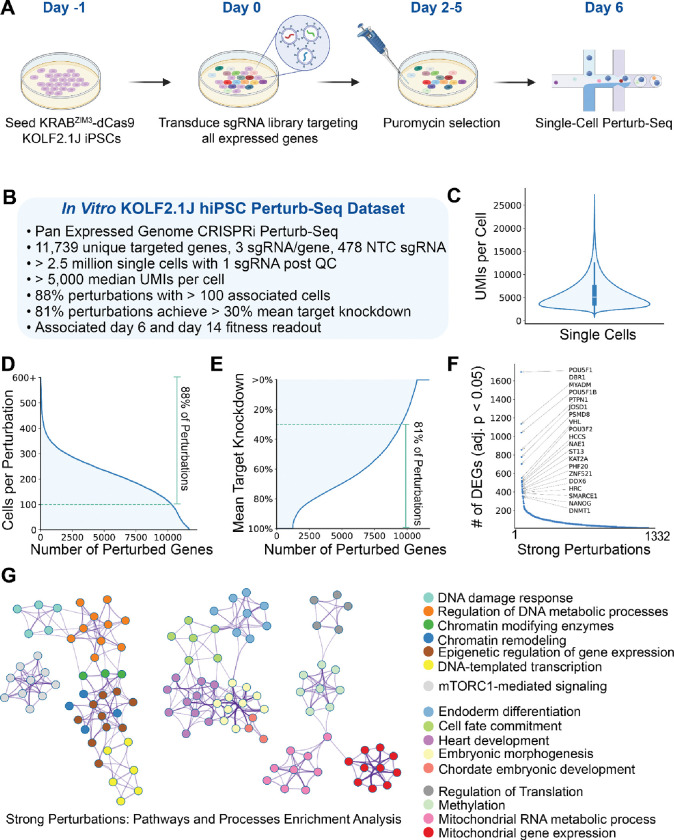
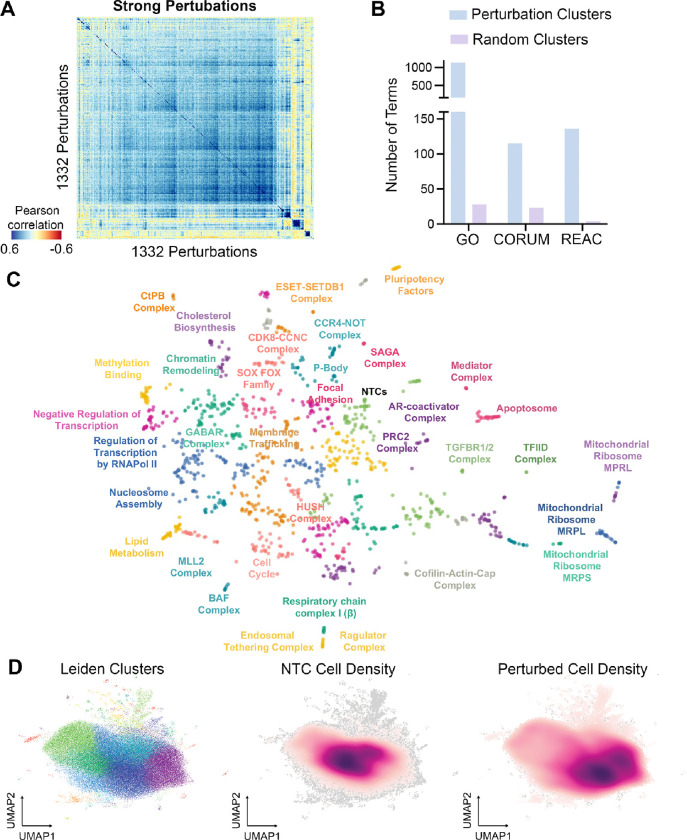
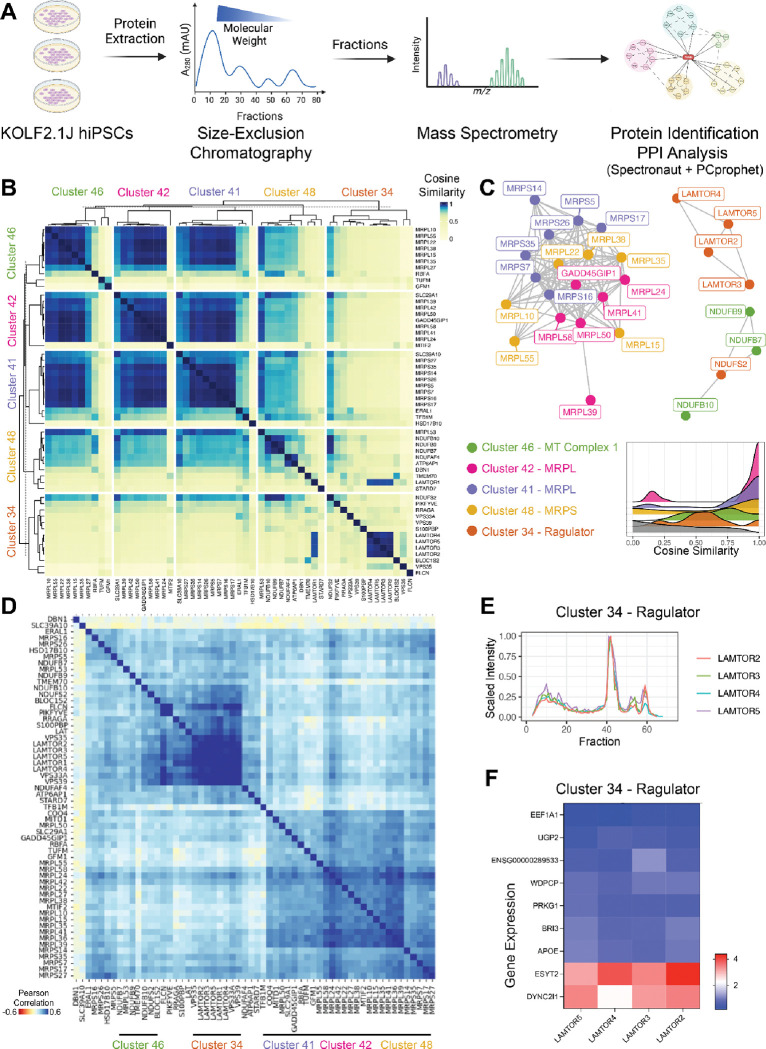
Towards comprehensively investigating the genotype-phenotype relationships governing the human pluripotent stem cell state, we generated an expressed genome-scale CRISPRi Perturbation Cell Atlas in KOLF2.1J human induced pluripotent stem cells (hiPSCs) mapping transcriptional and fitness phenotypes associated with 11,739 targeted genes. Using the transcriptional phenotypes, we created a minimum distortion embedding map of the pluripotent state, demonstrating rich recapitulation of protein complexes, such as strong co-clustering of MRPL, BAF, SAGA, and Ragulator family members. Additionally, we uncovered transcriptional regulators that are uncoupled from cell fitness, discovering potential novel pluripotency (JOSD1, RNF7) and metabolic factors (ZBTB41). We validated these findings via phenotypic, protein-interaction, and metabolic tracing assays. Finally, we propose a contrastive human-cell engineering framework (CHEF), a machine learning architecture that learns from perturbation cell atlases to predict perturbation recipes that achieve desired transcriptional states. Taken together, our study presents a comprehensive resource for interrogating the regulatory networks governing pluripotency.


Conflict of interest statement

DECLARATION OF INTERESTS P.M. is a scientific co-founder of Shape Therapeutics, Boundless Biosciences, Navega Therapeutics, Pi Bio, and Engine Biosciences. The terms of these arrangements have been reviewed and approved by the University of California San Diego in accordance with its conflict of interest policies. The Krogan Laboratory has received research support from Vir Biotechnology, F. Hoffmann-La Roche, and Rezo Therapeutics. Nevan Krogan has a financially compensated consulting agreement with Maze Therapeutics. Nevan Krogan is the President and is on the Board of Directors of Rezo Therapeutics, and he is a shareholder in Tenaya Therapeutics, Maze Therapeutics, Rezo Therapeutics, GEn1E Lifesciences, and Interline Therapeutics.

Figures

Figure 1:
Figure 1:. Pan-Expressed Genome CRISPRi Perturb-Seq in KOLF2.1J iPSC.
(A) Experimental workflow of the in vitro CRISPRi Perturb-Seq in KRABZIM3-dCas9 KOLF2.1J hiPSCs. Cells were seeded on day −1, transduced with an sgRNA library targeting all expressed genes on day 0, selected with puromycin from day 2 to day 5, and harvested for single-cell Perturb-Seq on day 6. (B) Overview of the KOLF2.1J hiPSC Perturb-Seq dataset. This genome-scale CRISPRi dataset covers 11,739 unique targeted genes with 3 sgRNAs per gene, along with 478 non-targeting control (NTC) sgRNAs. The dataset includes >2.5 million single cells with a median of >5,000 UMIs per cell, 88% of perturbations have >100 associated cells, and 81% achieved >30% mean target knockdown efficiency. (C) Distribution of unique molecular identifiers (UMIs) per cell across single-cell samples, showing a robust capture of transcriptomic data with a median UMI count of >5,000 per cell. (D) Number of cells per gene across the library, highlighting that 88% of perturbations have >100 associated cells, ensuring sufficient statistical power for downstream analysis. (E) Distribution of mean target knockdown efficiency, indicating that 81% of perturbations achieve >30% knockdown of their target genes, confirming the efficacy of the CRISPRi system in KOLF2.1J cells. (F) Top perturbations by number of differentially expressed genes (DEGs) with adjusted p-value < 0.05. Known pluripotency regulators, such as POU5F1, NANOG, and PSMD8, rank among the strongest perturbations. (G) Functional network of strong perturbations computed with Metascape. Each cluster represents key biological processes, and each node represents a gene, color-coded by function.
Figure 2:
Figure 2:. Correlation Landscape of Strong Perturbations.
(A) Pearson correlation clustermap of pseudo bulked transcriptional profiles of strong perturbations (B) Functional enrichment analysis comparing the number of terms identified in the 50 perturbation clusters derived from the Minimal distortion embedding (C) versus 50 clusters with randomized perturbations across three databases: Gene Ontology (GO), CORUM, and Reactome (REAC). (C) Minimal distortion embedding (MDE) of pseudo bulked transcriptional profiles of strong perturbations. Clusters are labeled with associated enriched GO/CORUM/GSAI terms. (D) UMAP plots of cell density distributions: (left) Leiden clusters showing the organization of perturbations, (center) cell density distribution of non-targeting controls (NTCs), and (right) density distribution of perturbed cells.
Figure 3.
Figure 3.. Undifferentiated hiPSC Fitness Screens.
(A) Experimental workflow, KOLF2.1J constitutively expressing KRABZIM3-dCas9 were transduced with lentivirus libraries encoding for single guide RNA (sgRNA). Cells were cultured in pluripotency maintenance media mTesR and were harvested at day 6 and day 14 post-transduction. (B) Waterfall plots of Genes ranked by Z-score in descending order at days 6 and 14. Blue numbers correspond to enriched perturbations (Z-score>1;p-value<0.05), while red numbers correspond to depleted perturbations (Z-score<−1 p-value<0.05). (C) Functional enrichment analysis of the significant perturbations decreasing (red) or increasing fitness (blue) in KOLF2.1J. (D) Venn diagram representing overlap between the 1428 most depleted perturbations (Z-score<−1 p-value<0.05) in KOLF2.1J (KOLF2.1J essential) and the common essential genes identified in 1150 cell lines from DepMap portal (24Q2). In pink, functional enrichment analysis of the depleted perturbations that are exclusively found in KOLF2.1J. (E) Protein-Protein interaction enrichment analysis of the top depleted (red) and enriched (blue) perturbations. (F) Distribution of fitness Z-score at day 6 (D6) and day 14 (D14) of 478 unique NTC sgRNAs (NTCs) or Mitochondrial Translation 30 genes/90sgRNAs (1) Fanconi Anemia Pathway 12 genes/36sgRNAs(2) Positive Regulation of Apoptosis 7 genes/21sgRNAs (3) SAGA Complex 6 genes/18sgRNAs(4) Positive Regulation of Cytochrome C Release 5 genes/15sgRNAs(5). Asterisks indicate significant differences to D14 NTC condition (*p < 0.05, **p < 0.01, ***p < 0.001, ****p < 0.0001) (G) Left: Correlation between fitness calculated from bulk genomic DNA extraction at day 6 versus fitness calculated from abundance of cells captured by single-cell RNA-sequencing. Right: relationship between fitness (Z-score, bulk) and the number of differentially expressed genes (DEGs + 1) on a logarithmic scale. Each point represents a perturbation, points in purple represent all perturbations detected (11,688), in orange perturbations detected with less than 25 cells (427), in black the strong perturbations with more than 10 DEGs (1332).
Figure 4.
Figure 4.. A Machine Learning Framework Towards Cell State Engineering.
(A) Overlap between strong perturbations identified in KOLF2.1J (this study) and K562 (Replogle et al.) datasets. (B) Metascape pathways and process enrichment analysis on strong perturbations identified exclusively in KOLF2.1J cells. (C) Proposed model architecture. Using perturbation atlas(es), a self- or semi- supervised encoder learns a perturbation embedding which corresponds to the difference in cell state between wild-type and perturbed cells. This embedding is then decoded by a supervised decoder to indicate which perturbation was applied. In our specific implementation, ContrastiveVI is first trained on the Perturb-Seq atlas to identify a salient embedding which isolates perturbation-specific effects. Then, a logistic regression (LR) classifier is trained on salient embeddings to decode them into the corresponding perturbation. Once this model is trained, a potential application is cell state engineering, where the transcriptome of a desired cell state (e.g. neuron) can be passed into the model, and it can infer candidate perturbations to make to WT cells to achieve that cell state. (D) UMAP visualization of salient embedding space for 6 perturbations + NTC (E) Confusion matrix and model metrics of LR classifier on predicting applied perturbations from salient cell state embeddings. (F) Inference of model on pseudo-bulked transcriptional profiles of previously unseen perturbations recapitulate observed clustering in MDE.
Figure 5.
Figure 5.. Validation of Protein-Protein Interactions in hiPSCs Using Size-Exclusion Chromatography-Mass Spectrometry (SEC-MS) and Transcriptomic Analyses.
(A) Experimental workflow for protein interaction analysis in KOLF2.1J hiPSCs. Proteins were extracted from hiPSC samples and separated by size-exclusion chromatography. Fractions were analyzed by mass spectrometry to identify and quantify proteins by Spectronaut, followed by protein-protein interaction (PPI) analysis yielding interaction networks based on cosine similarity of fractionation profiles. (B) Heatmap of cosine similarity among Perturb-Seq derived MDE protein clusters that show significant enrichment for very high cosine similarity in the SEC-MS PPI. Perturb-Seq derived MDE Cluster 46 (green), Cluster 42 (pink), Cluster 41 (blue), Cluster 48 (purple), and Cluster 34 (orange). Cosine similarity scores are shown, with higher similarity (yellow) indicating co-elution across fractions. (C) Identified interactions among proteins from SEC-MS, with each color-coded according to Perturb-Seq MDE cluster. Clusters are labeled as follows: Cluster 46 (MT Complex 1, green), Cluster 42 (MRPL, pink), Cluster 41 (MRPL, blue), Cluster 48 (MRPS, purple), and Cluster 34 (Ragulator, orange). Edges represent strong cosine similarity (>0.97), indicating probable protein interactions. Histogram graph showing cosine similarity distribution of protein pairs within individual clusters (color-filled) versus all protein pairs between any different Perturb-Seq MDE clusters (grey filled), with peaks near 1.0 indicating strong interaction scores within clusters. (D) Pearson correlation heatmap of transcriptomic data from Perturb-Seq across MDE derived cluster: Cluster 46 (green), Cluster 42 (pink), Cluster 41 (blue), Cluster 48 (purple), and Cluster 34 (orange). (E) Fractionation profile of Ragulator complex subunits (Cluster 34), which create a connected network component in C, across size-exclusion chromatography fractions. (F) Gene expression heatmap Log2FoldChange of common DEGs between LAMTOR2, LAMTOR3, LAMTOR4, and LAMTOR5.
Figure 6.
Figure 6.. Validation of Novel hiPSC Pluripotency and Mitochondrial Factors.
(A) Pearson correlation between perturbation MDE clusters with known interactors highlighted in green for cluster 31/Pluripotency factors and cluster 20/Mitochondrial Translation. (B) Experimental workflow for metabolic tracing of mitochondrial flux validation experiment run in KOLF2.1J KRABZIM3-dCas9 transduced with sgRNAs NTC or MRPL11, or MRPL37 or ZBTB41 (C) Metabolic tracing of [U-13C]Glucose into α-Ketoglutarate isotopologues (M+0 to M+5) under different genetic perturbations. Five different single-guide RNAs (sgRNAs) were used to target MRPL11 (orange), MRPL37 (purple), ZBTB41 (yellow), and a non-targeting control (NTC, blue). The bar graph represents the percentage of isotopologue labeling from [U-13C]Glucose, showing the distribution from M+0 (unlabeled) to M+5 (fully labeled) α-Ketoglutarate. Significant differences are indicated between sgRNA-targeted genes and the NTC, as denoted by the asterisks (*p < 0.05,**p < 0.01,***p < 0.001, ****p < 0.0001). (D) Ratio of succinate to fumarate in cells transduced with various sgRNAs: MRPL11 (red), MRPL14 (green), MRPL37 (purple), ZBTB41 (yellow), and a non-targeting control (NTC, blue). Significant differences are indicated between sgRNA-targeted genes and the NTC, as denoted by the asterisks (*p < 0.05, **p < 0.01). (E) Quantitative PCR analysis of gene expression in cells transduced with sgRNAs targeting POU5F1 (purple), JOSD1 (pink), RNF7 (red), and a non-targeting control (NTC, blue). Asterisks indicate statistical significance (*p < 0.05, **p < 0.01, ***p < 0.001). (F) KOLF2.1J KRABZIM3-dCas9 were transduced with NTC, POU5F1 or JOSD1 sgRNAs and imaged 4 days post-transduction with brightfield at 20x magnification. Top left black scale bar = 50 μm. (G) Log2 fold change (Log2FC) in gene expression from Perturb-Seq across different sgRNA treatments. The heatmap displays the Log2FC of genes (POU5F1, GRID2, CD24, DPP10, SOX5, EPHA4, GREB1L) in cells treated with sgRNAs targeting POU5F1, JOSD1, and RNF7 compared to non-targeting controls (NTCs). (H) Log2 fold change (Log2FC) in gene expression from qPCR validation across different sgRNA treatments. The heatmap shows the Log2FC of the same genes as in panel G, validated by qPCR in cells treated with sgRNAs targeting POU5F1, JOSD1, and RNF7 compared to sg-NTC. (I) Correlation between Log2FC values from Perturb-Seq and qPCR validation. The scatter plot shows the correlation of Log2FC values from Perturb-Seq and qPCR validation, with a Pearson correlation coefficient (r = 0.91) across 7 perturbations and 11 differentially expressed genes (DEGs).

References

    1. Yamanaka S. (2020). Pluripotent Stem Cell-Based Cell Therapy-Promise and Challenges. Cell Stem Cell 27, 523–531. - PubMed
    1. Park I.-H., Zhao R., West J.A., Yabuuchi A., Huo H., Ince T.A., Lerou P.H., Lensch M.W., and Daley G.Q. (2008). Reprogramming of human somatic cells to pluripotency with defined factors. Nature 451, 141–146. - PubMed
    1. Warren L., Manos P.D., Ahfeldt T., Loh Y.-H., Li H., Lau F., Ebina W., Mandal P.K., Smith Z.D., Meissner A., et al. (2010). Highly efficient reprogramming to pluripotency and directed differentiation of human cells with synthetic modified mRNA. Cell Stem Cell 7, 618–630. - PMC - PubMed
    1. Takahashi K., and Yamanaka S. (2006). Induction of pluripotent stem cells from mouse embryonic and adult fibroblast cultures by defined factors. Cell 126, 663–676. - PubMed
    1. Wang H., Yang Y., Liu J., and Qian L. (2021). Direct cell reprogramming: approaches, mechanisms and progress. Nat. Rev. Mol. Cell Biol. 22, 410–424. - PMC - PubMed

Publication types

LinkOut - more resources