[Preprint]. 2024 Nov 5:2024.11.05.622138.
doi: 10.1101/2024.11.05.622138.

PgtE protease enables virulent Salmonella to evade C3-mediated serum and neutrophil killing

Affiliations

PgtE protease enables virulent Salmonella to evade C3-mediated serum and neutrophil killing

Michael H Lee et al. bioRxiv. .

Update in

Abstract

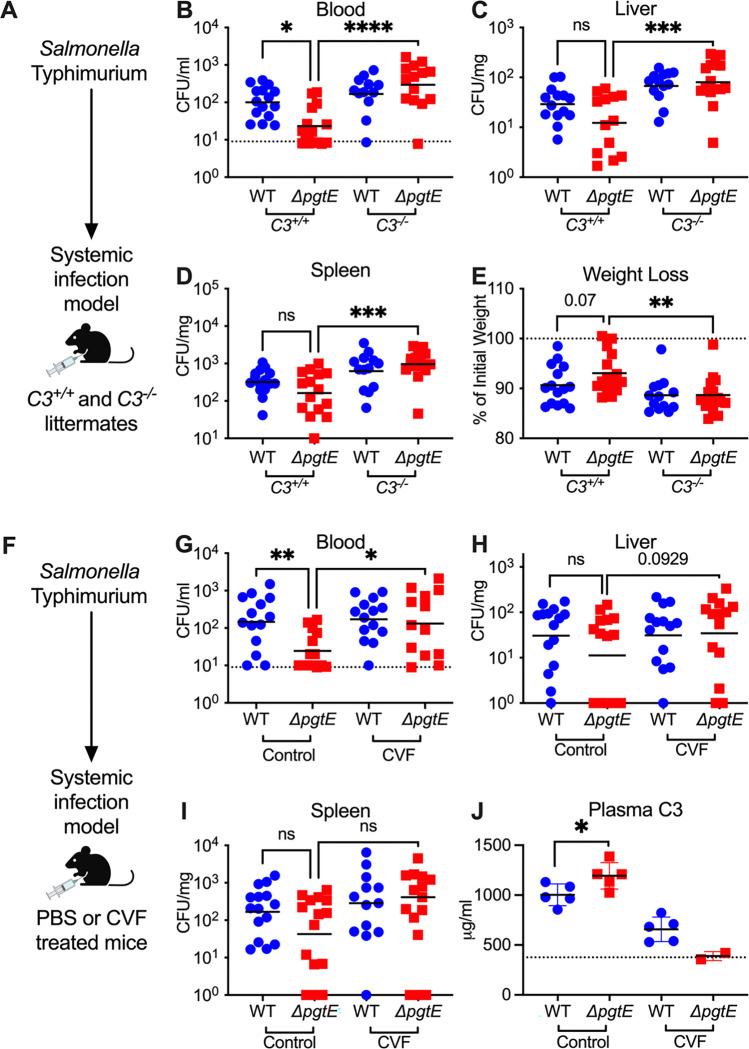
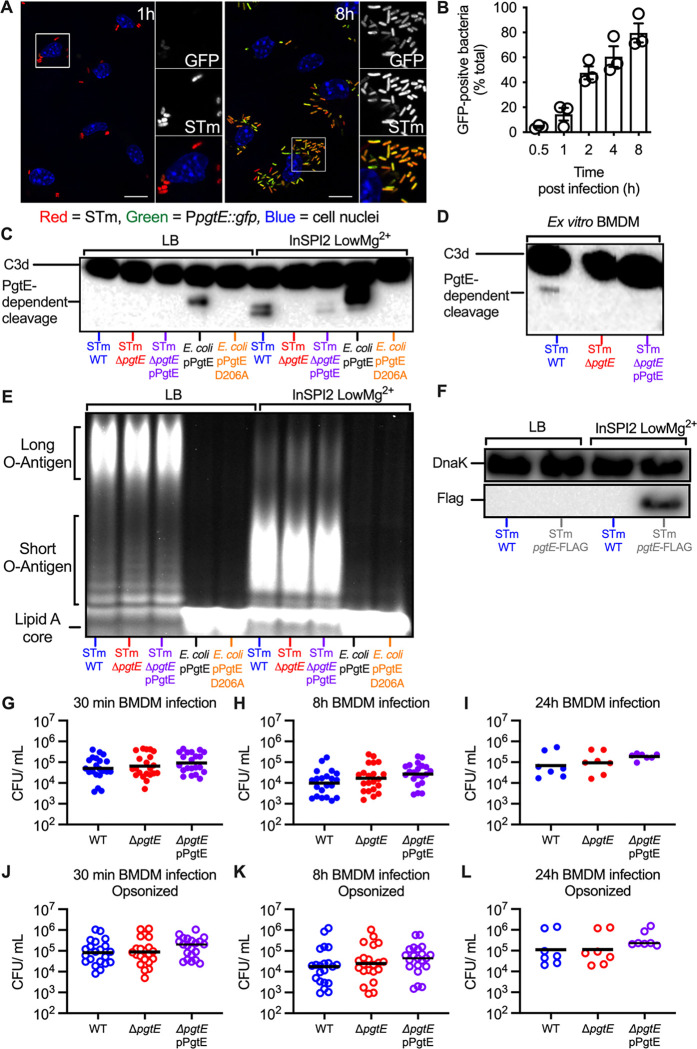
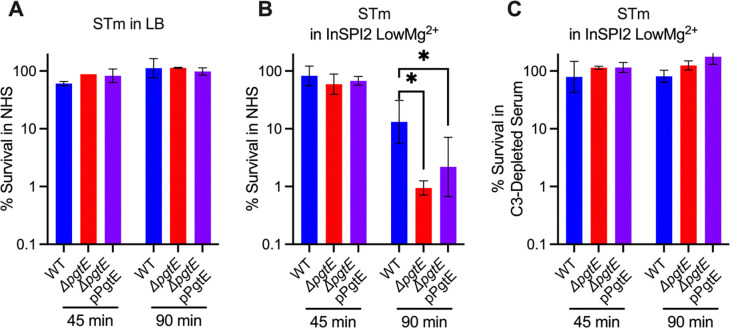
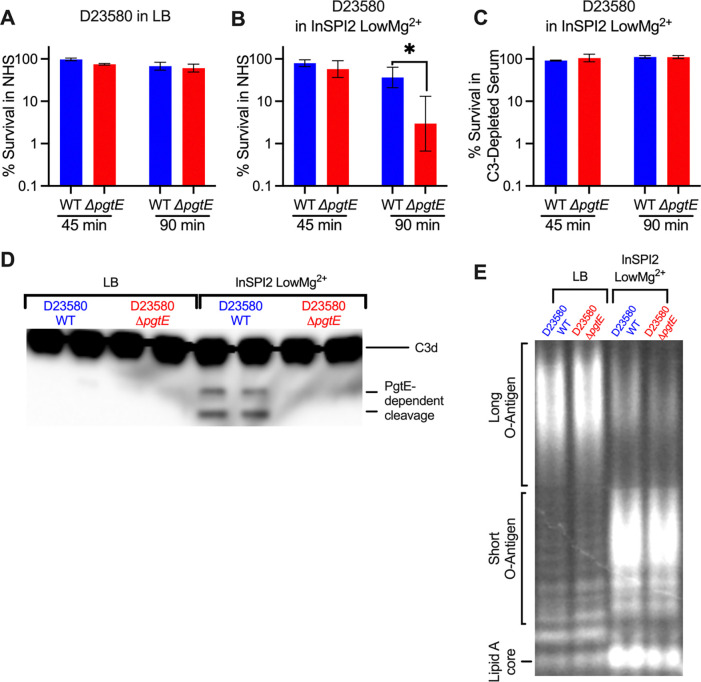
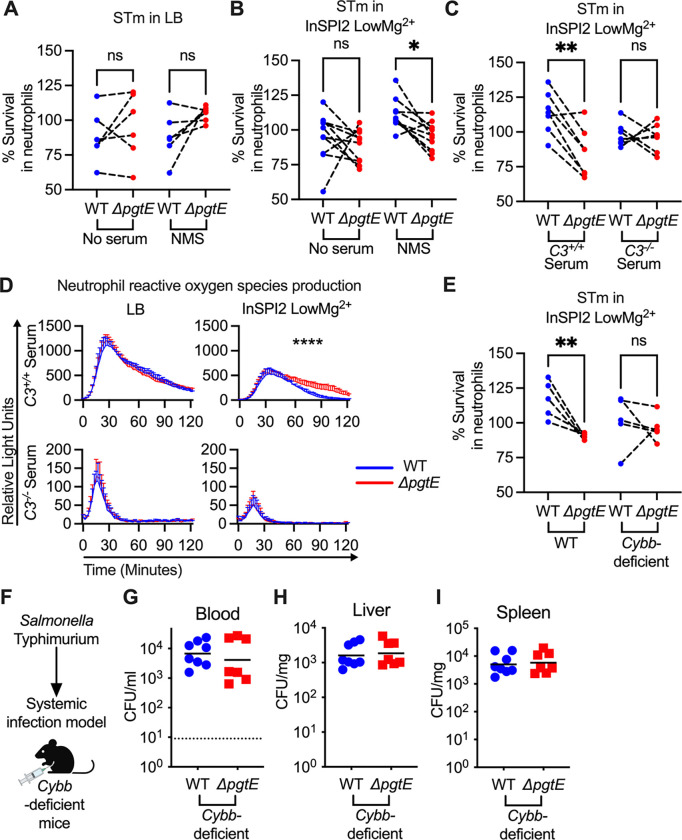
Non-typhoidal Salmonella serovars, such as Salmonella enterica serovar Typhimurium (STm), are a leading cause of inflammatory diarrhea in otherwise healthy individuals. Among children, the elderly, and immunocompromised individuals, STm can spread to systemic sites and cause potentially lethal bacteremia. Phagocytic cells and the immune complement system are pivotal to preventing the dissemination of STm. PgtE, an STm outer membrane protease, has been previously described to cleave over a dozen mammalian protein substrates in vitro, including complement protein C3. However, these activities have mostly been observed with mutant, avirulent strains with a truncated O-antigen that renders bacteria sensitive to complement killing. Here, we report that virulent STm utilizes PgtE to evade complement-mediated killing in vivo. The wild-type pathogen increases pgtE expression and PgtE proteolytic function within macrophages and in macrophage-like in vitro growth conditions, concomitant with physiologic O-antigen shortening in these environments. Furthermore, we found that wild-type STm's resistance to complement-mediated serum and neutrophil killing is PgtE-dependent. We propose that PgtE promotes the systemic spread of STm by acting as a second line of defense against complement when STm escapes from a macrophage.


Figures

Figure 1.
Figure 1.. PgtE promotes smooth STm survival in vivo by evading complement C3.
(A-E) 6–10-week-old C3+/+ and C3−/− littermates were infected intraperitoneally (IP) with 104 CFU wild-type (WT) or isogenic PgtE-deficient (ΔpgtE) Salmonella strain IR715. Mice were euthanized 24 hours after infection and bacterial burden in the (B) blood, (C) liver, and (D) spleen were quantified. (E) Weight loss = (weight at 24 hours / weight at time of infection)*100%. (F-J) 6–8-week-old C57B6/J mice were IP-injected with PBS (Control) or Cobra Venom Factor (CVF). 24 hours after treatment, mice were infected IP with 104 CFU of either IR715 WT or IR715 ΔpgtE. Mice were euthanized 24 hours after infection and bacterial burden was assessed in the (G) blood, (H) liver, and (I) spleen. (J) Concentration of complement C3 in plasma measured by ELISA: dotted line represents average from 3 uninfected control mice. (B, G) Dotted line represents the limit of detection of STm CFU in blood. (B-E) N = 16–17 per group pooled from 6 independent experiments. (G-I) N = 15 per group pooled from 3 independent experiments. (J) ELISA from 1 representative experiment. (B-E, G-I) Outliers found by ROUT outlier analysis Q= 1% are removed. Data were analyzed by Kruskal-Wallis test (non-parametric, non-paired) followed by Dunn’s multiple comparison test. Adjusted p values from Dunn’s multiple comparison test: * p < 0.05. ** p < 0.01. *** p < 0.001. ns = not significant. Symbols represent data from individual mice. Bars represent the (B-D, G-I) geometric means or (E, J) mean.
Figure 2.
Figure 2.. PgtE expression and function are increased in macrophages but do not increase smooth STm survival in macrophages.
(A, B) Temporal and spatial distribution of PgtE-positive STm inside BMDMs. (A) BMDMs were infected with mCherry-STm carrying a plasmid encoding for a PpgtE::gfp transcriptional reporter fusion. Representative confocal microscopy images from 1 h and 8 h post-infection are displayed. GFP-positive bacteria (green), Salmonella (red), and the cell nuclei (DAPI; blue) are shown. Inset panels show 2x enlarged regions; scale bars are 10 μm. (B) Kinetics of intracellular pgtE expression in BMDMs. The number of GFP-positive bacteria at each timepoint was scored by fluorescence microscopy and reported as a percentage of total (red) bacteria (n = 3 experiments). (C, E) Smooth STm IR715 wild-type (WT), isogenic PgtE-deficient (ΔpgtE), and ΔpgtE complemented in trans (ΔpgtE pPgtE) or rough E. coli with a pWSK29 plasmid containing a functional pgtE gene (pPgtE) or a pgtE gene with a single point mutation PgtE (pPgtE D206A) were cultured overnight in (Left) LB or (Right) InSPI2 LowMg2+ minimal media. (D) Alternatively, STm was isolated from BMDMs 8 hours after infection. STm and E. coli were then incubated with normal human serum for (C) 8 hours or (D) 13 hours. PgtE-dependent complement cleavage in supernatants was assessed by western blot analysis with anti-complement C3/C3b/iC3b/C3d antibody. (E) Alternatively, after overnight culture, STm and E. coli were lysed, run on a 4–12% Tris-Glycine gel, and stained with Pro-Q Emerald 300 Lipopolysaccharide Gel Stain Kit to assess O-antigen chain length. (F) Western blot analysis of STm WT or STm pgtE-FLAG cultured overnight in LB or InSPI2 LowMg2+ minimal media. The bottom half of the membrane was stained with anti-FLAG tag antibody. The top half of the membrane was stained with anti-DnaK as a loading control. (G-L) BMDMs were infected at an MOI = 1 with IR715 WT, ΔpgtE, and ΔpgtE pPgtE that were either (G-I) not opsonized or (J-L) opsonized with normal mouse serum. (G, J) 30 minutes after infection, BMDM were lysed with 1% Triton-X 100 and STm CFUs were enumerated. Alternatively, BMDM were incubated with 100 μg/mL gentamicin for 30 minutes, followed by (H, K) 7 hours or (I, L) 23 hours with 20 μg/mL gentamicin then lysed with 1% Triton-X 100. (G-L) N = 21 or 7 from 10 or 3 independent experiments. Symbols represent data from BMDMs from individual mice, bars represent the geometric means.
Figure 3.
Figure 3.. PgtE promotes survival of smooth, virulent STm in serum
(A-C) Serum killing assays were performed with smooth STm IR715 wild-type (WT), isogenic PgtE-deficient (ΔpgtE), and ΔpgtE complemented in trans (ΔpgtE pPgtE). Strains were cultured overnight (A) in LB or (B, C) in InSPI2 LowMg2+ minimal media. STm at 106 CFU/mL was then incubated with (A, B) 20% normal human serum (NHS) or (C) 20% C3-depleted human serum at 37 °C shaking at 300 rpm. CFU were enumerated at 0 minutes, 45 minutes, and 90 minutes. % survival = (CFU at 45 minutes or 90 minutes / CFU at 0 minutes)*100%. (A, C) n = 2, (B) n = 6 from 2–3 independent experiments. Bar and error represent geometric mean and standard deviation. Data were analyzed by 2-way ANOVA followed by Sidak multiple comparison test. Adjusted p values from Sidak multiple comparison test: * p < 0.05.
Figure 4.
Figure 4.. PgtE promotes survival of iNTS strain D23580 in serum when cultured in media mimicking the SCV luminal environment.
(A-C) Serum killing assays were performed with smooth STm D23580 wild-type (WT) and an isogenic PgtE-deficient mutant (ΔpgtE). Strains were cultured overnight (A) in LB or (B, C) in InSPI2 LowMg2+ minimal media. STm at 106 CFU/mL was then incubated with (A, B) 20% normal human serum (NHS) or (C) 20% C3-depleted human serum at 37 °C shaking at 300 rpm. CFUs were enumerated at 0 minutes, 45 minutes, and 90 minutes. % survival = (CFU at 45 minutes or 90 minutes / CFU at 0 minutes)*100%. (A, C) n = 2–3, (B) n = 6. Bar and error represent geometric mean and standard deviation. Data were analyzed by 2-way ANOVA followed by Sidak multiple comparison test. Adjusted p values from Sidak multiple comparison test: * p < 0.05. (D, E) D23580 WT and ΔpgtE were cultured overnight in (Left) LB or (Right) InSPI2 LowMg2+ minimal media. (D) After overnight culture, STm was lysed, supernatants were run on a 4–12% Tris-Glycine gel, and the gel was stained with Pro-Q Emerald 300 Lipopolysaccharide Gel Stain Kit to assess O-antigen chain length. (E) Alternatively, STm was then incubated with NHS for 8 hours. PgtE-dependent complement cleavage in supernatants was assessed by western blot analysis with anti-complement C3/C3b/iC3b/C3d antibody.
Figure 5.
Figure 5.. PgtE enhances STm survival in neutrophil killing assays and reduces complement-mediated neutrophil ROS response.
Neutrophils were isolated (Stem Cell EasySep kit) from bone marrow of (A-E) C57BL/6 mice and (E) Cybb-deficient mice. For neutrophil killing assays, smooth STm IR715 wild-type (WT) and an isogenic PgtE-deficient (ΔpgtE) strain were cultured overnight in (A) LB or (B-C, E) InSPI2 LowMg2+ minimal media. STm was then (A-B: Left) not opsonized or (A-B: Right, E) opsonized with normal mouse serum (NMS). (C) Alternatively, STm was opsonized with serum from C3+/+ and C3−/− littermates. (A-C, E) Neutrophils were then infected at an MOI = 10. STm CFU was enumerated 2.5 hours post-infection. % Survival in neutrophils = (CFU in wells with neutrophils at 2.5 hours/ CFU in control wells at 2.5 hours)*100%. (D) To determine neutrophil reactive oxygen species production, luminol assays were performed with STm cultured overnight in (Left) LB or (Right) InSPI2 LowMg2+ minimal media then opsonized with serum from (Top) C3+/+ and (Bottom) C3−/− littermates. Neutrophils were infected at an MOI = 10. Relative Light Unit reads were performed every 2 minutes with a BioTek Synergy HTX. Error bars represent mean + SD from 3 biological replicates from 1 of 3 representative experiments. (F-I) 8-week-old CybbX/X females or CybbX/Y hemizygous males were infected IP with 104 CFU WT and ΔpgtE STm. Mice were euthanized 24 hours after infection and bacterial burden in the (G) blood, (H) liver, and (I) spleen was assessed. (A-C, E) N = 5–10 from 3–4 independent experiments. Symbols represent data with neutrophils from individual mice, bars represent the means. (A-C, E) Data were analyzed by One-way ANOVA Kruskal-Wallis test followed by Dunn’s comparison test. Adjusted p values from Dunn’s multiple comparison test: * p < 0.05, ** p < 0.01. (D) Data was analyzed by 2-way ANOVA. Time × Column Factor: **** p < 0.0001. (D) bar and error represent mean + SD. (G-I) Symbols represent data from individual mice, bars represent the geometric means. (G) Dotted line represents the limit of detection. (G-I) N = 7–8 from 2 independent experiments.

References

    1. Majowicz SE, Musto J, Scallan E, Angulo FJ, Kirk M, O’Brien SJ, Jones TF, Fazil A, Hoekstra RM, International Collaboration on Enteric Disease “Burden of Illness” Studies. 2010. The global burden of nontyphoidal Salmonella gastroenteritis. Clin Infect Dis 50:882–889. - PubMed
    1. Hohmann EL. 2001. Nontyphoidal salmonellosis. Clin Infect Dis 32:263–269. - PubMed
    1. Santos RL, Raffatellu M, Bevins CL, Adams LG, Tükel C, Tsolis RM, Bäumler AJ. 2009. Life in the inflamed intestine, Salmonella style. Trends Microbiol 17:498–506. - PMC - PubMed
    1. Turgeon P, Ng V, Murray R, Nesbitt A. 2018. Forecasting the incidence of salmonellosis in seniors in Canada: A trend analysis and the potential impact of the demographic shift. PLoS One 13:e0208124. - PMC - PubMed
    1. Lester A, Eriksen NH, Nielsen H, Nielsen PB, Friis-Møller A, Bruun B, Scheibel J, Gaarslev K, Kolmos HJ. 1991. Non-typhoid Salmonella bacteraemia in Greater Copenhagen 1984 to 1988. Eur J Clin Microbiol Infect Dis 10:486–490. - PubMed

Publication types

LinkOut - more resources