[Preprint]. 2024 Nov 8:2024.11.07.622520.
doi: 10.1101/2024.11.07.622520.

Systematic review and meta-analysis of bulk RNAseq studies in human Alzheimer's disease brain tissue

Affiliations

Systematic review and meta-analysis of bulk RNAseq studies in human Alzheimer's disease brain tissue

Bernardo Aguzzoli Heberle et al. bioRxiv. .

Update in

Abstract

Objective: To systematically review and meta-analyze bulk RNA sequencing studies comparing Alzheimer's disease (AD) patients with controls in human brain tissue, assessing study quality and identifying key genes and pathways.

Methods: We searched PubMed, Web of Science, and Scopus on September 23, 2023, for studies using bulk RNAseq on primary human brain tissue from AD patients and controls. Excluded were non-primary tissue, re-analyses without new data, limited RNA types and gene panels. Quality was assessed with a 10-category tool. Meta-analysis used high-quality datasets.

Results: From 3,266 records, 24 studies met criteria. Meta-analysis found 571 differentially expressed genes (DEGs) in temporal lobe and 189 in frontal lobe; overlapping pathways included "Tube morphogenesis" and "Neuroactive ligand-receptor interaction."

Limitations: Study heterogeneity and limited data tables constrained the review.

Conclusions: Rigorous methods are vital in AD transcriptomic studies. Findings enhance understanding of transcriptomic changes, aiding biomarker and therapeutic development.

Registration: PROSPERO (CRD42023466522).

Keywords: Alzheimer’s disease (AD); RNA sequencing (RNAseq); differentially expressed genes (DEGs); human brain tissue; meta-analysis; systematic review.


Conflict of interest statement

Competing interests Statement: The authors report no competing interests.

Figures
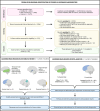
Figure 1:
Figure 1:. PRISMA flow diagram and study design.
Diagram illustrating the process to identify studies that met inclusion criteria. The diagram also shows the assessed brain regions in the systematic review and the corresponding number of studies for each region. The total number of studies across all brain regions exceeds the total number of included studies (n = 24) because some studies evaluated multiple brain regions. **Only three datasets from one study were included in the meta-analysis for the following reasons: (1) the study had a significantly larger sample size compared to others; (2) it received the highest quality assessment score, reducing the risk of bias; and (3) only five of the remaining 23 studies provided a differential expression table suitable for meta-analysis, all of which had relatively small sample sizes (n < 50) or significant methodological issues, such as poorly defined AD status.
Figure 2:
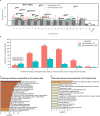
Figure 2:. Meta-analysis for AD temporal lobe differential gene expression.
a, Differential gene expression results for the AD temporal lobe meta-analysis (n = 319; 180 AD and 139 controls). The Manhattan plot shows - log10(p-value) on the y-axis and chromosome coordinates on the x-axis. The dotted line represents the Bonferroni corrected p-value threshold of 0.1 (equivalent to an unadjusted p-value of 3.39 × 10⁻6). Genes were considered significantly differentially expressed between AD subjects and controls if the Bonferroni corrected p-value was less than to 0.1. Statistics were derived from the Inverse-Variance Weighted Fixed-Effect Model from METAL. Red dots indicate genes upregulated in AD, while blue dots indicate genes downregulated in AD. Selected differentially expressed genes are highlighted with their gene symbols for interest. b, Number of temporal lobe meta-analysis DEGs overlapping with other studies. The y-axis represents the number of overlapping DEGs, while the x-axis indicates how many of the eight temporal lobe studies each DEG overlapped with. A value of "0" on the x-axis corresponds to DEGs that are unique to this meta-analysis. More detailed information about DEG overlap for temporal lobe can be found in Supplementary Table 8. c, Metascape pathway convergence analysis for genes upregulated in the AD temporal lobe. Pathways are listed on the y-axis, with -log10(p-value) on the x-axis. d, Metascape pathway convergence analysis for genes downregulated in the AD temporal lobe. Pathways are listed on the y-axis, with −log10(p-value) on the x-axis.
Figure 3:
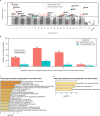
Figure 3:. Meta-analysis for AD frontal lobe differential gene expression.
a, Differential gene expression results for the AD frontal lobe meta-analysis (n = 599; 327 AD and 272 controls). The Manhattan plot shows − log10(p-value) on the y-axis and chromosome coordinates on the x-axis. The dotted line represents the Bonferroni corrected p-value threshold of 0.1 (equivalent to a unadjusted p-value of 3.19 × 10⁻6.). Genes were considered significantly differentially expressed between AD subjects and controls if the Bonferroni corrected p-value was less than 0.1. Statistics were derived from the Inverse-Variance Weighted Fixed-Effect Model from METAL. Red dots indicate genes upregulated in AD, while blue dots indicate genes downregulated in AD. Selected differentially expressed genes are highlighted with their gene symbols. b, Number of frontal lobe meta-analysis DEGs overlapping with other studies. The y- axis represents the number of overlapping DEGs, while the x-axis indicates how many of the three frontal lobe studies each DEG overlapped with. A value of "0" on the x-axis corresponds to DEGs that are unique to this meta-analysis. c, Metascape pathway convergence analysis for genes upregulated in the AD frontal lobe. Pathways are listed on the y-axis, with −log10(p-value) on the x-axis. d, Metascape pathway convergence analysis for genes downregulated in the AD frontal lobe. Pathways are listed on the y-axis, with −log10(p-value) on the x-axis.

References

    1. 2023. Alzheimer’s disease facts and figures - 2023 - Alzheimer’s & Dementia - Wiley Online Library. https://alz-journals.onlinelibrary.wiley.com/doi/10.1002/alz.13016. - DOI - PubMed
    1. GBD 2019 Dementia Forecasting Collaborators. Estimation of the global prevalence of dementia in 2019 and forecasted prevalence in 2050: an analysis for the Global Burden of Disease Study 2019. Lancet Public Health 7, e105–e125 (2022). - PMC - PubMed
    1. Dementia. https://www.who.int/news-room/fact-sheets/detail/dementia.
    1. Rajan K. B. et al. Population estimate of people with clinical Alzheimer’s disease and mild cognitive impairment in the United States (2020–2060). Alzheimers Dement. J. Alzheimers Assoc. 17, 1966–1975 (2021). - PMC - PubMed
    1. Weller J. & Budson A. Current understanding of Alzheimer’s disease diagnosis and treatment. F1000Research 7, F1000 Faculty Rev-1161 (2018). - PMC - PubMed

Publication types

LinkOut - more resources