[Preprint]. 2024 Nov 4:2024.10.30.621013.
doi: 10.1101/2024.10.30.621013.

MethylGPT: a foundation model for the DNA methylome

Affiliations

MethylGPT: a foundation model for the DNA methylome

Kejun Ying et al. bioRxiv. .

Abstract

DNA methylation serves as a powerful biomarker for disease diagnosis and biological age assessment. However, current analytical approaches often rely on linear models that cannot capture the complex, context-dependent nature of methylation regulation. Here we present MethylGPT, a transformer-based foundation model trained on 226,555 (154,063 after QC and deduplication) human methylation profiles spanning diverse tissue types from 5,281 datasets, curated 49,156 CpG sites, and 7.6 billion training tokens. MethylGPT learns biologically meaningful representations of CpG sites, capturing both local genomic context and higher-order chromosomal features without external supervision. The model demonstrates robust methylation value prediction (Pearson R=0.929) and maintains stable performance in downstream tasks with up to 70% missing data. Applied to age prediction across multiple tissue types, MethylGPT achieves superior accuracy compared to existing methods. Analysis of the model's attention patterns reveals distinct methylation signatures between young and old samples, with differential enrichment of developmental and aging-associated pathways. When finetuned to mortality and disease prediction across 60 major conditions using 18,859 samples from Generation Scotland, MethylGPT achieves robust predictive performance and enables systematic evaluation of intervention effects on disease risks, demonstrating potential for clinical applications. Our results demonstrate that transformer architectures can effectively model DNA methylation patterns while preserving biological interpretability, suggesting broad utility for epigenetic analysis and clinical applications.


Figures
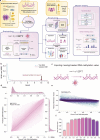
Figure 1.
Figure 1.. Overview of MethylGPT architecture and performance.
a. Model architecture diagram showing data flow from 154,063 human DNAm samples through feature extraction (49,156 CpG sites) to generate 7.6 billion training tokens. Components, including transformer block details and the methyl embedding process, are highlighted. b. Training curve showing MLM loss over epochs, with train and validation MSE trajectories converging at epoch 10 (Best Model Test MSE: 0.014). c. Illustration of the imputing process for missing/masked DNA methylation values using MethylGPT. d. Joint density plot showing the correlation between predicted and ground truth DNA methylation values (Pearson R: 0.929, MAE: 0.074). e. Residual plot showing prediction errors across different methylation levels. f. Bar plot showing mean absolute error across different methylation levels (0.0–1.0).
Figure 2.
Figure 2.. Analysis of contextualized CpG embedding space.
a. Schematic illustration of the CpG embedding process, showing the transformation from raw CpG input to contextualized embeddings through transformer blocks. b. UMAP visualization of 49K CpG sites colored by CpG island relationship (Island, Shore, Shelf, Other). c. UMAP plot highlighting enhancer regions (Yes/No) in the embedding space. d. UMAP visualization showing the separation of CpG sites by chromosomal location, with distinct clustering of sex chromosomes and autosomes.
Figure 3.
Figure 3.. Sample-level embedding analysis.
a. UMAP visualization of MethylGPT sample embeddings colored by tissue type, showing distinct clustering of major tissue types including whole blood, brain, liver, and skin. b. Sample density plot of the embedding space highlighting minimal batch effects. c. Sex-specific clustering in the embedding space, displaying a clear separation between male and female samples. d-f. Comparative analysis of raw DNA methylation sample embeddings, showing less distinct clustering by tissue type (d), more pronounced batch effects (e), and weaker separation by sex (f).
Figure 4.
Figure 4.. Age prediction performance and robustness analysis.
a. Sample composition pie chart showing tissue distribution within the age finetuning dataset (n=11,453) and age distribution density plot. b. PCA visualization of sample embeddings before fine-tuning, colored by age. c. Sample embeddings after fine-tuning for age prediction, showing enhanced age-related organization. d. Tissue-specific clustering was maintained after fine-tuning. e. Benchmark comparison of age prediction performance across different methods on validation and test datasets. Median Absolute Errors are annotated. f. Robustness analysis showing prediction performance under increasing levels of missing data (10–90%) on test dataset for different methods. g. Principal component analysis of MethylGPT embeddings during iPSC reprogramming, colored by predicted age, showing progressive trajectory towards younger methylation states. h. Comparison of predicted age trajectories during iPSC reprogramming across different epigenetic clocks (GrimAge, Horvath’s clock) and MethylGPT, demonstrating consistent detection of rejuvenation effects. Error bars represent standard deviation across replicate samples.
Figure 5.
Figure 5.. Age-specific attention mechanism analysis.
a. Schematic comparison of attention patterns between young and old samples, showing differential CpG site interactions. b. Attention score matrices across three age groups (<20, 20–60, >60 years), revealing age-specific patterns. c. Volcano plot of log p-values versus differential mean attention scores identifies a few influential CpG sites distinguishing the attention pattern of young and old groups. d. Heatmap of top young-important (left) and old-important (right) CpG sites, annotated with associated genes and EWAS traits, demonstrating age-specific methylation signatures. e. Functional enrichment analysis of top young-important (left) and old-important (right) CpG sites, with bars colored according to −log p-values.
Figure 6.
Figure 6.. Disease risk prediction and intervention effects using MethylGPT.
a. Schematic overview of the disease prediction pipeline using Generation Scotland cohort (n = 18,859). The pretrained MethylGPT model processes methylation profiles through ResNet blocks to predict age, mortality, and disease risks, which can then be applied to evaluate clinical interventions. b. Visualization of 60 major diseases organized into disease categories (Liver and Digestive System Diseases, Respiratory Diseases, Neurological Diseases, Autoimmune Diseases, Cardiovascular Diseases, Cancers, Kidney Diseases, and Endocrine and Metabolic Diseases). c. Receiver Operating Characteristic (ROC) curves showing the overall performance of MethylGPT disease prediction model (seven disease classes and overall mortality) on validation (AUC = 0.736) and test (AUC = 0.720) sets. d. Heatmap showing predicted effects (β values) of eight different interventions on disease risks across major disease categories (total n=183): Mediterranean fiber (n=36), high-intensity training (n=5), folate supplementation (n=43), anti-TNF therapy (n=59), smoking cessation (n=16), glyNAC (n=8), everolimus (n=8), and metformin (n=8). Each intervention included an intra-group control as part of the trial design. For phased interventions, only the longest duration timepoint was analyzed. Color scale represents effect size, with purple indicating positive effects (risk reduction) and green indicating negative effects (risk increase). Black box highlights significant effects. Values represent effect size from the Cohen’s d.

References

    1. Jones P. A. Functions of DNA methylation: islands, start sites, gene bodies and beyond. Nat. Rev. Genet. 13, 484–492 (2012). - PubMed
    1. Weigert R. et al. Dynamic antagonism between key repressive pathways maintains the placental epigenome. Nat. Cell Biol. 25, 579–591 (2023). - PMC - PubMed
    1. Deniz Ö., Frost J. M. & Branco M. R. Regulation of transposable elements by DNA modifications. Nat. Rev. Genet. 20, 417–431 (2019). - PubMed
    1. Levenson V. V. DNA methylation as a universal biomarker. Expert Rev. Mol. Diagn. 10, 481 (2010). - PMC - PubMed
    1. Cappozzo A. et al. A blood DNA methylation biomarker for predicting short-term risk of cardiovascular events. Clin. Epigenetics 14, 121 (2022). - PMC - PubMed

Publication types

LinkOut - more resources