[Preprint]. 2024 Nov 7:2024.11.06.622325.
doi: 10.1101/2024.11.06.622325.

TIA1 Mediates Divergent Inflammatory Responses to Tauopathy in Microglia and Macrophages

Affiliations

TIA1 Mediates Divergent Inflammatory Responses to Tauopathy in Microglia and Macrophages

Chelsea J Webber et al. bioRxiv. .

Abstract

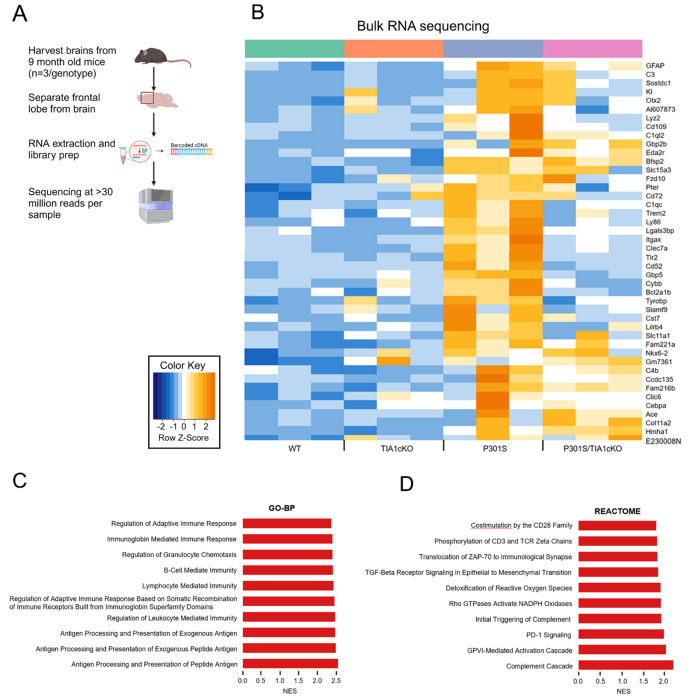
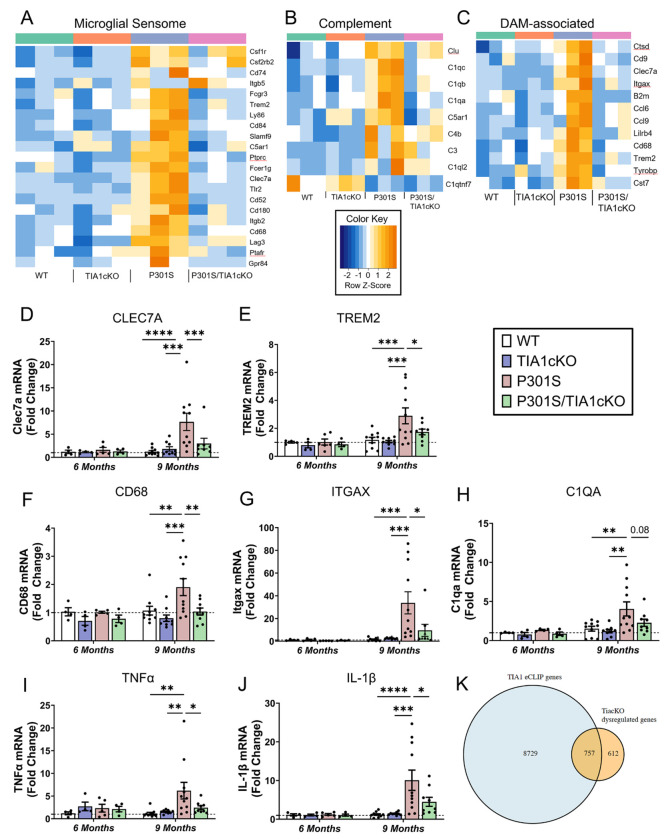
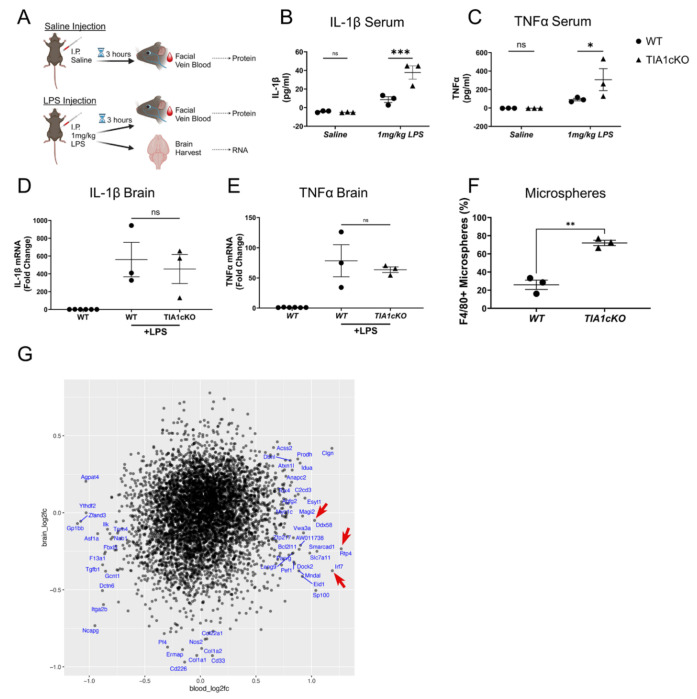
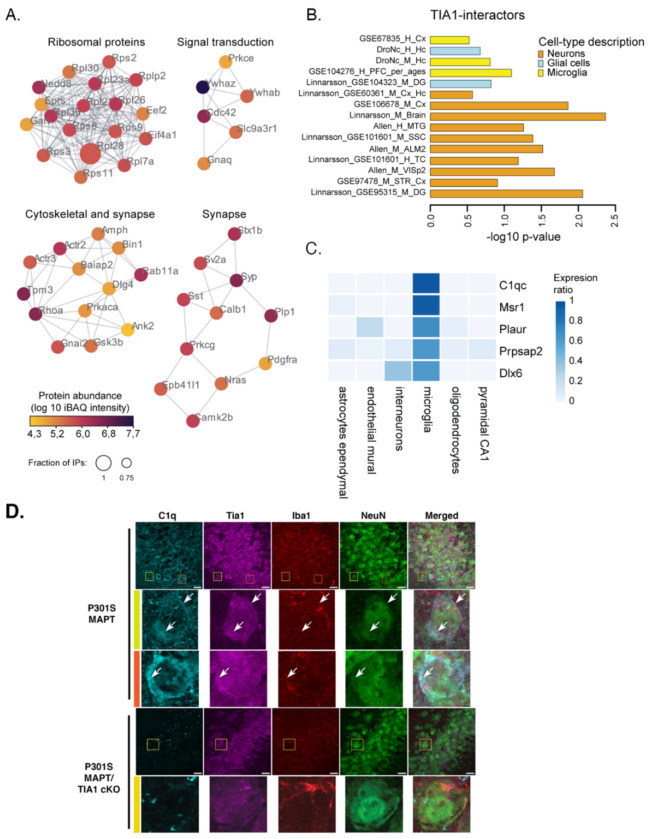
The RNA binding protein TIA1 is known to regulate stress responses. Here we show that TIA1 plays a much broader role in inflammatory cells, being required for the microglial sensome. We crossed TIA1 cKO mice (using a CX3CR1 driven cre element) to PS19 MAPT P301S tauopathy mice. The peripheral macrophages of TIA1 cKO mice exhibited a hyper-inflammatory phenotype with increased cytokine signaling, as expected. Surprisingly, the brains of these mice showed striking reductions in inflammation, including decreases in microglial inflammatory cytokines (TNFα and IL-1β) and sensome markers (CLEC7A, TREM2, ITGAX); these reductions were accompanied by corresponding decreases in tau pathology. Analysis of the brain TIA1 protein interactome identified brain selective TIA1 protein mediated pathways, including strong interactions with the microglial protein C1q, which directs pruning of dystrophic neurons. These results uncover a previously unknown regulatory role for TIA1 in microglial activation in the context of neurodegenerative disease and highlights the divergent regulation of two mononuclear phagocytic lineages: microglia and macrophages.


Conflict of interest statement

Competing interests B.W. is co-founder and Chief Scientific Officer for Aquinnah Pharmaceuticals Inc.

Figures

Figure 1.
Figure 1.. Conditional TIA1 knockout in P301S mice alters transcriptional increases of tau-specific genes.
A) Breeding scheme for microglial-specific knockout of TIA1 in P301S mice. B) Schematic depicting microglia isolation using CD11b+ magnetic beads from mouse brain. C) rt-qPCR for microglial marker SIGLEC-H in CD11b+ fraction and non-microglial flow-through. D) rt-qPCR for TIA1 in microglia, N=4/genotype. One-way ANOVA (F(3,12)= 797.8, P<0.0001, followed by Tukey’s multiple comparisons with *p<0.05, **p<0.01, ***p<0.001, ****p<0.0001 Created with BioRender.com
Figure 2.
Figure 2.. Upregulated pathways in P301S mice compared to WT.
A) Bulk RNA-sequencing protocol. B) Unbiased heatmap of genes significantly upregulated in 9-month-old P301S mice compared to WT, N=3/genotype. Genes previously linked to the pathophysiology of ADRD are presented in bold orange font. C) Top 10 Gene Ontology-Biological Processes (GO-BP) pathways upregulated in P301S mice with normalized enrichment (NES) score>2. D) Top 10 Reactome pathways upregulated in P301S mice with normalized enrichment score >1.5.
Figure 3.
Figure 3.. Microglial sensome response not activated in P301S/TIA1cKO mice.
Heatmap depicting A) 23 microglial sensome genes, B) 12 DAM-associated genes that are significantly upregulated in P301S mice compared to WT mice, and C) 7 complement system genes, N=3/genotype. rt-qPCR amplification of D) CLEC7A (Two-way ANOVA (age F(1,46)= 5.63, p=0.022; genotype F(3,46)= 3.4, p=0.025, followed by Tukey’s Multiple comparisons) , E) TREM2 (Two-way ANOVA (age F (1, 49) = 8.362, p=0.0057 ; genotype (F (3, 49) = 3.116, p=0.0345), followed by Tukey’s Multiple comparisons), F) CD68 (Two-way ANOVA (genotype F (3, 48) = 3.703, P=0.0178), followed by Tukey’s Multiple comparisons, G) ITGAX (9-months, P301S vs. WT Mann Whitney U=1, p <0.0001; P301S vs. cTIA1KO Mann Whitney U= 1, p<0.0001; P301S/TIA1cKO vs. P301S Mann Whitney U= 14, p<0.0121), H) C1QA (Two-way ANOVA (age F (1, 47) = 7.129, p=0.0104), followed by Tukey’s Multiple comparisons), I) TNFα (9-months, P301S vs. WT Mann Whitney U=7, p =0.0003; P301S vs. cTIA1KO Mann Whitney U= 13, p=0.0042; P301S/TIA1cKO vs. P301S Mann Whitney U= 27, p=0.095), J) IL-1β (Two-way ANOVA (interaction F (3, 48) = 2.954, p=0.04), followed by Tukey’s Multiple comparisons) in WT, TIA1cKO, P301S, and PS301S/TIA1cKO mice at 6 months (N=4-5 mice/genotype) and 9 months (N=9-11 mice/genotype). Certain values were omitted as outliers based upon 0.1% ROUT. ITGAX omitted: P301S/TIA1cKO 57.1-fold change. CLEC7A omitted: P301S 56.0-fold change and P301S/TIA1cKO 64.0-fold change. K) Overlap between TIA1 eCLIP ENCODE hits and Tia1cKO dysregulated transcripts in the 9m P301S mice. Tukey’s multiple comparisons or Mann Whitney U p-values are shown: *p<0.05, **p<0.01, ***p<0.001, ****p<0.0001
Figure 4.
Figure 4.. Microglia in P301S/TIA1cKO mice are not activated.
A) Representative images of 3D reconstructed microglia area in 9-month old WT, TIA1cKO, P301S, P301S/TIA1cKO mice. Cell complexity measures B) mean radius (one-way ANOVA (F(3,105)=9.4, p<0.0001), C) diameter bounding circle (one-way ANOVA (F(3,105)=7.48, p<0.0001), D) convex hull area (one-way ANOVA (F(3,105)=8.08, p<0.0001), E) convex hull perimeter (one-way ANOVA (F(3,105)=4.41, p<0.0001), and F) maximum span across convex hull (one-way ANOVA (F(3,105)=6.84, p=0.0003) in WT, TIA1cKO, P301S, and P301S/TIA1cKO; N=25-30 microglia/mouse, N=5-6 mice/genotype. G) Frontal lobe was stained for DAPI, Iba1 (488), and CD68 (647) in 9-month WT, TIA1cKO, P301S, P301S/TIA1cKO mice. H) Activated microglia were quantitated as CD68+ count normalized to percent Iba1 area and fold change calculated (one-way ANOVA (F(3,44)=20.56, p<0.0001); N=2 images/mouse, N=6 mice/genotype. 10μm scale bars. All ANOVA tests were followed by Tukey’s multiple comparisons showns as: *p<0.05, **p<0.01, ***p<0.001, ****p<0.0001
Figure 5.
Figure 5.. Monocyte and microglia responses to LPS stimulation and tau pathology.
A) Experimental design: Blood collected from facial vein 3 hours post saline injection and post 1mg/kg LPS intraperitoneal (I.P.) injection (from the same mice), brain collected after LPS. B) IL-1β and C) TNFα serum protein amount for aged WT and TIA1cKO mice after saline or LPS injection, N=3 mice/genotype. D) IL-β and E) TNFα mRNA expression in the brain after saline or LPS injection in WT and TIA1cKO mice compared to non-LPS WT mice, N=3 mice/genotype. F) FACS data of fluorescent bead labeled peripheral macrophages (two-sample t-test (t(4)=7.78, p=0.0015)). G) Comparison of effects of TIA1 cKO on transcripts in blood and brain. The axes represent the log 2-fold change of P301S/TIA1 cKO vs. P301S tau mice for blood vs brain transcriptomes. Red arrows point to lead genes exhibiting greater differential expression in blood than brain. *p<0.05, **p<0.01, ***p<0.001, ****p<0.0001 Created with BioRender.com.
Figure 6.
Figure 6.. TIA1 molecular interactions.
A) TIA1 IP-MS (from WT vs. Tia1−/− mouse brain) revealed co-purification of 108 high-confidence TIA1-interactors. The TIA1 interactome was matched against the STRING database for known physical interactions and functional associations, and clustered into highly interconnected regions using MCODE. Only proteins detected in >=75% of wildtype IPs with an abundance >10x relative to Tia1−/− were considered high-confidence interactors (WT: n= 4, Tia1−/−: n=3, mice were 9-months old). B) Expression weighted cell-type enrichment analysis (EWCE) using 15 datasets from publicly available human and mouse cortical tissues revealed neuronal and microglial protein signatures. C) The top 5 highest expressed proteins in microglia are part of the TIA1-interactome. Expression is based on mouse cortex scRNA-seq . D) Imaging of C1qa and Tia1 labeling in the CA3 region of the hippocampus. Colocalization of C1q and Tia1 is evident in the high magnification images in rows 2 & 3 (arrows); these images occur in NeuN positive cells indicative of neurons. Scale bar: 10 μm.
Figure 7.
Figure 7.. Tau pathology reduced in P301S/TIA1cKO mice.
A) CA3 region D) CA1 region of 9-month-old hippocampi from P301S and P301S/TIA1cKO mice stained for NeuN (405 nm) labelling neurons, Thiazine Red (594 nm) labelling fibrillar tau, and MC1 (488 nm) labelling misfolded pathological tau. Quantification of MC1 intensity normalized to NeuN area in 6-month and 9-month-old P301S and P301S/TIA1cKO in B) CA3 (two-way ANOVA (age (F(1,28)=66.21, p<0.0001); genotype (F(1,28)=4.56, p=0.042) and E) CA1(two-way ANOVA (interaction F(1,28)=8.92, p=0.0058) regions, N=7-9 mice/genotype. Quantification of Thiazine Red are in 9-month-old P301S and P301S/TIA1cKO in C) CA3 (Mann Whitney U= 4, p=0.0005) and F) CA1 (Mann Whitney U= 15.5, p=0.016) regions. N=2 images/mouse, 6-month N=3, 9-month N=4-6 mice/genotype G) Staining of NeuN (405 nm) neurons and AT8 (488 nm) phosphorylated tau in the entorhinal cortex of 9-month-old P301S and P301S/TIA1cKO mice. N=2 images/mouse, N=6 mice/genotype H) Quantification of AT8 intensity normalized to NeuN area (two-sample t-test, t(22)=3.4, p=0.0024). I – L) Semi-nondenaturing blots with quantification of integrated lane density for S1p oligomeric tau (I, J) and P3 fibrillar tau (K, L) in 9-month-old P301S and P301S/TIA1cKO mice. N=3. 20μm scale bars; inset 10μm scale bars. *p<0.05, **p<0.01, ***p<0.001, ****p<0.0001

References

    1. Rayman J.B. & Kandel E.R. TIA-1 Is a Functional Prion-Like Protein. Cold Spring Harb Perspect Biol 9(2017). - PMC - PubMed
    1. Meyer C, et al. The TIA1 RNA-Binding Protein Family Regulates EIF2AK2-Mediated Stress Response and Cell Cycle Progression. Mol Cell 69, 622–635.e626 (2018). - PMC - PubMed
    1. Anderson P., et al. A monoclonal antibody reactive with a 15-kDa cytoplasmic granule-associated protein defines a subpopulation of CD8+ T lymphocytes. J Immunol 144, 574–582 (1990). - PubMed
    1. Phillips K., Kedersha N., Shen L., Blackshear P.J. & Anderson P. Arthritis suppressor genes TIA-1 and TTP dampen the expression of tumor necrosis factor alpha, cyclooxygenase 2, and inflammatory arthritis. Proc Natl Acad Sci U S A 101, 2011–2016 (2004). - PMC - PubMed
    1. Gilks N., et al. Stress granule assembly is mediated by prion-like aggregation of TIA-1. Mol Biol Cell 15, 5383–5398 (2004). - PMC - PubMed

Publication types