[Preprint]. 2024 Nov 5:2024.11.05.622179.
doi: 10.1101/2024.11.05.622179.

Selective Enhancement of the Interneuron Network and Gamma-Band Power via GluN2C/GluN2D NMDA Receptor Potentiation

Affiliations

Selective Enhancement of the Interneuron Network and Gamma-Band Power via GluN2C/GluN2D NMDA Receptor Potentiation

Chad R Camp et al. bioRxiv. .

Update in

Abstract

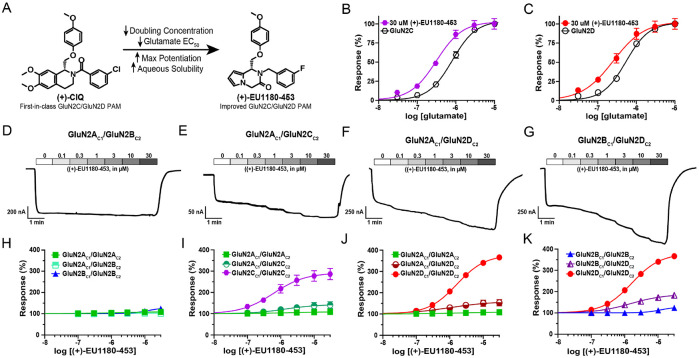
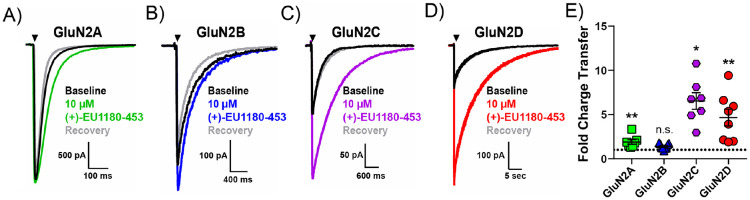
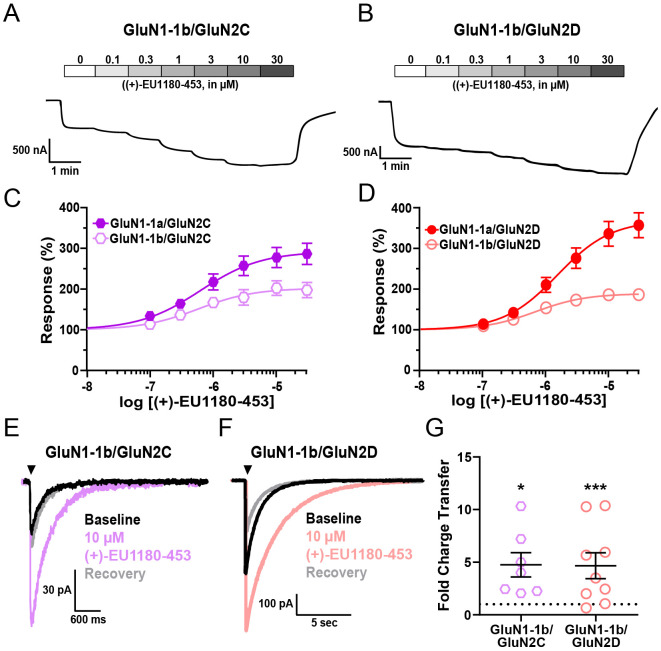
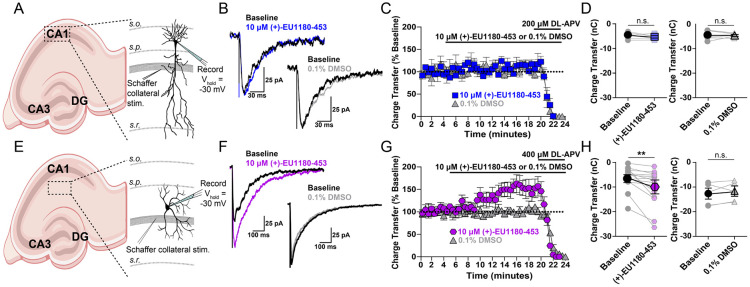
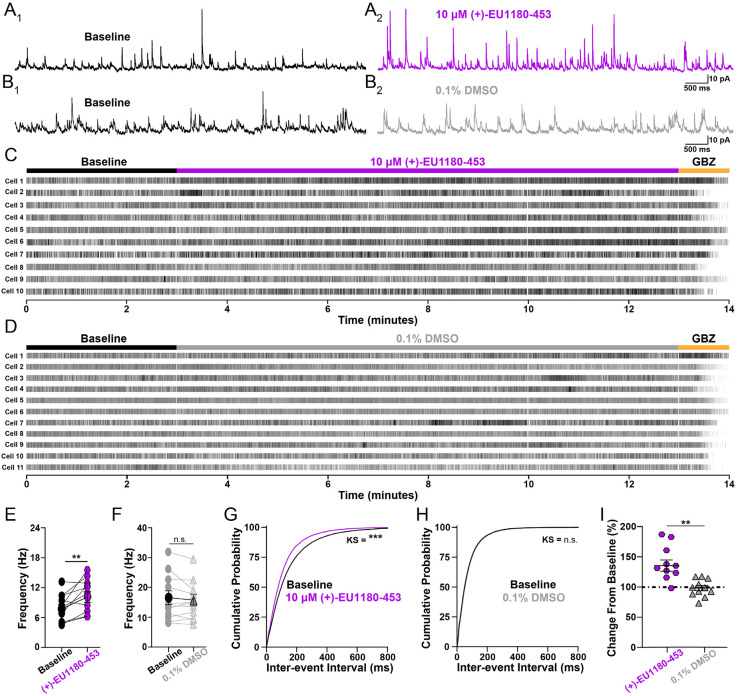
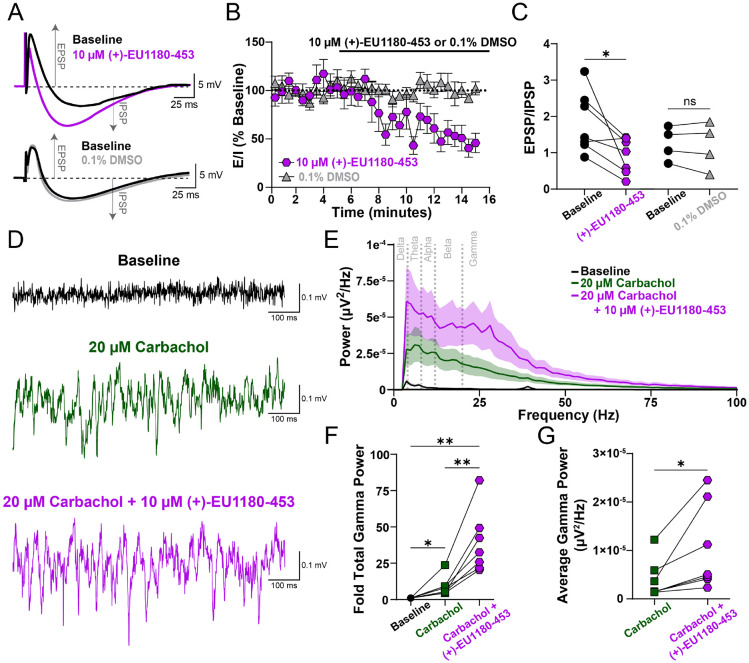
N-methyl-D-aspartate receptors (NMDARs) comprise a family of ligand-gated ionotropic glutamate receptors that mediate a slow, calcium-permeable component to excitatory neurotransmission. The GluN2D subunit is enriched in GABAergic inhibitory interneurons in cortical tissue. Diminished levels of GABAergic inhibition contribute to multiple neuropsychiatric conditions, suggesting that enhancing inhibition may have therapeutic utility, thus making GluN2D modulation an attractive drug target. Here, we describe the actions of a GluN2C/GluN2D-selective positive allosteric modulator (PAM), (+)-EU1180-453, which has improved drug-like properties such as increased aqueous solubility compared to the first-in-class GluN2C/GluN2D-selective prototypical PAM (+)-CIQ. (+)-EU1180-453 doubles the NMDAR response at lower concentrations (< 10 μM) compared to (+)-CIQ, and produces a greater degree of maximal potentiation at 30 μM. Using in vitro electrophysiological recordings, we show that (+)-EU1180-453 potentiates triheteromeric NMDARs containing at least one GluN2C or GluN2D subunit, and is active at both exon5-lacking and exon5-containing GluN1 splice variants. (+)-EU1180-453 increases glutamate efficacy for GluN2C/GluN2D-containing NMDARs by both prolonging the deactivation time and potentiating the peak response amplitude. We show that (+)-EU1180-453 selectively increases synaptic NMDAR-mediated charge transfer onto P11-15 CA1 stratum radiatum hippocampal interneurons, but is without effect on CA1 pyramidal cells. This increased charge transfer enhances inhibitory output from GABAergic interneurons onto CA1 pyramidal cells in a GluN2D-dependent manner. (+)-EU1180-453 also shifts excitatory-to-inhibitory coupling towards increased inhibition and produces enhanced gamma band power from carbachol-induced field potential oscillations in hippocampal slices. Thus, (+)-EU1180-453 can enhance overall circuit inhibition, which could prove therapeutically useful for the treatment of anxiety, depression, schizophrenia, and other neuropsychiatric disorders.

Significance statement: Interneuron dysfunction and diminished GABAergic inhibition in neocortical and hippocampal circuits remains a prominent molecular hypothesis for neuropsychiatric diseases including anxiety, depression, and schizophrenia. Pharmacological agents that boost GABA receptor function have shown utility in various forms of depression and treating symptoms of schizophrenia. Cortical GABAergic interneurons, unlike their excitatory pyramidal cell counterparts, are enriched for the GluN2D subunit of the NMDA receptor. Thus, GluN2D subunit-selective modulation could be a useful therapeutic tool to enhance local inhibition, improving the prognosis for neuropsychiatric diseases for which interneuron dysfunction is prominent and causal to circuit aberration.


Conflict of interest statement

Conflict of interest: D.C.L., H.Y., M.P.E., N.S.A., and S.F.T. are co-inventors of Emory-owned intellectual property. S.F.T. is a member of the SAB for Sage Therapeutics, Eumentis Therapeutics, Neurocrine, the GRIN2B Foundation, the CureGRIN Foundation, and CombinedBrain. S.F.T. is a consultant for GRIN Therapeutics. H.Y. is the PI on a research grant from Sage Therapeutics and GRIN Therapeutics to Emory. S.F.T. is PI on a research grant from GRIN Therapeutics to Emory. S.F.T. is cofounder of NeurOp, Inc. and Agrithera. D.C.L. and S.F.T. are on the Board of Directors for NeurOp. T.A.B. is a member of the SAB for GRIN2B Foundation, CureGRIN Foundation and GRIN Therapeutics; all remuneration has been made to his department.

Figures

Figure 1.
Figure 1.
(+)-EU1180-453 potentiates response of GluN2C- and GluN2D-containing triheteromeric NMDARs expressed in Xenopus oocytes. A) Chemical structure of (+)-CIQ and (+)-EU1180-453. Response of B) GluN2C-containing NMDARs and C) GluN2D-containing NMDARs to varying concentrations of glutamate in presence of 30 μM glycine and 30 μM (+)-EU1180-453. Representative current responses of D) GluN2AC1/GluN2BC2, E) GluN2AC1/GluN2CC2, F) GluN2AC1/GluN2DC2, and G) GluN2BC1/GluN2DC2 triheteromeric NMDARs to varying concentrations of (+)-EU1180-453 in presence of saturating concentrations of glutamate (100 μM) and glycine (30 μM). Fitted concentration-response curves of H) GluN2AC1/GluN2BC2, I) GluN2AC1/GluN2CC2, J) GluN2AC1/GluN2DC2, and K) GluN2BC1/GluN2DC2 triheteromeric NMDARs to varying concentrations of (+)-EU1180-453 in presence of 30 μM glycine and 100 μM glutamate. Diheteromeric NMDARs with corresponding C1- and C2-tails were included as reference. Maximum potentiation of percent response (amplitude with saturating glycine and glutamate only) was H) 103 ± 2.2% of control for GluN2AC1/GluN2BC2, I) 141 ± 13% of control for GluN2AC1/GluN2CC2, J) 153 ± 16% of control for GluN2AC1/GluN2DC2, and K) 183 ± 5.6% of control for GluN2BC1/GluN2DC2. All data are mean ± SEM. Number of oocytes for each receptor type ranged from N=10-18, from 2-3 frogs.
Figure 2.
Figure 2.
(+)-EU1180-453 strongly potentiates GluN2C- and GluN2D-containing NMDAR current responses recorded from HEK293T cells. Cells were held at −70 mV and subjected to rapid and brief (10 ms) application of saturating glutamate (1 mM) in the presence of 100 μM glycine. Current responses were recorded in absence, presence, and following removal of (+)-EU1180-453. Representative responses are shown for baseline (glutamate only, black trace), glutamate plus 10 μM (+)-EU1180-453 (color trace), and glutamate recovery (gray trace) for A) GluN1/GluN2A (n=7 cells), B) GluN1/GluN2B (n=9 cells), C) GluN1/GluN2C (n=7 cells), and D) GluN1/GluN2D (n=8 cells). E) The mean fold-change in charge transfer (response/baseline) is shown. The dotted line is at fold change of 1. All data are mean ± SEM. Statistical significance determined by paired t-test of control vs drug. See Table 2 for full details. * p < 0.05; ** p < 0.01; n.s. indicates not significant.
Figure 3.
Figure 3.
(+)-EU1180-453 potentiates response of exon5-containing (GluN1-1b) GluN2C and GluN2D NMDARs. A) Representative current responses from Xenopus oocytes of A) GluN1-1b/GluN2C and B) GluN1-1b/GluN2D NMDARs to varying concentrations of (+)-EU1180-453 in presence of saturating concentrations of glutamate (100 μM) and glycine (30 μM). Fitted concentration-response curves of C) GluN1-1b/GluN2C and D) GluN1-1b/GluN2D NMDARs to varying concentrations of (+)-EU1180-453 in presence of 30 μM glycine and 100 μM glutamate. GluN1-1a/GluN2C and GluN11a/GluN2D responses included as reference from Figure 2. Maximum potentiation of percent response (amplitude with saturating glycine and glutamate only) was C) 198 ± 19% of control for GluN1-1b/GluN2C and D) 187 ± 17% of control for GluN1-1b/GluN2D. Number of oocytes for each construct ranged from N=10-18. Representative responses from HEK293T cells are shown for baseline (glutamate only, black trace), glutamate plus 10 μM (+)-EU1180-453 (color trace), and glutamate recovery (gray trace) for E) GluN1-1b/GluN2C (n=7 cells) and F) GluN1-1b/GluN2D (n=9 cells). Cells were held at −70 mV and subjected to rapid and brief (10 ms) application of saturating glutamate (100 μM) in constant presence of 30 μM glycine. Current responses were recorded in absence, presence, and following removal of (+)-EU1180-453. G) The mean fold-change in charge transfer (response/baseline) is shown (paired t-test; baseline vs drug). The dotted line is at fold change of 1. All data are mean ± SEM. * p < 0.05; *** p < 0.001.
Figure 4.
Figure 4.
Synaptic NMDAR-mediated EPSCs in CA1 stratum radiatum GABAergic interneurons, but not CA1 pyramidal cells, are potentiated by (+)-EU1180-453 in developing hippocampus. CA1 stratum radiatum GABAergic interneurons or CA1 pyramidal cells were held at −30 mV in 0.2 mM extracellular Mg2+ and NMDAR-mediated EPSCs were pharmacologically isolated (see Methods). A) and E) Diagram of recording arrangement from mouse hippocampal slices. B) Representative EPSCs show the effects of 10 μM (+)-EU1180-453 (blue) or vehicle (gray) compared to baseline response (black) at CA1 pyramidal cells. C) Charge transfer vs time is shown for 10 μM (+)-EU1180-453 (blue) or vehicle (gray). Values are expressed as the percent of the average of 10 baseline responses. D) Application of 10 μM (+)-EU1180-453 (n = 6 cells, blue) or vehicle (n = 6 cells, 0.1% DMSO, gray) does not alter the charge transfer of NMDAR-mediated EPSCs onto CA1 pyramidal cells. F) Representative EPSCs show the effects of 10 μM (+)-EU1180-453 (magenta) or vehicle (gray) compared to baseline response (black) at stratum radiatum interneurons. G) Charge transfer vs time is plotted for 10 μM (+)-EU1180-453 (magenta) or vehicle (gray). Responses were calculated as a percent of the average of 10 baseline responses. H) Application of 10 μM (+)-EU1180-453 (n = 14 cells, magenta) potentiates the charge transfer of NMDAR-mediated EPSCs onto interneurons (−6.2 ± 1.3 nA*ms for baseline vs −10.2 ± 2.0 nA*ms for (+)-EU1180-453). Application of vehicle (n = 5 cells, 0.1% DMSO, gray) does not alter the charge transfer of NMDAR-mediated EPSCs onto interneurons. All data are mean ± SEM. Statistical significance determined by paired t-test. See Supplemental Table S4 for full results. s.o. = stratum oriens; s.p. = stratum pyramidale; s.r. = stratum radiatum; CA1 = cornu Ammonis 1; CA3 = cornu Ammonis 3; DG = dentate gyrus; ** p < 0.01; n.s. indicates not significant.
Figure 5.
Figure 5.
Application of (+)-EU1180-453 increases inhibitory tone in developing CA1. Spontaneous IPSCs (sIPSCs) were recorded at +10 mV from mouse CA1 pyramidal cells (P11-15). Representative sIPSCs A1) before (black) and A2) after 10 μM (+)-EU1180-453 (magenta, n = 11 cells), B1) before (black) and B2) after vehicle (0.1% DMSO, gray, n = 11 cells). Raster plots for all cells recorded in with C) (+)-EU1180-453 and D) 0.1% DMSO. E) Average sIPSC frequency is significantly increased following 10 μM (+)-EU1180-453 application (7.7 ± 0.9 Hz for baseline vs 10.2 ± 1.1 Hz for 10 μM (+)-EU1180-453; paired t-test), while F) there is no change in sIPSC frequency following 0.1% DMSO (paired t-test). G) Cumulative probability of interevent interval is significantly shifted to the left after 10 μM (+)-EU1180-453 application (KS test). H) Cumulative probability of interevent interval is unchanged in response 0.1% DMSO (KS test). I) Plots of average frequency percent change from baseline for 10 μM (+)-EU1180-453 (magenta) and (gray). 10 μM (+)-EU1180-453 application showed a significant increase the average frequency percent change from baseline compared to 0.1% DMSO (unpaired t-test). Data are mean ± SEM; GBZ = gabazine (SR-95531; 10 μM); KS = Kolmogorov-Smirnov; * p < 0.05; ** p < 0.01; *** p < 0.001; n.s. not significant.
Figure 6.
Figure 6.
(+)-EU1180-453 shifts excitatory-inhibitory ratio towards inhibition and enhances carbachol-induced gamma power in CA1 of hippocampus. A) Representative traces of dual excitatory postsynaptic potential (EPSP) and inhibitory postsynaptic potential (IPSP) before (black) and after 10 μM (+)-EU1180-453 (magenta) or before (black) and after 0.1% DMSO (gray). B) Time series plot showing EPSP/IPSP ratio before and after wash-in of either 10 μM (+)-EU1180-453 (magenta) or 0.1% DMSO (gray). C) EPSP/IPSP ratio is significantly reduced after (+)-EU1180-453 application (2.0 ± 0.3 baseline vs 0.9 ± 0.2 (+)-EU1180-453; paired t-test) but unchanged with 0.1% DMSO. D) Representative field potential recordings from CA1 stratum pyramidale at baseline (black), after 20 μM carbachol (green), and after 20 μM carbachol plus 10 μM (+)-EU1180-453 (magenta). E) Average power spectral density plot at baseline (black), after 20 μM carbachol (green), and after 20 μM carbachol plus 10 μM (+)-EU1180-453 (magenta). Dark line is the average power, with shaded areas representing the SEM. F) Fold change in total gamma band power compared to baseline for 20 μM carbachol only and 20 μM carbachol plus 10 μM (+)-EU1180-453. There are significant increases in fold gamma band power after 20 μM carbachol only, between 20 μM carbachol only and 20 μM carbachol plus 10 μM (+)-EU1180-453, and baseline and 20 μM carbachol plus 10 μM (+)-EU1180-453 (one-way ANOVA). G) Carbachol-induced average gamma band power is significantly increased by application 10 μM (+)-EU1180-453 (paired t-test). Data are mean ± SEM. EPSP = excitatory postsynaptic potential; IPSP = inhibitory postsynaptic potential; * = p < 0.05; ** = p < 0.01; **** = p < 0.0001; ns = not significant.

Similar articles

References

    1. Adesnik H., Li G., During M.J., Pleasure S.J., and Nicoll R.A. (2008). NMDA receptors inhibit synapse unsilencing during brain development. Proc Natl Acad Sci U S A 105, 5597–5602. - PMC - PubMed
    1. Akazawa C., Shigemoto R., Bessho Y., Nakanishi S., and Mizuno N. (1994). Differential expression of five N-methyl-D-aspartate receptor subunit mRNAs in the cerebellum of developing and adult rats. J Comp Neurol 347, 150–160. - PubMed
    1. Antonoudiou P., Tan Y.L., Kontou G., Upton A.L., and Mann E.O. (2020). Parvalbumin and Somatostatin Interneurons Contribute to the Generation of Hippocampal Gamma Oscillations. J Neurosci 40, 7668–7687. - PMC - PubMed
    1. Bhattacharya S., Khatri A., Swanger S.A., DiRaddo J.O., Yi F., Hansen K.B., Yuan H., and Traynelis S.F. (2018). Triheteromeric GluN1/GluN2A/GluN2C NMDARs with Unique Single-Channel Properties Are the Dominant Receptor Population in Cerebellar Granule Cells. Neuron 99, 315–328 e315. - PMC - PubMed
    1. Booker S.A., Sumera A., Kind P.C., and Wyllie D.J.A. (2021). Contribution of NMDA Receptors to Synaptic Function in Rat Hippocampal Interneurons. eNeuro 8. - PMC - PubMed

Publication types

LinkOut - more resources