[Preprint]. 2024 Nov 5:2023.05.07.539748.
doi: 10.1101/2023.05.07.539748.

DNA repair and anti-cancer mechanisms in the long-lived bowhead whale

Affiliations

DNA repair and anti-cancer mechanisms in the long-lived bowhead whale

Denis Firsanov et al. bioRxiv. .

Abstract

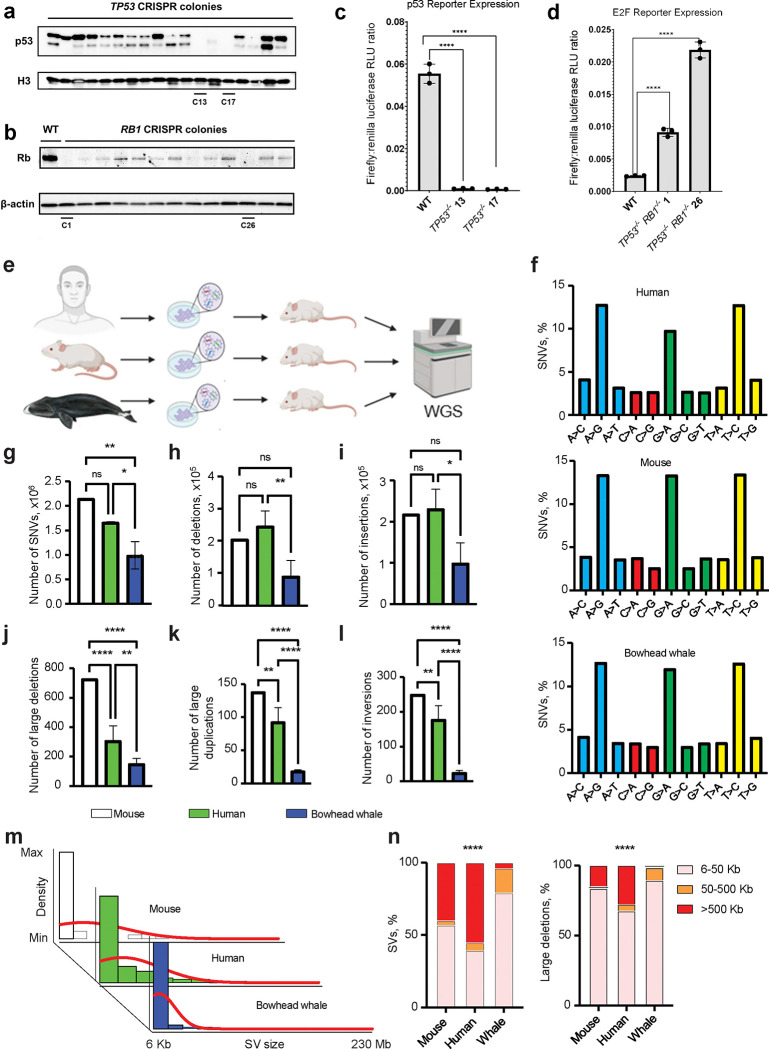
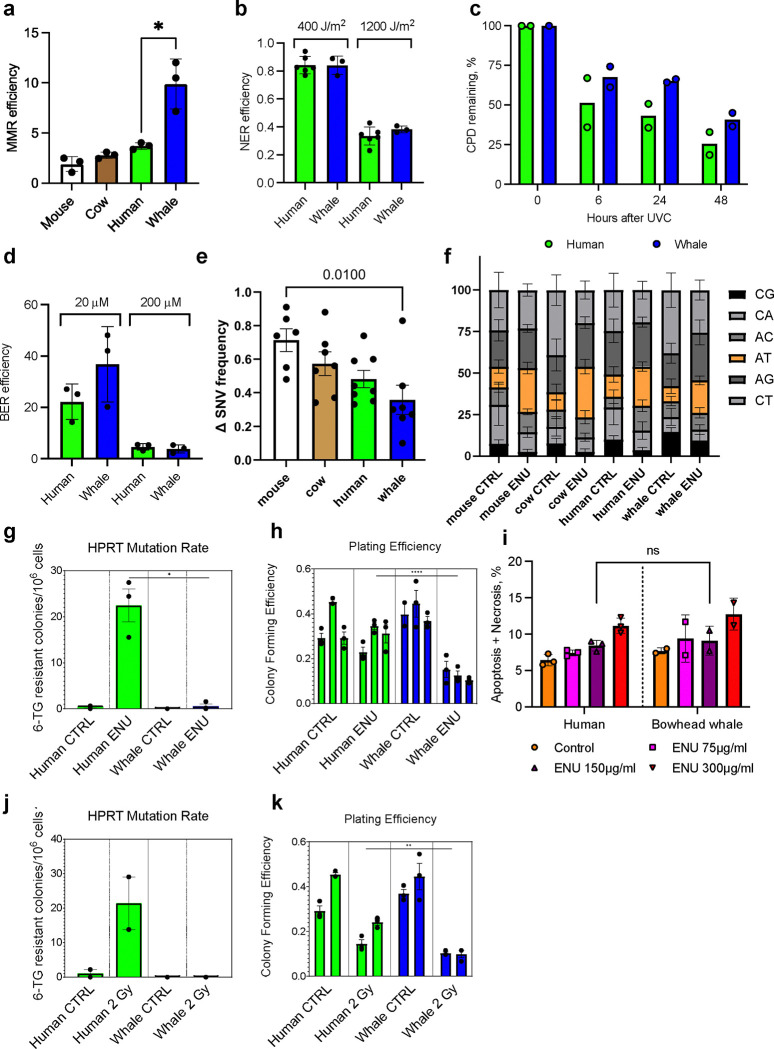
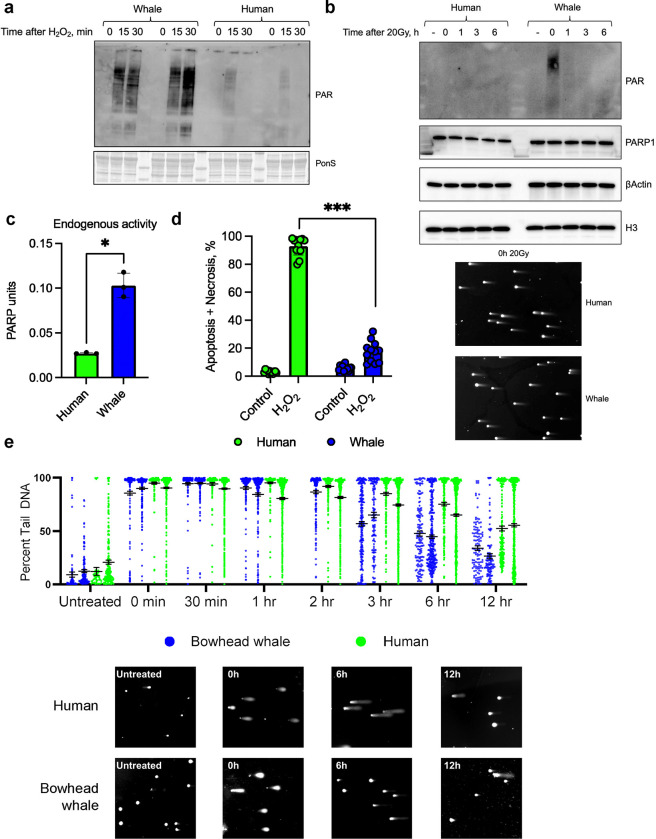
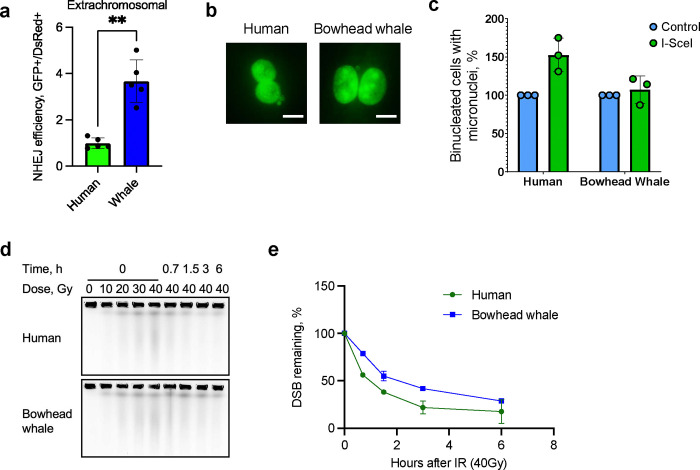
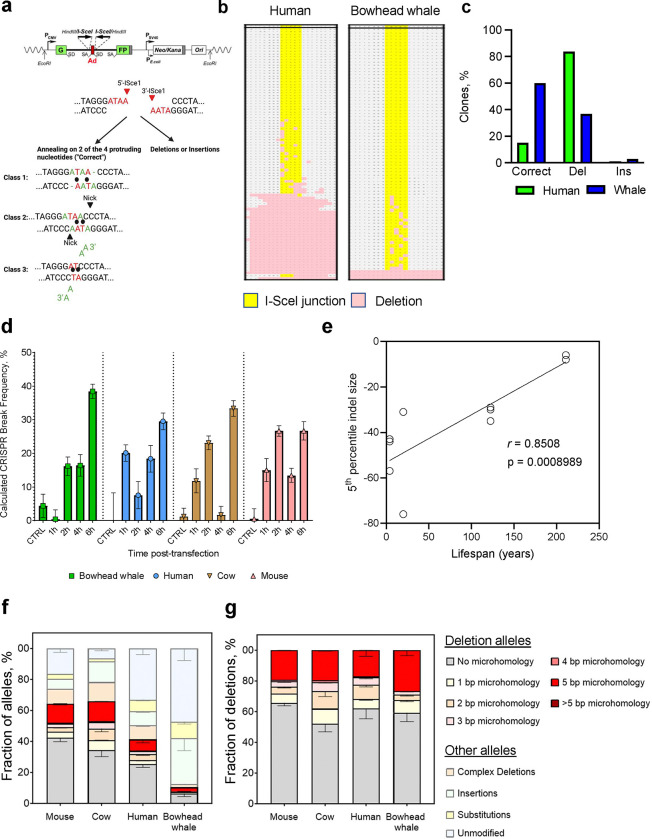
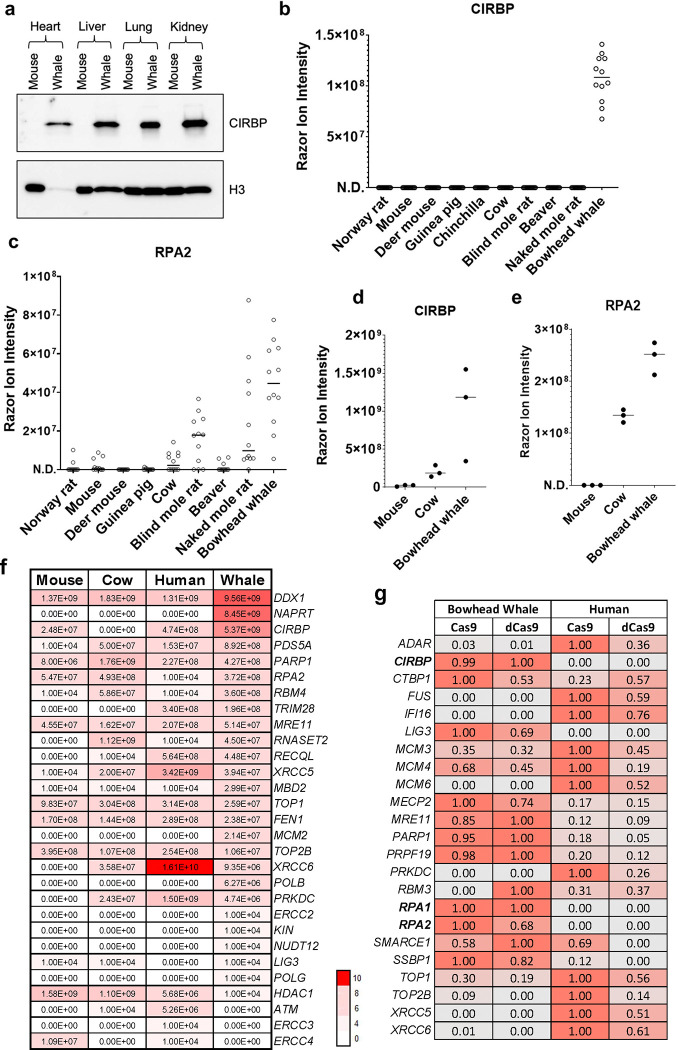
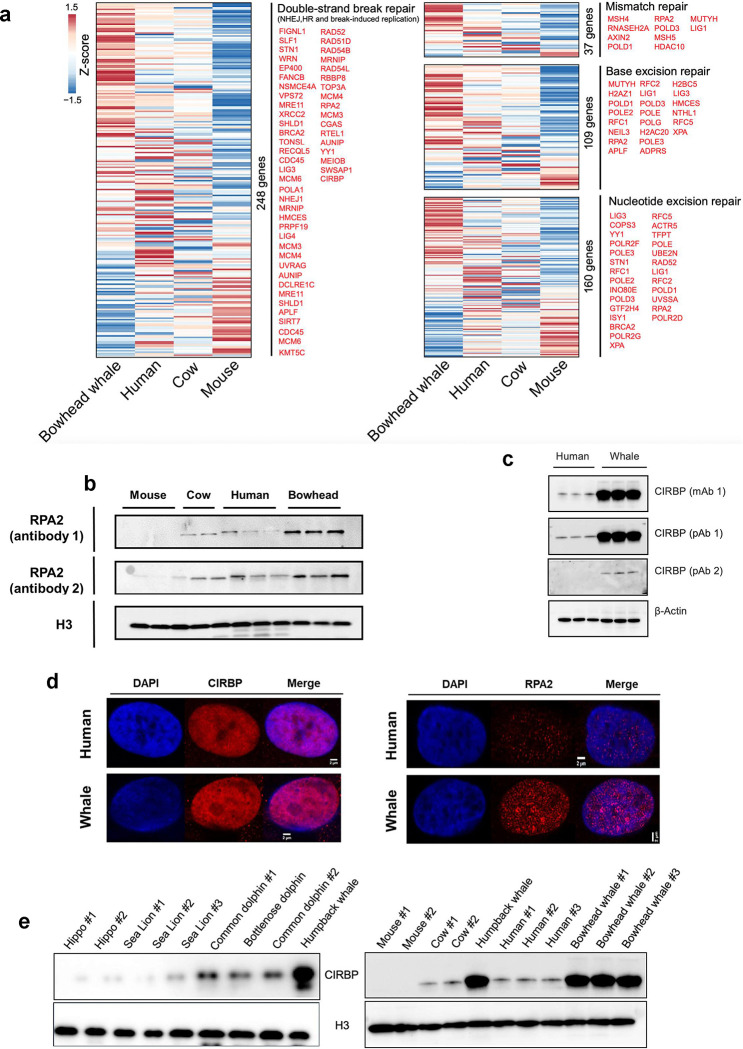
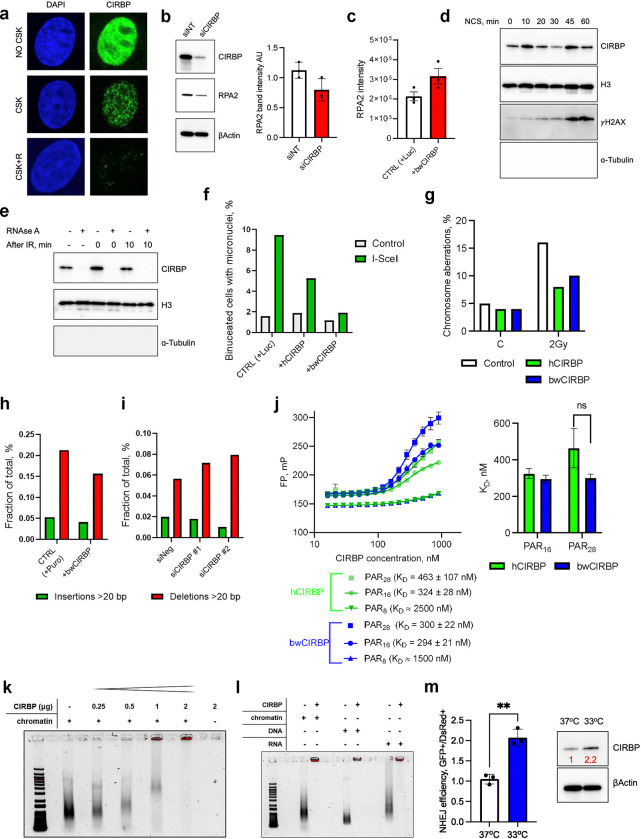
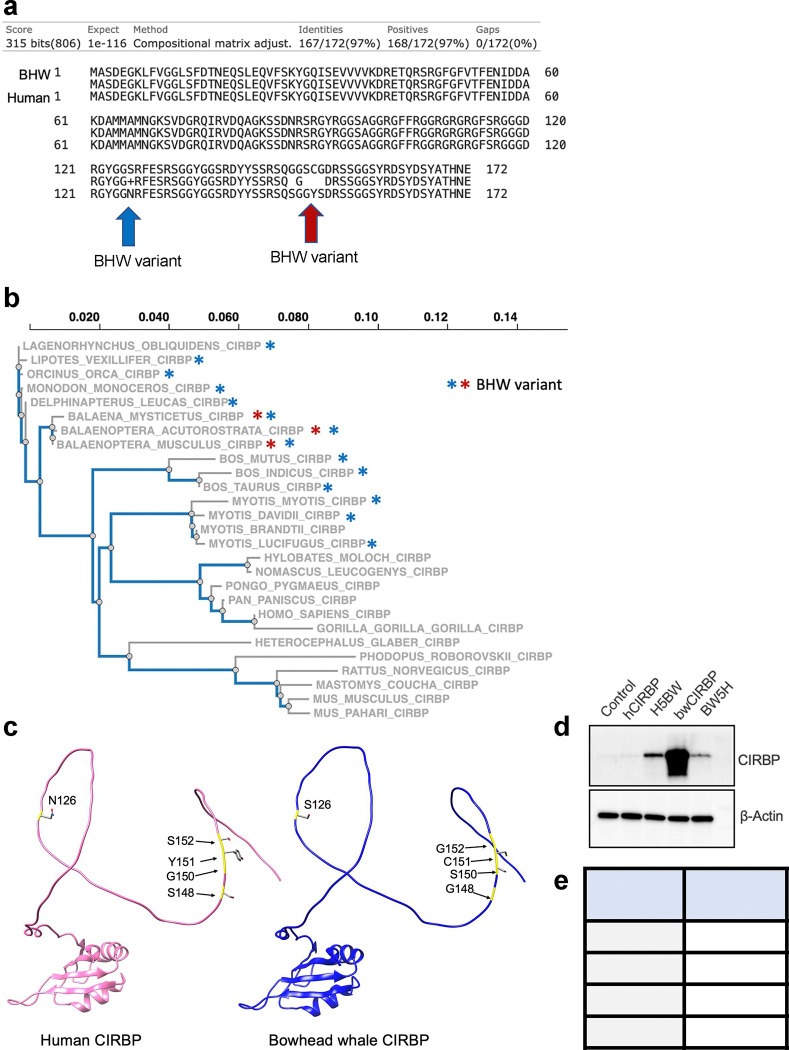
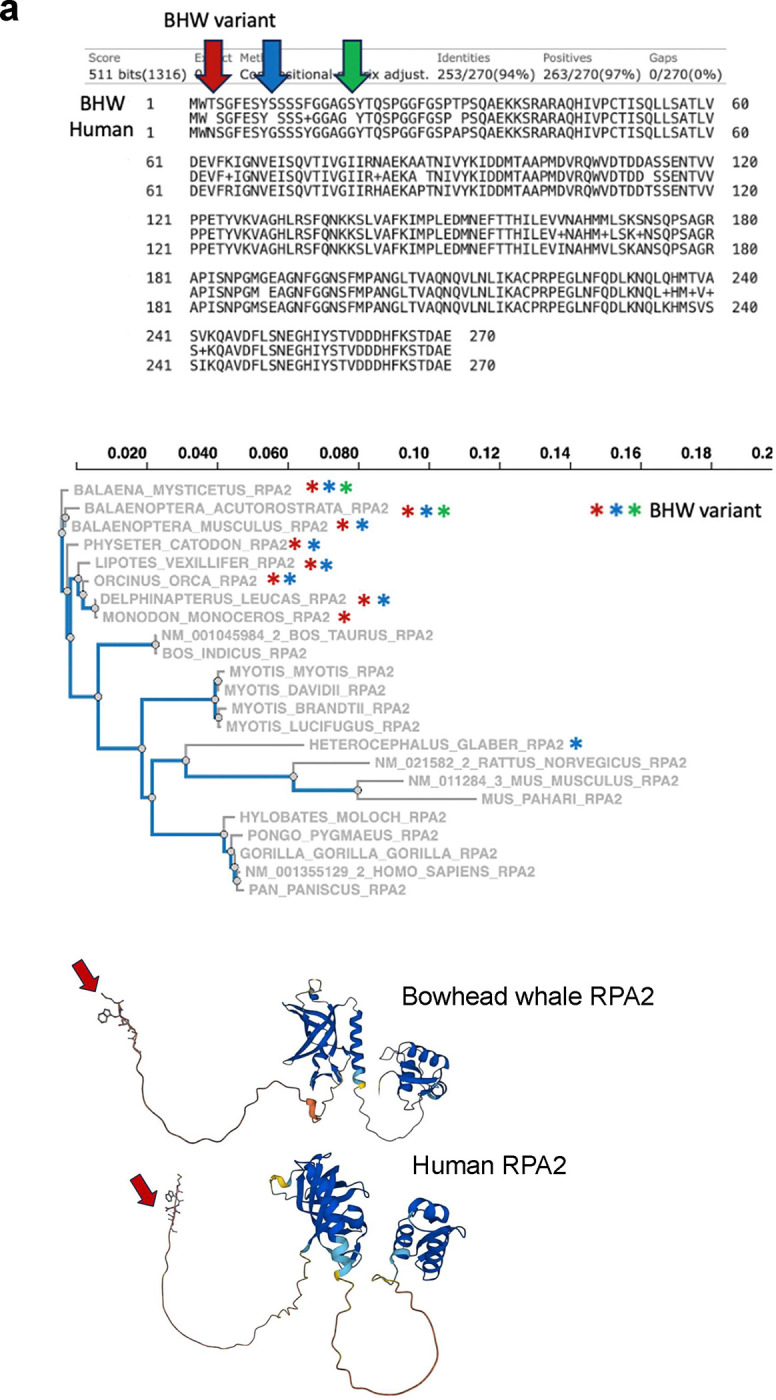
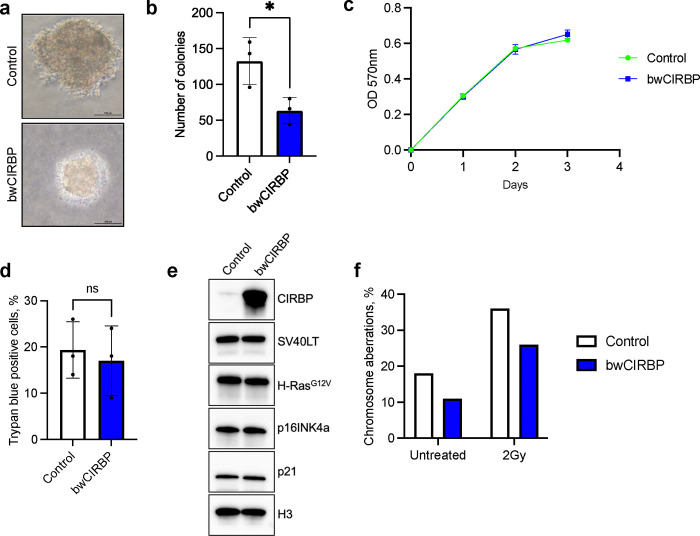
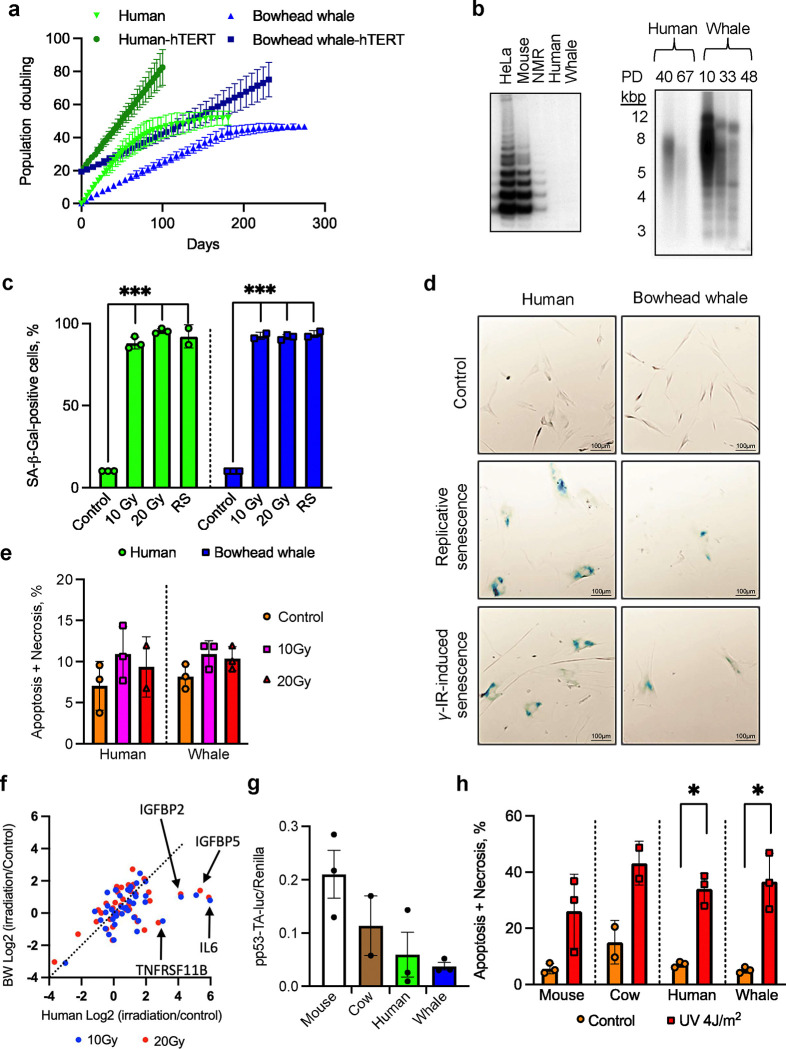
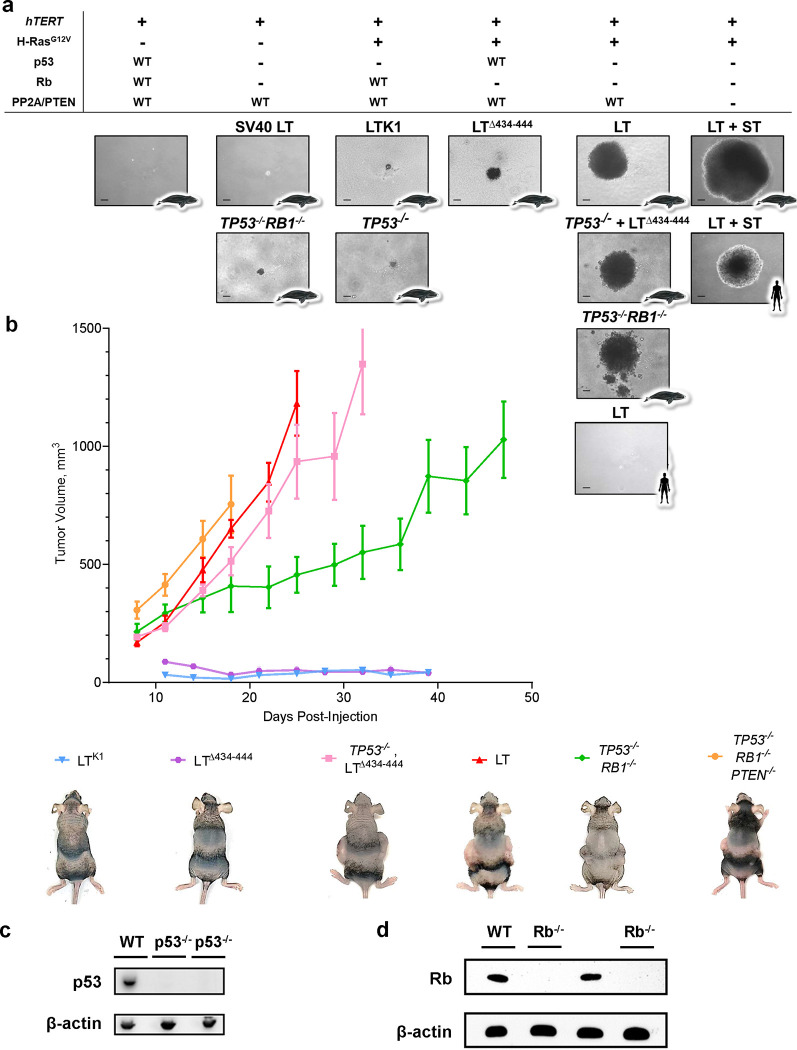
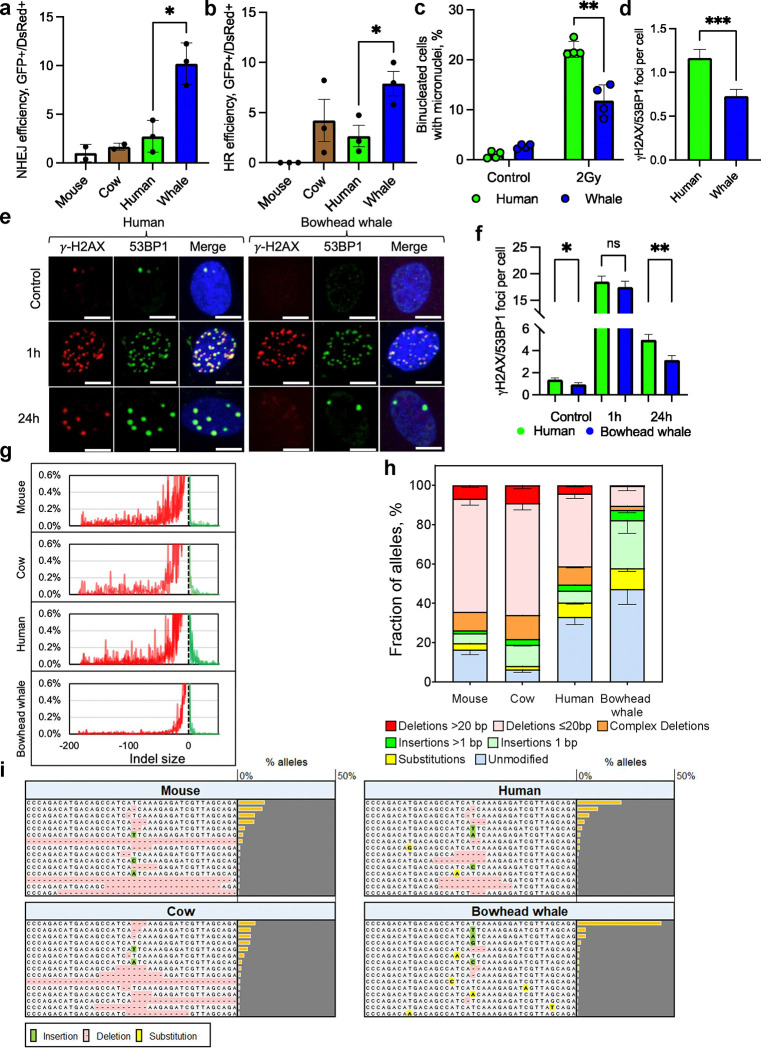
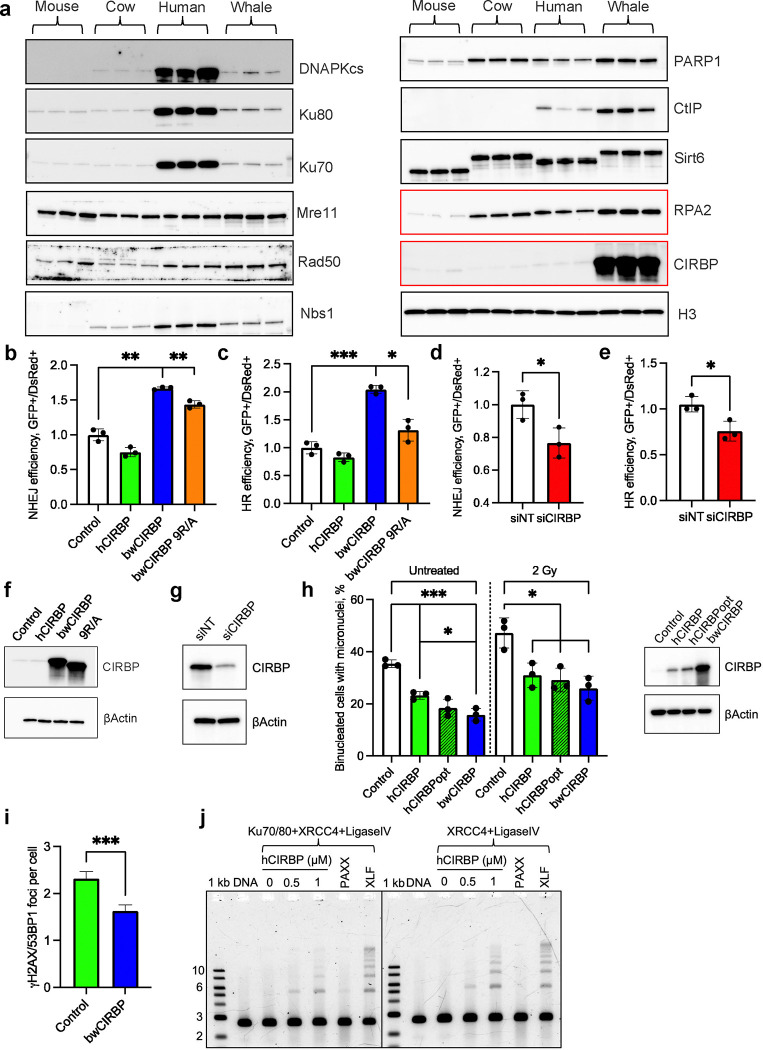
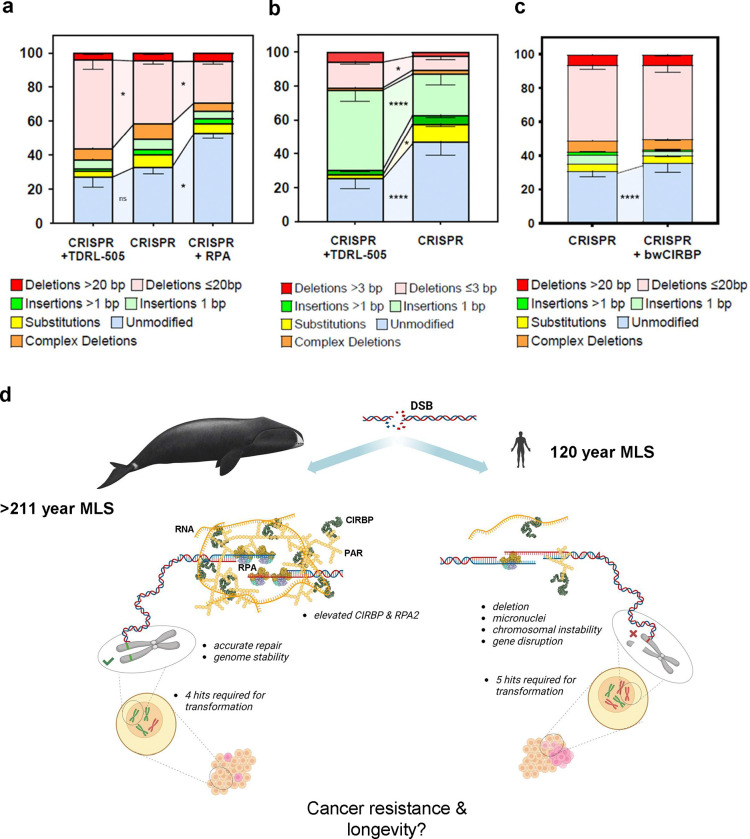
At over 200 years, the maximum lifespan of the bowhead whale exceeds that of all other mammals. The bowhead is also the second-largest animal on Earth, reaching over 80,000 kg1. Despite its very large number of cells and long lifespan, the bowhead is not highly cancer-prone, an incongruity termed Peto's Paradox2. This phenomenon has been explained by the evolution of additional tumor suppressor genes in other larger animals, supported by research on elephants demonstrating expansion of the p53 gene3-5. Here we show that bowhead whale fibroblasts undergo oncogenic transformation after disruption of fewer tumor suppressors than required for human fibroblasts. However, analysis of DNA repair revealed that bowhead cells repair double strand breaks (DSBs) and mismatches with uniquely high efficiency and accuracy compared to other mammals. The protein CIRBP, implicated in protection from genotoxic stress, was present in very high abundance in the bowhead whale relative to other mammals. We show that CIRBP and its downstream protein RPA2, also present at high levels in bowhead cells, increase the efficiency and fidelity of DNA repair in human cells. These results indicate that rather than possessing additional tumor suppressor genes as barriers to oncogenesis, the bowhead whale relies on more accurate and efficient DNA repair to preserve genome integrity. This strategy which does not eliminate damaged cells but repairs them may be critical for the long and cancer-free lifespan of the bowhead whale.


Conflict of interest statement

Competing interests The authors declare no competing interests.

Figures

Extended Data Figure 1.
Extended Data Figure 1.. Mutation rates in bowhead whale cells during tumor progression.
a, Western blot for p53 protein in clonally isolated fibroblast colonies following CRISPR targeting of TP53. Underlined lanes indicate colonies selected for further validation and experiments. b, Western blot for Rb protein in clonally isolated fibroblast colonies following CRISPR targeting of RB1 on an existing p53 knockout background. c, Ratio of firefly:renilla luciferase luminescence in fibroblasts transfected with firefly luciferase reporter of p53 transcriptional activity and renilla luciferase control. Cells were treated with etoposide to induce p53 activity. d, Ratio of firefly:renilla luciferase luminescence in fibroblasts transfected with firefly luciferase reporter of E2F transcriptional activity and renilla luciferase control. Transfected cells were serum starved for 24h and returned to complete medium for 24h before luminescence measurement. Higher E2F activity results from reduced Rb activity. Error bars represent SD. p<0.001 (two-tailed t test), n=3. e, Schematic showing experimental design and samples processed for WGS (whale N = 9 tumors; human N = 2 tumors; mouse N = 1 tumor). f, Bar plot displaying percentages of SNV types across species with similarities of mutational processes across species. g-I, Bar plot showing quantifications of numbers of SNVs and small indels (size 1–10bp) across species. j-l, Bar plot showing quantification of number of large SVs (size > 6000bp) across species. m, Histograms and trend curves showing distribution of SVs size across species. n, Bar plot showing distribution of small, medium and large (6–50Kb, 50–500Kb, >500Kb respectively) SVs and deletions across species. Error bars represent SD. P values are a result of ordinary One-Way Anova with Tukey’s multiple comparison test (g-l) and chi-square test (n). * p < 0.05; ** p < 0.01; *** p < 0.0001; ns = not significant.
Extended Data Figure 2.
Extended Data Figure 2.. Mismatch repair, excision repair, and mutagenesis in bowhead whale cells.
a, MMR reactivation of a heteroduplex eGFP plasmid containing a G/T mismatch. Growing fibroblasts were transfected with the heteroduplex plasmid and a DsRed plasmid as a transfection control. The repair efficiency was calculated as the ratio of GFP+/DsRed+ cells. Each dot represents cell line isolated from different individual (n=3). b, NER efficiency was measured by host cell reactivation assay where a plasmid containing luciferase reporter is UV-irradiated in vitro to induce DNA damage, transfected into cells, and reactivation of the reporter is measured (n=3 for each cell line). c, Kinetics of cyclobutane pyrimidine dimer repair after 30 J/m2 UVC. Confluent human and whale skin fibroblasts were subjected to UVC, harvested at different time-points, genomic DNA was isolated and analyzed for cyclobutene dimers as described in Methods (n=2 for each cell line). d, BER efficiency was measured by host cell reactivation where luciferase reporter plasmid is treated with methylene blue and light to induce oxidative DNA damage, transfected into cells, and luciferase activity measured as described in Methods. e, ENU-induced mutational load by SMM-seq in fibroblasts of the indicated species. Delta SNV frequency was calculated for each cell line (n=6–8 fibroblasts/species; Kruskal-Wallis test). f, Analysis of mutational spectra showing a pattern typical for ENU. An increase in A>T transversions (orange bars) can be found in ENU-treated mammalian cells. g, HPRT mutagenesis assay in ENU-treated cells, adjusted by plating efficiency measured for each cell line (n=3 cell lines/species) h, Colony forming efficiency for HPRT mutagenesis assay. Error bars represent mean ± SD. * p<0.05, ** p<0.01, *** p<0.001, **** p<0.0001 ns=not significant (heteroscedastic two-tailed t test). i, Apoptosis/necrosis of human and bowhead whale fibroblasts in response to ENU. Cells at growing stage were treated for 3h with ENU at indicated dosages. After treatment cells were washed in PBS and incubated for 3 days. For measuring Apoptosis/Necrosis cells were stained with AnnexinV/PI and analyzed by flow cytometry. j, HPRT mutagenesis assay in cells treated with 2 Gy γ-irradiation, adjusted by plating efficiency measured for each cell line (n=2 cell lines/species) k, Colony forming efficiency for HPRT mutagenesis assay.
Extended Data Figure 3.
Extended Data Figure 3.. Poly-ADP-ribosylation and DNA repair of oxidative damage in bowhead whale cells.
a, Bowhead whale cells show greater poly-ADP-ribosylation in response to hydrogen peroxide treatment. b, Bowhead whale cells show greater poly-ADP-ribosylation after γ-irradiation. Cells were harvested immediately or at indicated time-points after radiation for Western blot analysis (top panel). Representative images of comet tails under neutral conditions (bottom panel). Cells were processed immediately after radiation. c, Nuclear extracts of bowhead whale fibroblasts exhibit higher endogenous PARP activity (n=3). Error bars represent mean ± SD. * p<0.05 (Welch’s t-test). Whale=bowhead whale. d, Apoptosis/Necrosis of human and bowhead whale fibroblasts in response to hydrogen peroxide at concentration 700μM. Two days after hydrogen peroxide, cells were harvested and subjected to an Annexin V apoptosis assay using flow cytometry. Error bars represent mean ± SD. *** p<0.001. Welch’s t-test was used to quantify the significance (n=12). e, Percent tail DNA by alkaline comet assay at various time points after 700 μM H2O2 treatment in 2 cell lines each of human and bowhead whale fibroblasts. Points represent individual cells. Representative comet images shown below. Bars indicate mean +- SEM.
Extended Data Figure 4.
Extended Data Figure 4.. DSB repair efficiency in bowhead whale cells.
a, NHEJ efficiency in extrachromosomal assay. NHEJ reporter construct was pre-digested with I-SceI, purified and co-transfected with DsRed into human and bowhead skin fibroblasts. Three days after transfection cells were harvested and subjected to flow cytometry to calculate NHEJ efficiency (n=3). Error bars represent mean ± SD. *** p<0.001 (two-tailed t-test) b, Representative images of human and bowhead whale binucleated cells containing micronuclei after 2 Gy of γ-irradiation. Scale bar indicates 20 μm. c, Frequency of micronuclei after DSB induction with I-SceI in primary fibroblasts carrying a chromosomally integrated NHEJ reporter cassette. Each cell line was transiently transfected with a BFP-expressing control plasmid or an I-SceI expression plasmid and micronuclei were quantified after 5d in media containing cytochalasin B to prevent cytokinesis. Micronucleus frequencies for each cell line are shown normalized to BFP control (paired t-test, n=3 cell lines/species). d, Pulse-field gel stained with ethidium bromide, showing chromosomal DNA fragmentation in human and bowhead confluent skin fibroblasts immediately after different doses of γ-irradiation 0.7, 1.5, 3 and 6h after 40 Gy of γ-irradiation. e, Kinetics of DSB repair measured by PFGE in confluent human and bowhead fibroblasts after 40 Gy of γ-irradiation. n=2 for each species.
Extended Data Figure 5.
Extended Data Figure 5.. Sequencing of DNA DSB repair products in bowhead whale cells.
a, Possible repair outcomes after induction of DSBs with incompatible ends by I-SceI in NHEJ reporter construct. b, Allele plot of Sanger sequencing products resulting from repair of integrated NHEJ reporter cassette after I-SceI cleavage. c, NHEJ fidelity in extrachromosomal assay. NHEJ reporter construct was pre-digested with I-SceI, purified and co-transfected with DsRed into human and bowhead skin fibroblasts. Three days after transfection genomic DNA was isolated, subjected to PCR, cloned and analyzed by Sanger sequencing. At least 100 clones were analyzed for each species. Correct – annealing on 2 of the 4 protruding nucleotides d, Time course of CRISPR cleavage measured by digital droplet PCR (ddPCR). PTEN copy number at varying time points after CRISPR RNP transfection was measured with ddPCR using primers flanking the predicted cleavage site and normalized within each sample to a single-copy genomic ultraconserved element as described in Methods. Error bars show confidence intervals of Poisson distribution calculated in QuantaSoft. e, Pearson correlation between 5th percentile indel size and species lifespan (r=0.8508, 95% CI = 0.5125 to 0.9605, p=0.0009, n=11). f, Absolute frequencies of alleles by base pairs of microhomology across species in CRISPR-targeted PTEN repair products. g, Relative proportions of deletion alleles by base pairs of microhomology across species in CRISPR-targeted PTEN repair products.
Extended Data Figure 6.
Extended Data Figure 6.. Proteomic quantification of DNA repair proteins.
a, Western blot for CIRBP on bowhead whale and mouse organs b, Abundance of CIRBP protein by LC-MS in liver tissue of mammal species (n=12 per species; 3 biological × 4 technical replicates; N.D.=not detected) c, Abundance of RPA2 protein by LC-MS in liver tissue of mammal species (n=12 per species; 3 biological × 4 technical replicates; N.D.=not detected) d, Abundance of CIRBP protein by LC-MS in nuclear extracts of liver tissue of mammal species (n=3 biological replicates per species) e, Abundance of RPA2 protein by LC-MS in nuclear extracts of liver tissue of mammal species (n=3 biological replicates per species; N.D.=not detected) f, Heatmap of LC-MS protein abundance for primary fibroblasts of the indicated species and proteins. Color intensity scale corresponds to log10 ion intensity. g, Per-protein normalized abundance by LC-MS of proteins identified in pulldowns of His-tagged Cas9/dCas9 bound to a plasmid containing the genomic PTEN target sequence after incubation in extracts of soluble nuclear proteins from human and bowhead whale.
Extended Data Figure 7.
Extended Data Figure 7.. Transcriptome, Western blot, and STED quantification of DNA repair proteins.
a, Relative expression level of genes in 6 DNA repair pathways among species. Z-scores are scaled by row. Genes in each pathway are ordered decreasingly based on the expression level in bowhead whale. Genes with higher expression in bowhead whale compared to all 3 other species are highlighted in red text to the right of the heatmap. Genes of each gene set were compiled from 3 resources: MsigDB database, GO ontology, and a curated gene list (www.mdanderson.org/documents/Labs/Wood-Laboratory/human-dna-repair-genes.html) b, Western blot abundance of RPA2 in cultured skin fibroblasts, using 2 different monoclonal primary antibodies targeting conserved epitopes and normalized to histone H3. A third polyclonal antibody produced the same results but had higher background reactivity and is not shown. Each lane is a primary fibroblast line from a different adult individual. Fluorescent secondary antibodies were used to increase linear dynamic range for higher quantitative accuracy. c, Western blot for CIRBP with 3 different antibodies in 3 fibroblast lines per species. mAb=monoclonal antibody, pAb=polyclonal antibody. d, Stimulated emission depletion (STED) images of RPA2 and CIRBP localization in human and bowhead whale fibroblasts. Target protein in red, nuclear DAPI stain in blue. e, Western blot for CIRBP in fibroblasts isolated from various mammalian species.
Extended Data Figure 8.
Extended Data Figure 8.. Analysis of CIRBP’s role in DNA DSB repair.
a, CIRBP localization in whale cells. Before formaldehyde fixation, cells were pre-extracted with CSK buffer +/− RNAseA for 3min. After standard immunocytochemistry procedure images were collected using confocal microscope. b, Western blot of bowhead whale fibroblasts with knockdown of CIRBP (left panel) and band intensity quantification from 3 independent experiments (right panel) suggesting partial dependence of RPA2 protein abundance on CIRBP expression. c, Ion intensity by LC-MS of RPA2 in human fibroblasts with and without lentiviral overexpression of bwCIRBP (n=3 human cell lines). Error bars show mean +-SEM. d, DSBs induce CIRBP enrichment in chromatin. Exponentially growing cells were treated with neocarzinostatin (NCS) for the indicated period of time and lysed in CSK buffer to enrich chromatin-bound fraction. ɑ-Tubulin staining was used to verify the absence of cytoplasmic contamination in chromatin-bound fraction. e, DSBs induced by γ-irradiation lead to CIRBP enrichment in chromatin. This enrichment is promoted by RNA. Exponentially growing cells were treated with γ-irradiation and at the indicated period of time were lysed in CSK buffer with/without RNAse A to enrich proteins in chromatin-bound fraction. f, Overexpression of CIRBP decreases the percentage of binucleated cells containing micronuclei in human cells after I-Sce1-induced DSBs. Each bar indicates an experimental replicate. At least 150 binucleated cells were scored per condition. g, Frequency of chromosomal aberrations in human fibroblasts with and without CIRBP overexpression after 2Gy γ-irradiation. 100 metaphases were analyzed per sample. C=control untreated cells. h, Frequency of insertions and deletions >20 bp in NHEJ reporter constructs PCR-amplified from human fibroblasts with and without bwCIRBP overexpression after I-SceI expression. Insertion/deletion frequencies were determined from Nanopore sequencing data of PCR products and normalized within each sample to total frequency of all insertions or deletions. i, Frequency of insertions and deletions as shown in (h) but for bowhead whale fibroblasts with negative control or CIRBP-targeting siRNAs. j, Calculated dissociation constants (KD) and fluorescence polarization (FP) measurements for CIRBP proteins titrated into solutions containing a fixed concentration (3 nM) of fluorescently labeled PAR of various polymer lengths. k, EMSA of increasing amounts of recombinant human CIRBP incubated in vitro with 300 ng sheared chromatin from fibroblasts exposed to UVC and oxidative DNA damage as described in Methods. Chromatin was treated with Proteinase K but not RNAse. Nucleic acids are stained with SYBR Gold. Red overlay indicates saturated pixels. l, EMSA of 300 ng sheared purified genomic DNA, purified cellular RNA, or chromatin as described in (k) incubated in vitro with 5 μg rhCIRBP. m, Hypothermia promotes NHEJ efficiency in primary human fibroblasts (left panel). Cells were pre-incubated at 33°C for 2 days, co-transfected with I-SceI-digested NHEJ reporter and DsRed, and returned to the 33°C incubator. NHEJ efficiency was measured by flow cytometry 3 days following transfection (n=3). Western blot showing CIRBP upregulation in human cells exposed to 33°C for 2 days (right panel). Western blot images were analyzed in ImageLab software (Bio-Rad). Error bars represent mean ± SD. ** p<0.01 (Welch’s t-test).
Extended Data Figure 9.
Extended Data Figure 9.. Analysis of bwCIRBP coding sequence mutations and protein expression levels.
a, Comparison of amino acid sequences between human and bowhead whale CIRBP through BLAST analysis. b, Phylogenetic tree illustrating the relationships among CIRBP coding sequences from representative species with genome sequence information available. The asterisk indicates the presence of BHW-specific variants in the species. The colors indicate the position of variants shown in (a). c, SwissModel/AlphaFold models of human (left, pink) and bowhead whale (right, blue). Side chains of whale residues that diverge from human are shown, and their ribbon is colored yellow in the model. The key takeaway is that all the residues that differ between whale and human are in the C-terminal disordered region, whereas the N-terminal RNA recognition motif (RRM) is structured and conserved. d, Western blot abundance of bwCIRBP, hCIRBP, and reciprocal amino acid mutants overexpressed in human cells. e, Calculated codon adaptation index (CAI) for CIRBP coding sequence variants.
Extended Data Figure 10.
Extended Data Figure 10.. Analysis of bowhead whale RPA2 sequence.
a, Comparison of amino acid sequences between human and bowhead whale RPA2 through BLAST analysis. b, Phylogenetic tree illustrating the relationships among RPA2 coding sequence from different representative species. The asterisk indicates the presence of BHW-specific variants in the species. The colors indicate the position of variants shown in (a). c, AlphaFold protein structures of human and bowhead whale RPA2 showing the position of the variants.
Extended Data Figure 11.
Extended Data Figure 11.. Bowhead whale CIRBP reduces anchorage-independent cell growth.
a, Images of representative human transformed fibroblast colonies with and without bwCIRBP overexpression after 23 days of growth in soft agar. 20x magnification. Bar 100μm. b, Quantification of colonies after staining with nitro blue tetrazolium chloride. Colonies were counted using ImageJ software as described in Methods. Error bars represent SD. *p<0.05 (Welch’s t-test). c, Cell proliferation MTT assay. d, Trypan Blue exclusion test of cell viability. e, Western blot showing expression of LT, Ras, p16 and p21 after overexpression of bwCIRBP. f, Frequency of chromosomal aberrations in human transformed cells after bwCIRBP overexpression. 100 metaphases were analyzed per sample.
Figure 1.
Figure 1.. Bowhead whale fibroblasts exhibit senescence with reduced SASP and low basal p53 activity.
a, Growth curves of primary and hTERT-immortalized skin fibroblasts (n=2 for each cell line). b, Telomerase activity and telomere length in skin fibroblasts. c, Quantification of β-gal–positive human and bowhead skin fibroblasts in response to γ-irradiation (12 days) and replicative senescence (n=3 for each species). d, Representative images of SA-β-gal staining of human and bowhead skin fibroblasts in response to γ-irradiation and replicative senescence. The bar is 100 μm. e, Apoptosis of human and bowhead whale fibroblasts in response to γ-irradiation. Three days after γ-irradiation, cells were harvested and subjected to an Annexin V apoptosis assay using flow cytometry (n=3 for each species). f, Log fold change of SASP mRNA expression in human and bowhead whale skin fibroblasts 12 days after γ-irradiation. g, Relative luciferase expression in mouse, cow, human and bowhead whale fibroblasts transfected with the p53 reporter vector. Data are shown as ratios of firefly/renilla luciferase (to normalize for transfection efficiency) expression 24 h after transfections (n=3 for mouse, human, BW; n=2 for cow). h, Apoptosis of mouse, cow, human and bowhead whale fibroblasts in response to UVC. Two days after UVC, cells were harvested and subjected to an Annexin V apoptosis assay using flow cytometry. Error bars represent mean ± SD. * p<0.05, *** p<0.001. Welch’s t-test was used to quantify the significance. Whale, bowhead whale; NMR, naked mole-rat. RS, replicative senescence.
Figure 2.
Figure 2.. Fewer tumor suppressor hits are required for oncogenic transformation of bowhead fibroblasts than for human fibroblasts.
a, Images of representative fibroblast colonies for tested cell lines after 4 weeks of growth in soft agar. The top panel indicates whether the cell lines in the column below have the indicated protein overexpressed (+), inactivated (−), or expressed in the active endogenous form (WT). Text above individual images indicate for that cell line whether tumor suppressors are inactivated through genetic knockout or SV40 Large T (or LT mutants) or Small T (ST) antigen. Icons in corners of images indicate species. Scale bar represents 250 μm. b, Volumetric growth curves for the indicated bowhead whale fibroblast cell lines in mouse xenograft assays. All cell lines shown stably express H-RasG12V and hTERT in addition to the genotype indicated in the figure legend. Data points represent averages from 3 immunodeficient nude mice injected bilaterally (6 injections) for each cell line, except for TP53−/−RB1−/− double knockouts, for which 2 independent cell lines were tested, for a total of 6 mice/12 injections. Experiments were terminated based on predetermined thresholds for maximum tumor length or duration of experiment as described in Methods. Images in the legend show a representative mouse for the indicated cell line at the final measured time point. Error bars show SEM. c, Western blot for p53 protein in clonally isolated fibroblast colonies following CRISPR targeting of TP53. Underlined lanes indicate colonies selected for further validation and experiments. d, Western blot for Rb protein in clonally isolated fibroblast colonies following CRISPR targeting of RB1 on an existing p53 knockout background.
Figure 3.
Figure 3.. The bowhead whale repairs DSBs with higher accuracy and efficiency than other mammals.
a,b, NHEJ and HR efficiency were measured using fluorescent reporter constructs. Successful NHEJ and HR event leads to reactivation of the GFP gene. NHEJ and HR reporter constructs were integrated into primary, low passage skin fibroblasts. NHEJ and HR repair efficiency were assayed by transfecting cells with I-SceI expression vector and a DsRed plasmid as a transfection control. The repair efficiency was calculated as the ratio of GFP+/DsRed+ cells. Experiments were repeated at least 3 times for each cell line. Error bars represent SD. * p<0.05 (Welch’s t-test). Whale, bowhead whale. c, Percent of binucleated cells containing micronuclei in human and bowhead whale fibroblasts after 2Gy γ-irradiation (n=4). Error bars represent SD. ** p<0.005 (Welch’s t-test). d, Endogenous γ-H2AX/53BP1 foci in human and whale cells. Results are combined from two independent experiments. 200 nuclei were analyzed. Error bars represent SEM. *** p<0.001 (two-tailed t-test). e, Representative confocal images of human and bowhead whale cells stained for γ-H2AX and 53BP1 at no treatment (control) and 1h-24h after bleomycin treatment at concertation 5μg/mL. Scale bar indicates 10 μm. f, Quantification of γH2AX/53BP1 foci with and without DSB induction. Exponentially growing cells were treated for 1h with bleomycin (BLM) at concertation 5μg/mL, washed twice with PBS and fresh media was added. At indicated time-points cells were fixed and processed for immunocytochemistry. Foci were counted by eye in green and red channels. 150–170 nuclei were analyzed. Error bars represent SEM. *p<0.05, ** p<0.01 (two-tailed t-test). g, Histograms of CRISPR indel size distribution by species. Data for biological replicates are superimposed and partially transparent with lines connecting data points for each sample. Unmodified alleles and alleles with substitutions only are excluded from this analysis. h, Distribution of sequenced PTEN allele variants by species after CRISPR DSB induction at a conserved region of the endogenous PTEN gene. Data are averages from multiple primary dermal fibroblast lines isolated from different individual animals for bowhead whale (n=3), human (n=3), cow (n=2), and mouse (n=3). Error bars represent SEM. i, Allele plots showing 15 most frequent allele types after CRISPR for one representative cell line per species. Sequences are displayed within a window centered on the cleavage site and extending 20 bp in each direction. Data bars and values indicate proportion of total alleles represented by each row. For the purposes of this display and quantification, all individual alleles with identical sequences in the 40-bp window have been pooled, so rows represent composites of alleles that may differ outside the display window.
Figure 4.
Figure 4.. CIRBP is highly expressed in bowhead whale fibroblasts and promotes DNA DSB repair and genome stability.
a, Western blots of DNA repair proteins in primary fibroblasts from different species. b-c, bwCIRBP promotes NHEJ and HR in human cells as measured by flow cytometric GFP-reporter assays (see Methods). In these assays DSBs are induced within inactive NHEJ or HR reporter cassettes by expressing I-SceI endonuclease. Successful NHEJ or HR events lead to reactivation of the fluorescent GFP reporters that are scored by flow cytometry. All experiments in these figures were repeated at least 3 times. d,e, Knockdown of CIRBP in bowhead whale fibroblasts decreases NHEJ and HR efficiency. siNT = non-targeting siRNA. f, Western blot of human fibroblasts overexpressing human CIRBP, whale CIRBP or 9R/A mutated whale CIRBP; g, Western blot of bowhead whale fibroblasts with knockdown of CIRBP. h, Overexpression of CIRBP decreases the percentage of binucleated cells containing micronuclei in human cells 3d after 2Gy γ-irradiation (n=3) (left panel); Western blot of human fibroblasts overexpressing human CIRBP, human CIRBP with optimized codons and whale CIRBP (right panel). Error bars represent mean ± SD. * p<0.05, ** p<0.01, *** p<0.001 (Welch’s t-test). siNT - negative control siRNAs that do not target any gene product. i, Number of endogenous γH2AX/53BP1 foci in human cells with bwCIRBP overexpression. Error bars represent SEM. *** p<0.001 (two-tailed t-test). j, CIRBP stimulates NHEJ-mediated ligation in vitro in. Linearized pUC19 plasmid with cohesive ends was mixed with human recombinant proteins XRCC4/Ligase IV complex, and 0 to 1 μM CIRBP. Where indicated, reaction mixtures contained Ku70/80 heterodimer, PAXX dimer or XLF dimer. The reaction mixtures were incubated for 1 hr at 30°C, proteins were denatured with SDS at 65°C and loaded onto agarose gel. Each sample were loaded onto 0.7% agarose gel, followed by gel electrophoresis. The gel was stained with ethidium bromide.
Figure 5.
Figure 5.. RPA and CIRBP contribute to increased DNA repair fidelity.
a, Distribution of sequenced PTEN allele variants in human primary fibroblasts treated with TDRL-505 or rhRPA after CRISPR DSB induction at a conserved region of the endogenous PTEN gene. Data are averages from experiments performed in triplicate. Error bars represent SEM. b, Distribution of sequenced PTEN allele variants by species in bowhead whale primary fibroblasts treated with TDRL-505 after CRISPR DSB induction at a conserved region of the endogenous PTEN gene. Data are averages from experiments performed in triplicate. Error bars represent SEM. c, Distribution of sequenced PTEN allele variants by species in human fibroblasts with lentiviral overexpression of luciferase or bwCIRBP after CRISPR DSB induction at a conserved region of the endogenous PTEN gene. Data are averages from experiments performed in triplicate. Error bars represent SEM. * p<0.05, **** p<0.0001. All charts analyzed by two-way ANOVA with Fisher’s LSD. p-values should be considered nominal indices of significance. d, Graphical summary. The bowhead whale has evolved efficient and accurate DSB repair mediated by high levels of CIRBP and RPA2. This enhanced DNA repair may help the bowhead whale resist cancer despite its cells requiring fewer mutational hits for malignant transformation than human cells. Improved DNA repair rather than enhanced elimination of damaged cells through apoptosis or senescence may promote longevity in the bowhead whale.

References

    1. Tacutu R. et al. Human Ageing Genomic Resources: new and updated databases. Nucleic Acids Res 46, D1083–D1090 (2018). - PMC - PubMed
    1. Peto R. Epidemiology, multistage models, and short-term mutagenicity tests. in The origins of human cancer (eds. Hiatt H., Watson J. & Winsten J.) vol. 4 1403–1428 (Cold Spring Harbor Conferences on Cell Proliferation, NY, 1977).
    1. Abegglen L. M. et al. Potential Mechanisms for Cancer Resistance in Elephants and Comparative Cellular Response to DNA Damage in Humans. JAMA 314, 1850 (2015). - PMC - PubMed
    1. Vazquez J. M., Sulak M., Chigurupati S. & Lynch V. J. A Zombie LIF Gene in Elephants Is Upregulated by TP53 to Induce Apoptosis in Response to DNA Damage. Cell Rep 24, 1765–1776 (2018). - PubMed
    1. Sulak M. et al. TP53 copy number expansion is associated with the evolution of increased body size and an enhanced DNA damage response in elephants. Elife 5, (2016). - PMC - PubMed

Publication types