

This is a preprint.
Using Joint Longitudinal and Time-to-Event Models to Improve the Parameterization of Chronic Disease Microsimulation Models: an Application to Cardiovascular Disease
- PMID: 39574877
- PMCID: PMC11581079
- DOI: 10.1101/2024.10.27.24316240
Using Joint Longitudinal and Time-to-Event Models to Improve the Parameterization of Chronic Disease Microsimulation Models: an Application to Cardiovascular Disease
Abstract
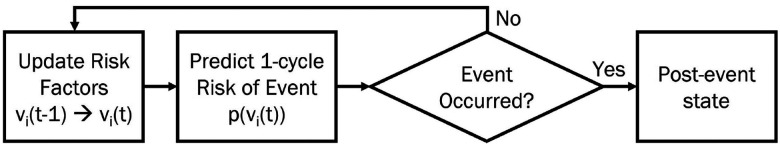
Background: Chronic disease microsimulation models often simulate disease incidence as a function of risk factors that evolve over time (e.g., blood pressure increasing with age) in order to facilitate decision analyses of different disease screening and prevention strategies. Existing models typically rely on incidence rates estimated with standard survival analysis techniques (e.g., proportional hazards from baseline data) that are not designed to be continually updated each model cycle. We introduce the use of joint longitudinal and time-to-event to parameterize microsimulations to avoid potential issues from using these existing methods. These joint models include random effects regressions to estimate the risk factor trajectories and a survival model to predict disease risk based on those estimated trajectories. In a case study on cardiovascular disease (CVD), we compare the validity of microsimulation models parameterized with this joint model approach to those parameterized with the standard approaches.
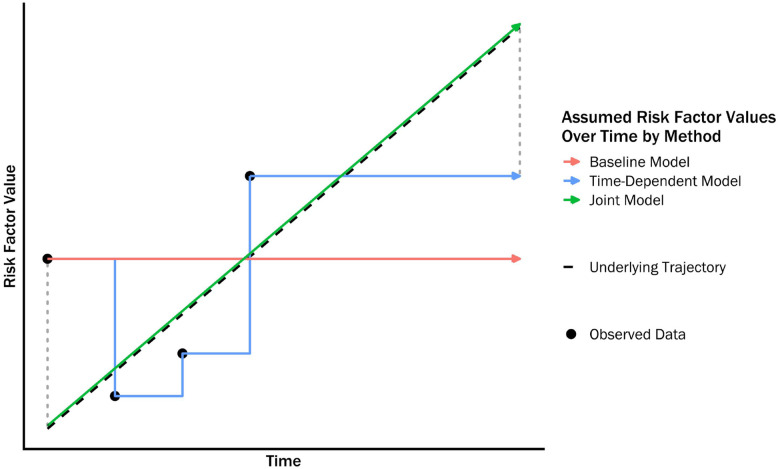
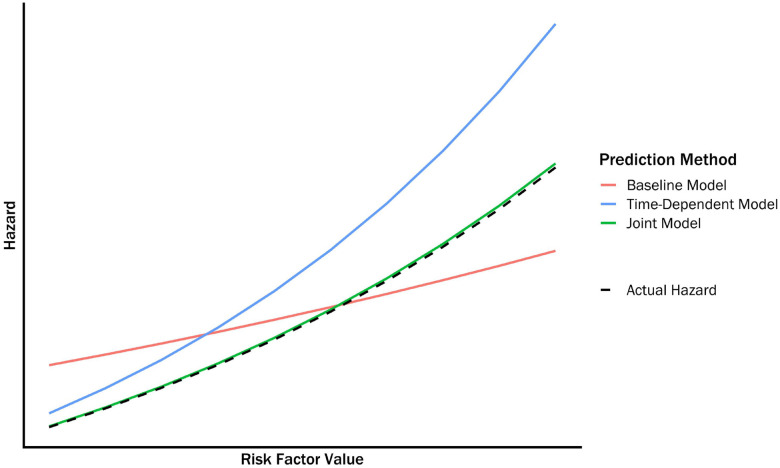
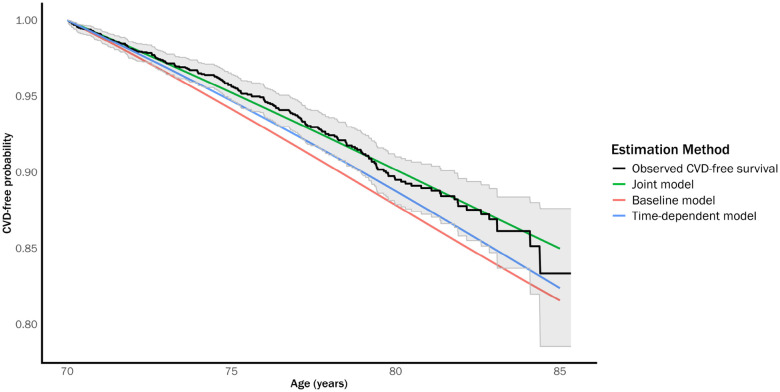
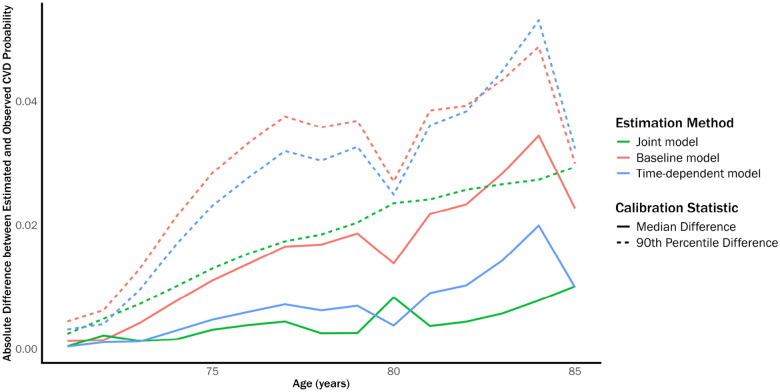
Methods: A CVD microsimulation model was constructed that modeled the trajectory of seven CVD risk factors/predictors as a function of age (smoking, diabetes, systolic blood pressure, antihypertensive medication use, total cholesterol, HDL, and statin use) and predicted yearly CVD incidence as a function of these predictors, plus age, sex, and race. We parameterized the model using data from the Atherosclerosis Risk in Communities study (ARIC). The risk of CVD in the microsimulation was parameterized with three approaches: (1) joint longitudinal and time-to-event model, (2) proportional hazards model estimated using baseline data, and (3) proportional hazards model estimated using time-varying data. We accounted for non-CVD mortality across all the parameterization approaches. We simulated risk factor trajectories and CVD incidence from age 70y to 85y for an external test set comprised of individuals from the Multi-Ethnic Study of Atherosclerosis (MESA). We compared the simulated to observed incidence using both average survival curves and the E50 and E90 calibration metrics (the median and 90th percentile absolute difference between observed and predicted incidence) to measure the validity of each parameterization approach.
Results: The average CVD survival curve estimated by the microsimulation model parameterized with the joint model approach matched the observed curve from the test set relatively closely. The other parameterization methods generally performed worse, especially the proportional hazards model estimated using baseline data. Similar results were observed for the calibration metrics, with the joint model performing particularly well on the E90 metric compared to the other models.
Conclusions: Using a joint longitudinal and time-to-event model to parameterize a CVD simulation model produced incidence predictions that more accurately reflected observed data than a model parameterized with standard approaches. This parameterization approach could lead to more reliable microsimulation models, especially for models that evaluate policies which depend on tracking dynamic risk factors over time. Beyond this single case study, more work is needed to identify the specific circumstances where the joint model approach will outperform existing methods.
Figures
References
-
- Kuntz KM, Russell LB, Owens DK, Sanders GD, Trikalinos TA, and Salomon JA. Decision Models in Cost-Effectiveness Analysis. In: Cost-Effectiveness in Health and Medicine. Ed. by Neumann PJ, Ganiats TG, Russell LB, Sanders GD, and Siegel JE. Oxford University Press, 2016. DOI: 10.1093/acprof:oso/9780190492939.003.0005. - DOI
-
- Hayes AJ, Leal J, Gray AM, Holman RR, and Clarke PM. UKPDS outcomes model 2: a new version of a model to simulate lifetime health outcomes of patients with type 2 diabetes mellitus using data from the 30 year United Kingdom Prospective Diabetes Study: UKPDS 82. Diabetologia 2013;56:1925–33. DOI: 10.1007/s00125-013-2940-y. - DOI - PubMed
Publication types
Grants and funding
LinkOut - more resources
Full Text Sources