[Preprint]. 2025 Apr 14:2024.10.31.24314716.
doi: 10.1101/2024.10.31.24314716.

Loss of DOT1L disrupts neuronal transcription, behavior, and leads to a neurodevelopmental disorder

Marissa J Maroni  1   2   3 Melissa Barton  4   2   3 Katherine Lynch  2   3 Ashish R Deshwar  5   6   7   8   9 Philip D Campbell  10   11 Josephine Millard  2   11 Rachel Lee  12 Annastelle Cohen  4   2   3 Rili Ahmad  2   3 Alekh Paranjapye  2   3 Víctor Faundes  13 Gabriela M Repetto  14 Caoimhe McKenna  15 Amelle L Shillington  16 Chanika Phornphutkul  17 Hanne B Hove  18 Grazia M S Mancini  19 Rachel Schot  19   20 Tahsin Stefan Barakat  19   20   21 Christopher M Richmond  22   23 Julie Lauzon  24 Ahmed Ibrahim Elsayed Ibrahim  25 Caroline Nava  26   27 Delphine Héron  27 Minke M A van Aalst  19 Slavena Atemin  28 Mila Sleptsova  28   29 Iliyana Aleksandrova  30 Albena Todorova  28   29 Debra L Watkins  31 Mariya A Kozenko  31 Daniel Natera-de Benito  32 Carlos Ortez  32 Berta Estevez-Arias  32   33 François Lecoquierre  34 Kévin Cassinari  34 Anne-Marie Guerrot  34 Jonathan Levy  35   36 Xenia Latypova  35   36 Alain Verloes  35   36 A Micheil Innes  37 Xiao-Ru Yang  37   38 Siddharth Banka  39   40 Katharina Vill  41 Maureen Jacob  42 Michael Kruer  43   44 Peter Skidmore  43   44   45 Carolina I Galaz-Montoya  43   44   46 Somayeh Bakhtiari  43   44 Jessica L Mester  47 Michael Granato  11 Karim-Jean Armache  12 Gregory Costain  6   7   8   9 Erica Korb  2   3
Affiliations

Loss of DOT1L disrupts neuronal transcription, behavior, and leads to a neurodevelopmental disorder

Marissa J Maroni et al. medRxiv. .

Update in

  • Loss of DOT1L disrupts neuronal transcription and leads to a neurodevelopmental disorder.
    Maroni MJ, Barton M, Lynch K, Deshwar AR, Campbell PD, Millard J, Lee R, Cohen A, Ahmad R, Paranjapye A, Faundes V, Repetto GM, McKenna C, Shillington AL, Phornphutkul C, Hove HB, Mancini GMS, Schot R, Barakat TS, Richmond CM, Lauzon J, Ibrahim AIE, Nava C, Héron D, van Aalst MMA, Atemin S, Sleptsova M, Aleksandrova I, Todorova A, Watkins DL, Kozenko MA, Natera-de Benito D, Ortez C, Estevez-Arias B, Lecoquierre F, Cassinari K, Guerrot AM, Levy J, Latypova X, Verloes A, Innes AM, Yang XR, Banka S, Vill K, Jacob M, Kruer M, Skidmore P, Galaz-Montoya CI, Bakhtiari S, Mester JL, Granato M, Armache KJ, Costain G, Korb E. Maroni MJ, et al. Brain. 2025 Jun 11:awaf212. doi: 10.1093/brain/awaf212. Online ahead of print. Brain. 2025. PMID: 40494548

Abstract

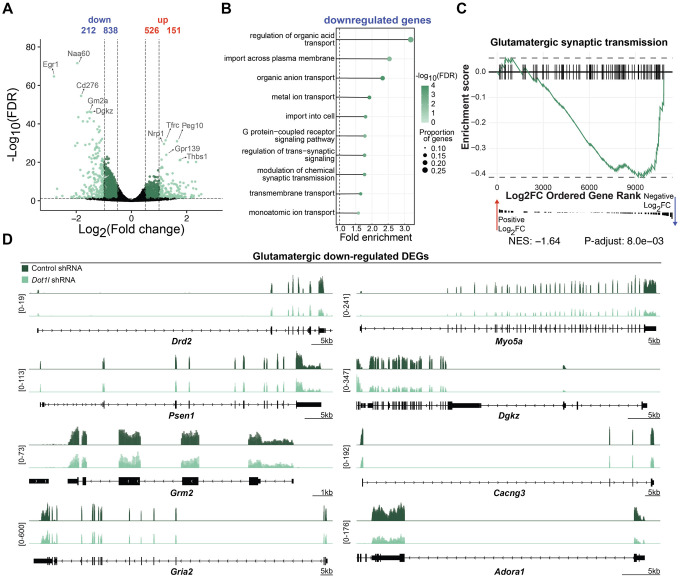
Individuals with monoallelic gain-of-function variants in the histone lysine methyltransferase DOT1L display global developmental delay and varying congenital anomalies. However, the impact of monoallelic loss of DOT1L remains unclear. Here, we sought to define the effects of partial DOT1L loss by applying bulk and single-nucleus RNA-sequencing, ChIP-sequencing, imaging, multielectrode array recordings, and behavioral analysis of zebrafish and multiple mouse models. We present a cohort of 16 individuals (12 females, 4 males) with neurodevelopmental disorders and monoallelic DOT1L variants, including a frameshift deletion, an in-frame deletion, a nonsense, and missense variants clustered in the catalytic domain. We demonstrate that specific variants cause loss of methyltransferase activity. In primary cortical neurons, Dot1l knockdown disrupts transcription of synaptic genes, neuron branching, expression of a synaptic protein, and neuronal activity. Further in the cortex of heterozygous Dot1l mice, Dot1l loss causes sex-specific transcriptional responses and H3K79me2 depletion, including within down-regulated genes. Lastly using both zebrafish and mouse models, we found behavioral disruptions that include developmental deficits and sex-specific social behavioral changes. Overall, we define how DOT1L loss leads to neurological dysfunction by demonstrating that partial Dot1l loss impacts neuronal transcription, neuron morphology, and behavior across multiple models and systems.

Keywords: DOT1L; loss-of-function; neurodevelopmental disorders.


Conflict of interest statement

Competing interests KV has received honoraria as an advisory board member, travel expenses and speaker fees from Biogen, Santhera, Orchard, ITF and Novartis, outside the submitted work. JLM is an employee of and may own stock in GeneDx, LLC. All other authors declare they have no competing interests.

Figures

Figure 1.
Figure 1.. Monoallelic variants in DOT1L are associated with a human neurodevelopmental disorder.
(A) The landscape of missense tolerance of DOT1L from Metadome. Schematic of DOT1L protein domains (purple = catalytic, pink = leucine zipper, blue = CTD binding, teal = ENL/AF9 binding, and yellow = nuclear localization signal) and locations of DOT1L variants (black = missense, orange = deletion, red = nonsense/frameshift). (B) Images of dysmorphic facial features in individuals with DOT1L variants. (C) DOT1L variant individuals’ phenotypic spectrum and prevalences. ASD = autism spectrum disorder. ADHD = attention deficit hyperactivity disorder.
Figure 2.
Figure 2.. DOT1L variants structural and functional analyses and dot1l controls behavioral responses to sensory stimuli in zebrafish.
(A) Structure of the DOT1L nucleosome complex (PDBID: 6NJ9) highlighting the position of variants (variants = cyan spheres, DOT1L = purple, DNA = grey, H2A = yellow, H2B = red, H3 = blue, H4 = dark green, ubiquitin [UB] = orange, and S-adenosylmethionine [SAM] = green sticks). (B) Conservation of amino acids with variants in the catalytic domain across species. (C) Local environment of each catalytic domain missense variant (nearby residues = dark blue, defined as residues <=5 angstroms away from the variant residue). (D) Predicted stability change from missense variants and the number of nearby residue contacts. (E) Methyltransferase (MTase) activity of human DOT1L or variant DOT1L (D157N) on unmodified nucleosomes. Graph shows mean ± SE (n = 3/condition, unpaired two-tailed t-test). RLU = relative light units. (F) H3K79 methyl levels in patient-derived fibroblasts from individual 6 (p.D157N variant) beside an age- and sex-matched control. (G) H3K79 methyl levels in Neuro-2A cells with variant Dot1l (D157N) overexpressed, wildtype (WT) Dot1l, or empty vector control. (H) Schematic of Cas9 targeting of dot1l and subsequent behavioral phenotyping paradigm performed on zebrafish. (I) Average distance traveled during dark flashes in dot1l crispant and control zebrafish (control: n = 113, dot1l crispant: n = 98; 3 independent experiments, unpaired two-tailed t-test). (J) Area under the curve of response to increasing stimulus intensity in dot1l crispant and control zebrafish (control: n = 113 control, dot1l crispant: n = 95; 3 independent experiments, Kruskal-Wallis Test). (K) Prepulse inhibition (PPI) to a medium intensity prepulse acoustic stimulus in dot1l crispant and control zebrafish (control: n = 113 control, dot1l crispant: n = 95; 3 independent experiments, Kruskal-Wallis Test). All box plot bounds indicate the 25th and 75th percentiles, the black line shows the median, and whiskers extend to the minimum and maximum value that are no further than 1.5X interquartile range. **p<0.01, ****p<0.0001.
Figure 3.
Figure 3.. Dot1l promotes glutamatergic synaptic gene expression in neurons.
(A) Volcano plot showing differentially expressed genes (DEGs) from primary cortical neurons infected with Dot1l shRNA or non-targeting control shRNA (n = 3 biological replicates/condition). Light green dots represent genes with log2(Fold change) >= 1 and FDR <= 0.05 and dark green dots represent genes with log2(Fold change) >= 0.5 and FDR <= 0.05. (B) Biological process gene ontology analysis of down-regulated genes. (C) Gene set enrichment analysis of genes involved in glutamatergic synaptic transmission. NES = normalized enrichment score. (D) RNA-seq genome browser tracks for down-regulated glutamatergic genes including: Drd2, Myo5a, Psen1, Dgkz, Grm2, Cacng3, Gria2, and Adora1.
Figure 4.
Figure 4.. Dot1l promotes neuronal arborization, GluA2 levels, and neuronal activity.
(A) Representative images of primary cortical neurons transfected with Dot1l shRNA or non-targeting control shRNA. Scale bar = 20 μm. (B) Number of branch intersections per radius of shRNA transfected neurons (control: n = 33 neurons from 5 biological replicates, Dot1l shRNA: n = 24 neurons from 5 biological replicates). (C) Area under the curve (AUC) quantification of (B) (control: n = 33 neurons from 5 biological replicates, Dot1l shRNA: n = 24 neurons from 5 biological replicates, mixed effect model). (D) Representative images of GluA2 staining in shRNA-transfected neurons. (E) Quantification of GluA2 staining in (D) (control: n = 27 neurons from 3 biological replicates, Dot1l shRNA: n = 22 neurons from 3 biological replicates, Kruskal-Wallis Test). (F) Schematic of multielectrode array apparatus and neuronal activity metrics. (G) Representative raster plot showing spike activity on individual electrodes in Dot1l shRNA infected neurons and controls (black line = spike, blue line = single electrode burst, gray = network burst, minimum of 5 spikes with inter-spike interval <100ms). (H-J) Activity metrics in shRNA infected neurons at 20 days in vitro that include (H) burst frequency (unpaired two-tailed t-test), (I) network burst frequency (unpaired two-tailed t-test), (J) and network normalized interquartile range (IQR) (control: n = 6 wells from 3 biological replicates, Dot1l shRNA: n= 6 wells from 3 biological replicates, Kruskal-Wallis Test). All box plot bounds indicate the 25th and 75th percentiles, the black line shows the median, and whiskers extend to the minimum and maximum value. *p<0.05, ***p<0.001, ****p<0.0001.
Figure 5.
Figure 5.. Dot1l regulates cortical gene expression in a sex-specific manner.
(A) UMAP (Uniform Manifold Approximation and Projection for Dimension Reduction) of single nucleus RNA sequencing from 10-week-old Dot1l HET and control mouse cortex (n = 6 cortices per group [3 males, 3 females). (B) Proportion of nuclei in Dot1l HET and control in each cluster. Red indicates fold difference (FD) > 1.8 and FDR < 0.05. (C) Number of up- and down-regulated differentially expressed genes (DEGs) in excitatory clusters. (D) Volcano plot showing DEGs from Dot1l HET and control combined excitatory clusters. (E) Biological process gene ontology analysis of down-regulated DEGs from combined excitatory clusters. (F) Volcano plot showing DEGs from Dot1l HET and control from Ex_L2/3_1. (G) Biological process gene ontology analysis of down-regulated DEGs from Ex_L2/3_1. (H) UMAP clustering with dots representing nuclei from Dot1l HET or control separated by sex. (I) Volcano plots showing DEGs from male or female Dot1l HET and control from combined excitatory clusters. (J-K) Overlap of male and female (J) down and (K) up DEGs from combined excitatory clusters (hypergeometric test). (L-M) Overlap of (L) male and (M) female DEGs with genes up-regulated in male or female controls. (N) Dot plot showing genes elevated in male or female control mice that are sex-specifically down-regulated in Dot1l HETs. ****p < 0.00001.
Figure 6.
Figure 6.. Monoallelic Dot1l loss causes a global reduction of H3K79me2.
(A) Metaplot of H3K79me2 ChIP in control cortical nuclei binned by expression level. Plot shows read counts per million mapped reads (RPM) between the transcription start site (TSS) and transcription end site (TES) ± 2 kb (n = 4 biological replicates, 2 females, 2 males/genotype). Not expressed was defined as genes with an average expression < 0.01 by single nucleus RNA sequencing (n = 7,824 genes). Remaining genes were binned into three equally sized groups by average expression (n = 5,055 genes per group). (B) H3K79me2 log2(counts) binned by gene expression level (one-way ANOVA with post hoc pairwise t-tests with Bonferroni correction). (C) Metaplot of H3K79me2 ChIP in control and Dot1l HET cortical nuclei in all genes. (D) H3K79me2 log2(counts) binned by gene expression level in Dot1l HET and control (two-way ANOVA with post hoc Tukey HSD). (E) H3K79me2 log2(counts) binned by down DEGs, non-DEGS, and up DEGs (two-way ANOVA with post hoc Tukey HSD). (F) H3K79me2 log2(fold change) of Dot1l HET in comparison to controls (one-way ANOVA with post hoc pairwise t-tests with Bonferroni correction). (G) Metaplot of H3K79me2 ChIP in male and female control and Dot1l HET cortical nuclei. (H) H3K79me2 log2(counts) in male Dot1l HET and control binned by female down DEGs, male down DEGs, and shared DEGs (two-way ANOVA with post hoc Tukey HSD). (I) H3K79me2 log2(counts) in female Dot1l HET and control binned by female down DEGs, male down DEGs, and shared DEGs (two-way ANOVA with post hoc Tukey HSD). (J) H3K79me2 ChIP-seq genome browser tracks for Ngrn, Chrm3, and Cdh9. *p<0.05, **p < 0.01, ***p<0.001, ****p<0.0001.
Figure 7.
Figure 7.. Monoallelic Dot1l loss alters early vocalization development and sociability.
(A) Weight during first two weeks post-birth in male and female mice (male [control: n = 13, Dot1l HET: n = 16]; female [control: n = 15, Dot1l HET: n = 23], repeated measures ANOVA). (B) Total number of ultrasonic vocalizations (USVs) in P6 male and female pups (male [control: n = 15, Dot1l HET: n = 22]; female [control: n = 22, Dot1l HET: n = 22], Kruskal-Wallis Test). (C) Average volume in decibels (dB) of USVs in male and female pups (unpaired two-tailed t-test). (D) Average frequency in kilohertz (kHz) of calls in male and female pups. (E) Percent chevron calls out of total calls in male and female pups (Kruskal-Wallis Test). (F) Time to right self in negative geotaxis assay during development in male and female pups (male [control: n = 13, Dot1l HET: n = 16]; female [control: n = 15, Dot1l HET: n = 23], repeated measures ANOVA). (G) Total activity measured from beam breaks during 10-minute open field assay in 4-week-old male and female mice (male [control: n = 13, Dot1l HET: n = 16]; female [control: n = 15, Dot1l HET: n = 23], Kruskal-Wallis Test). (H) Percent of time spent in open arms of the elevated zero maze in male and female mice (unpaired two-tailed t-test). (I) Percent spontaneous alternations out of the total number of triads possible in male and female mice. (unpaired two-tailed t-test). (J) Discrimination index between interaction time with the mouse or rock cylinder during the three-chamber social choice assay in male and female mice (Kruskal-Wallis Test). All box plot bounds indicate the 25th and 75th percentiles, the black line shows the median, and whiskers extend to the minimum and maximum value that are no further than 1.5X interquartile range. *p<0.05, **p<0.01.
Figure 8.
Figure 8.. Monoallelic loss of Dot1l in forebrain neurons alters language development and sociability.
(A) Total number of ultrasonic vocalizations (USVs) in P6 male and female pups (male [control: n = 15, Dot1l cKO: n = 14]; female [control: n = 21, Dot1l cKO: n = 19], Kruskal-Wallis Test). (B) Average volume in decibels (dB) of USVs in male and female pups (unpaired two-tailed t-test). (C) Average frequency in kilohertz (kHz) of calls in male and female pups (unpaired two-tailed t-test). (D) Percent of down calls out of total calls in male pups (Kruskal-Wallis Test). (E) Total activity measured from beam breaks during 10-minute open field assay in 4-week-old male and female mice (male [control: n = 16, Dot1l cKO: n = 16]; female [control: n = 14, Dot1l cKO: n = 14], Kruskal-Wallis Test). (F) Percent of spontaneous alternations out of the total number of triads possible in male and female mice (unpaired two-tailed t-test). (G) Discrimination index between interaction time with the mouse or rock cylinder during the three-chamber social choice assay in male and female mice (unpaired two-tailed t-test). (H) Freezing activity after 2 weeks post-contextual fear conditioning in male and female mice (unpaired two-tailed t-test). All box plot bounds indicate the 25th and 75th percentiles, the black line shows the median, and whiskers extend to the minimum and maximum value that are no further than 1.5X interquartile range. *p<0.05.

References

    1. Megan Cleaton MA, Kirby A. Why Do We Find it so Hard to Calculate the Burden of Neurodevelopmental Disorders. J Child Dev Disord. 2018;04(03). doi: 10.4172/2472-1786.100073 - DOI
    1. Francés L, Quintero J, Fernández A, et al. Current state of knowledge on the prevalence of neurodevelopmental disorders in childhood according to the DSM-5: a systematic review in accordance with the PRISMA criteria. Child Adolesc Psychiatry Ment Health. 2022;16:27. doi: 10.1186/s13034-022-00462-1 - DOI - PMC - PubMed
    1. Straub L, Bateman BT, Hernandez-Diaz S, et al. Neurodevelopmental Disorders Among Publicly or Privately Insured Children in the United States. JAMA Psychiatry. 2022;79(3):232–242. doi: 10.1001/jamapsychiatry.2021.3815 - DOI - PMC - PubMed
    1. Axelrad Daniel, Adams Kristen, Chowdhury Farah, et al. America’s Children and the Environment, Third Edition.
    1. Stessman HAF, Xiong B, Coe BP, et al. Targeted sequencing identifies 91 neurodevelopmental-disorder risk genes with autism and developmental-disability biases. Nat Genet. 2017;49(4):515–526. doi: 10.1038/ng.3792 - DOI - PMC - PubMed

Publication types

LinkOut - more resources