[Preprint]. 2024 Nov 1:rs.3.rs-5329081.
doi: 10.21203/rs.3.rs-5329081/v1.

Transcriptional Regulation of Protein Synthesis by Mediator Kinase Represents a Therapeutic Vulnerability in MYC-driven Medulloblastoma

Affiliations

Transcriptional Regulation of Protein Synthesis by Mediator Kinase Represents a Therapeutic Vulnerability in MYC-driven Medulloblastoma

Dong Wang et al. Res Sq. .

Abstract

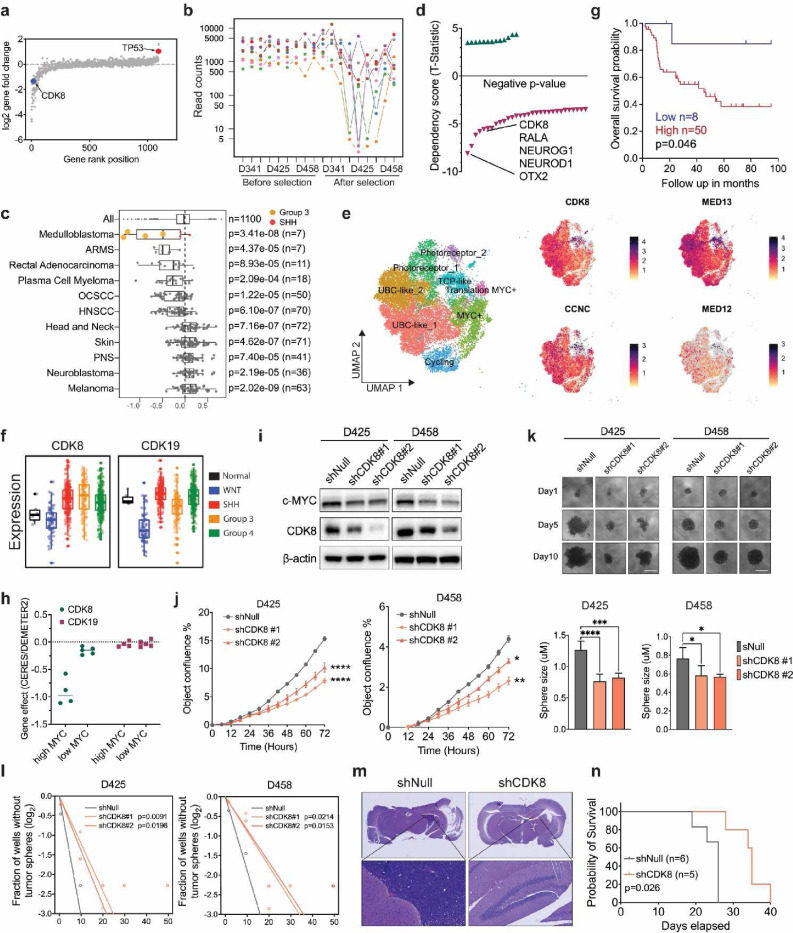
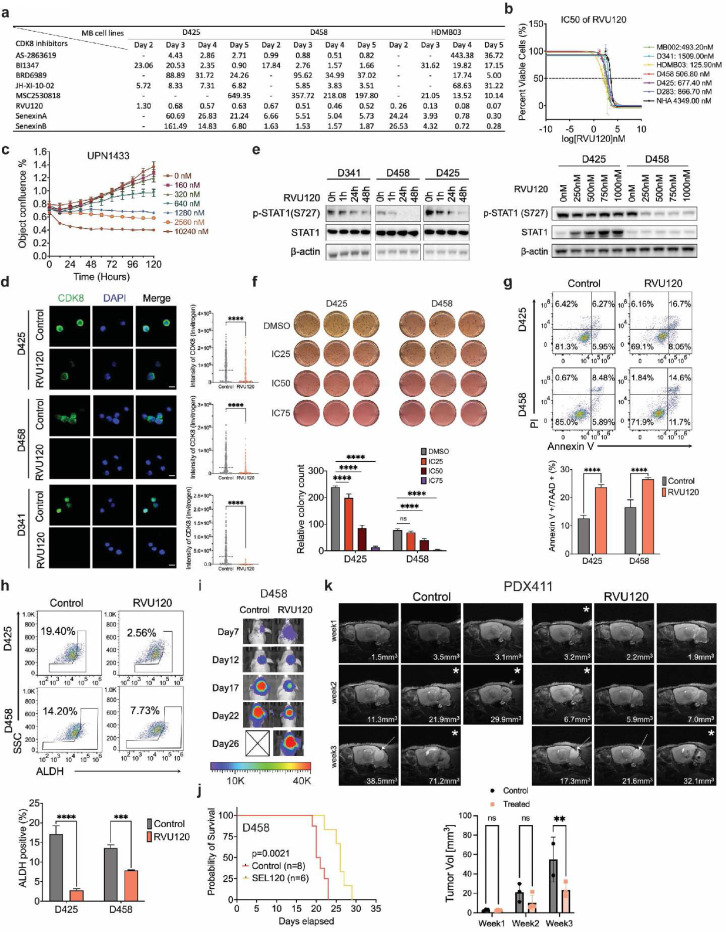
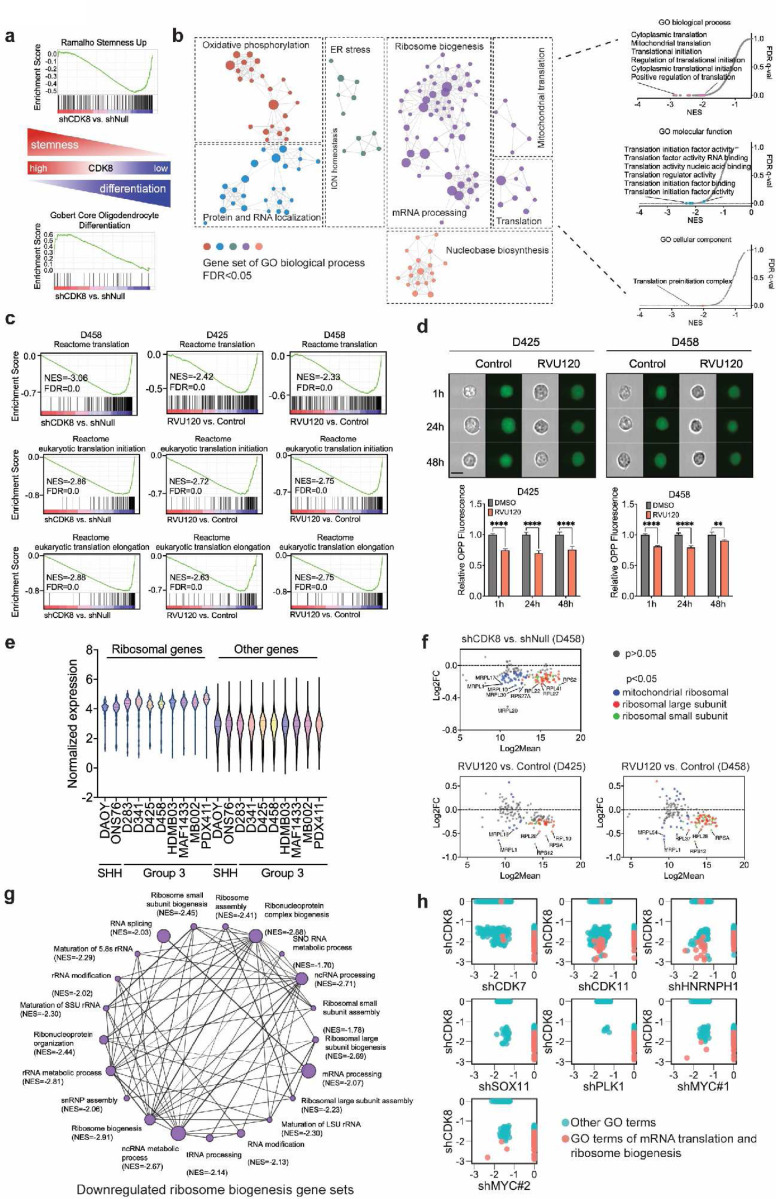
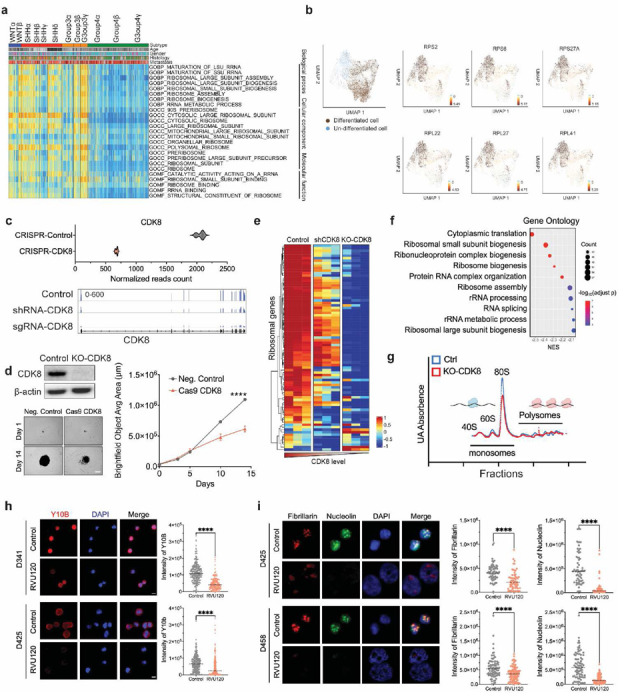
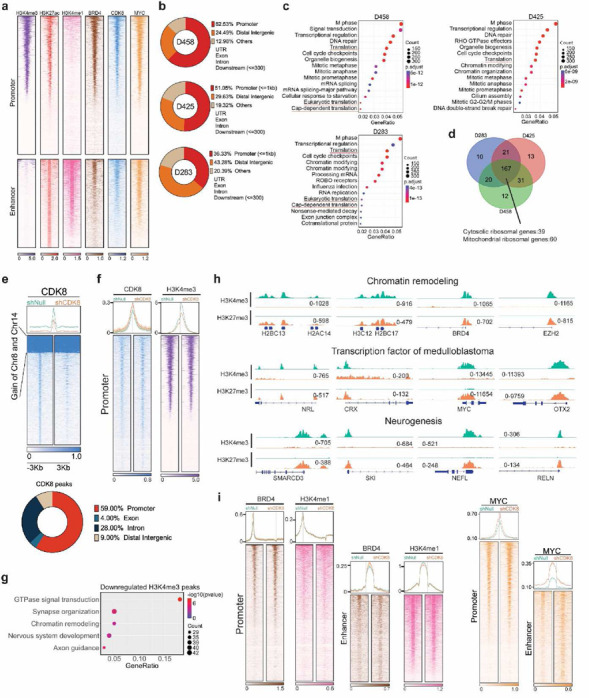
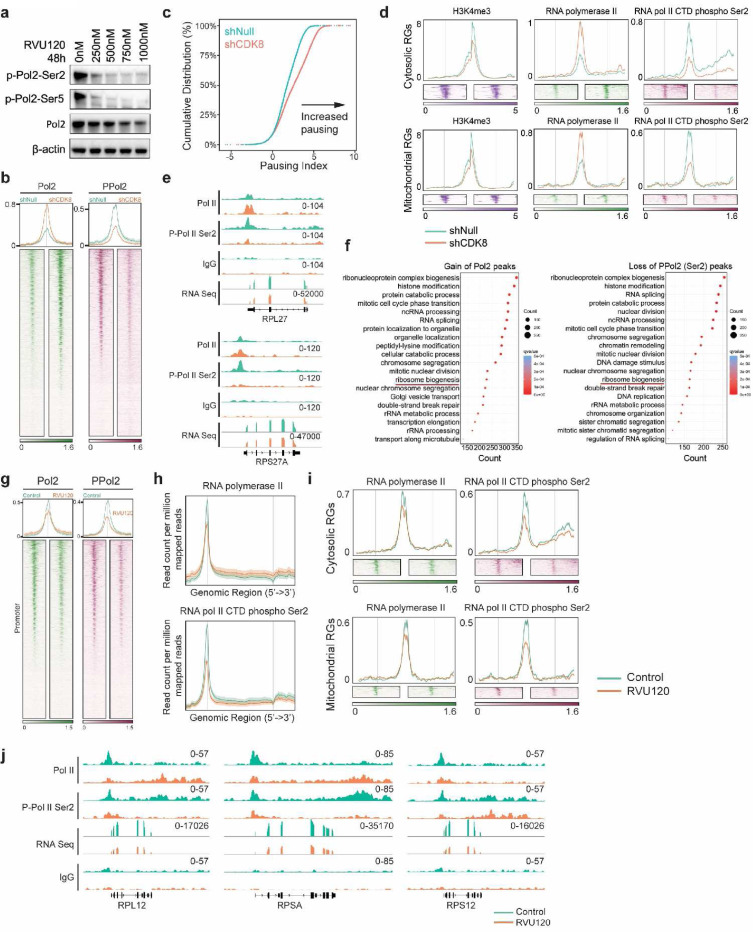
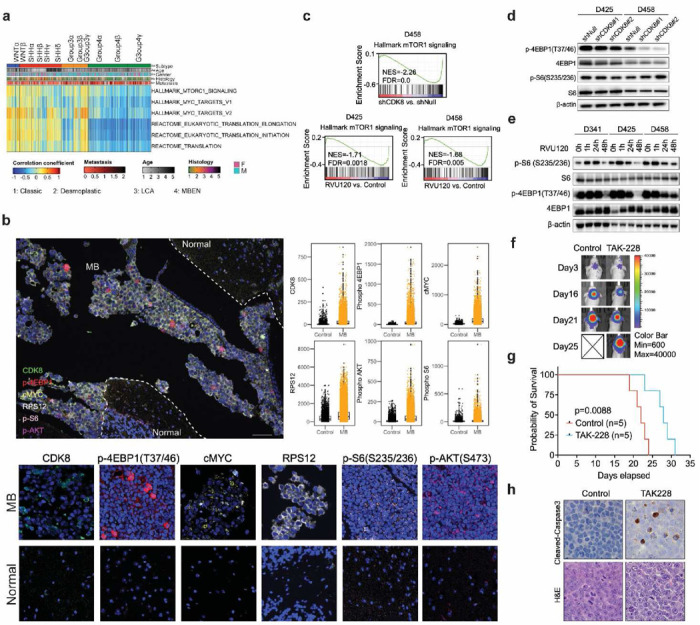
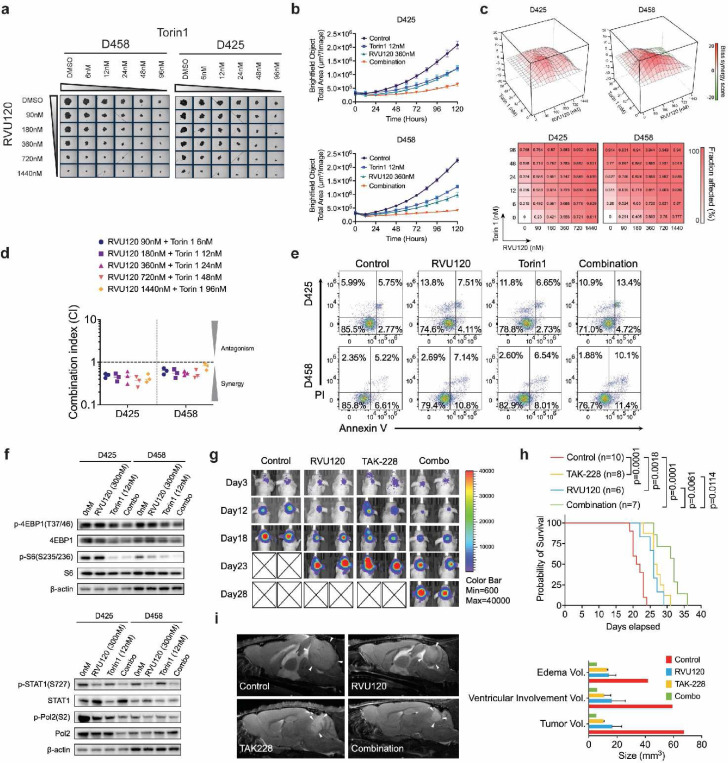
MYC-driven medulloblastoma (MB) is a highly aggressive cancer type with poor prognosis and limited treatment options. Through CRISPR-Cas9 screening of MB cell lines, we identified the Mediator-associated kinase CDK8 as a critical regulator of MYC-driven MB. Loss of CDK8 substantially reduces MYC expression, induces pronounced transcriptional changes, suppresses monosome assembly, and decreases ribosome biogenesis and protein synthesis, consequently inhibiting MB growth. Mechanistically, CDK8 regulates the occupancy of RNA polymerase II at specific chromatin loci, facilitating an epigenetic alteration that promotes the transcriptional regulation of ribosomal genes. Targeting CDK8 effectively diminishes the stem-like neoplastic cells characterized by hyperactive ribosome biogenesis. Furthermore, we demonstrated that the combined inhibition of CDK8 and mTOR synergizes to optimize therapeutic outcomes in vivo and in vivo. Overall, our findings establish a connection between CDK8-mediated transcriptional regulation and mRNA translation, suggesting a promising new therapeutic approach that targets the protein synthesis for MYC-driven MB.


Conflict of interest statement

Competing Interests DW, CR, BV, SV, ND, AP, BB, AS, NS, ED, YL, and RV report NO affiliations with or involvement in any organization or entity with any financial interest in the subject matter or materials discussed in this manuscript. KK, MM and TR are employees of RVYU therapeutics.

Figures

Fig. 1:
Fig. 1:. CDK8 is a specific vulnerability in MYC-driven medulloblastoma.
a. Log-fold change of gene expression in CRISPR-Cas9 screening across D425, D458, and D341 MB cell lines. b. The read counts of sgRNAs of CDK8. Each dot represents a sgRNA targeting CDK8. c. The enriched lineages plot from DepMap indicates the DEMETER2 score of CDK8 across cancer types. n indicates the number of cell lines plotted in that lineage. d. The Dependency score from DepMap specific for MB. Labels below zero denote genes that are essential for MB growth. e. scRNA-Seq analysis of GP3 cells from seven patient samples. f. Microarray analysis of CDK8 and CDK19 expression in four subgroups of 763 MB patient samples. n = 6 normal samples were collected by our institution. g. Kaplan-Meier analysis demonstrating the association between CDK8 and survival within the MYC-high patient cases. h. The DEMETER2 scores of CDK8 and CDK19 in high MYC and low MYC MB cell lines. i. Immunoblot demonstrating the protein level of CDK8 in MB cells with the loss of CDK8. j. Growth of shNull and shCDK8-transduced D425 or D458 cells assayed in Incucyte live-cell analysis system. n = 5. Mean ± SD. Statistical analysis: one-way ANOVA. k. Images of neurosphere size in CDK8 knockdown and control cells are shown. Scale bar, 400 μm. Barplot is for Day 10. l. Sphere formation efficiency and self-renewal capacity were measured using extreme in vitro limiting dilution assays (ELDA) in shNull or shCDK8 transfected MB cell lines. P values were determined using the likelihood ratio test. m. Images showing a reduction in tumor formation of shCDK8 xenograft. Three mice from each group were sacrificed 20 days after tumor implantation. n. Kaplan-Meier analysis of D458 xenograft mice injected with shNull or shCDK8 cells.
Fig. 2:
Fig. 2:. RVU120 suppresses the growth of medulloblastoma cells.
a. IC50 determination of various CDK8 inhibitors in MB cell lines. Unit: μmol. b. IC50 of RVU120 at 72 h in MB cell lines and NHA cells. c. Dose-dependent proliferation curve of RVU120 treated primary MB cells from a G3-MB patient. d. Immunofluorescence of CDK8 (green) and DAPI (blue). MB cells were treated with IC50 RVU120 for 48 h. Scale bar, 10 μm. e. Immunoblot demonstrates the p-STAT1(S727) protein level with treatment of RVU120 across MB cell lines. f. Methylcellulose assay in MB cells treated with RVU120. g. Annexin V apoptosis assay. MB cells were treated with IC50 RVU120 for 48 h. h. Identification of the brain tumor-initiating cell fraction in MB cells by ALDH expression demonstrates a decrease in the ALDH+ fraction following IC50 RVU120 treatment for 48 hours. i. Representative bioluminescence images of mice treated with RVU120 (40mg/kg, daily, oral gavage) compared with vehicle. j. Kaplan–Meier survival curves for animals treated with control or RVU120. k. Representative axial T2-weighted turboRARE MRI sequences of mice treated with RVU120 or vehicle. PDX411 xenograft mice were treated with RVU120 (40 mg/kg) for 14 days, starting with the first MRI scan. The asterisks indicating that the mice exhibited a spongy tissue texture. An adjusted texture analysis was performed to measure the tumor size. One control mice died before the final scan.
Fig. 3:
Fig. 3:. CDK8 depletion leads to repression of protein synthesis.
a. GSEA showing the depletion of CDK8 reduced stemness gene sets and promoted differentiation gene sets in MB cells. b. The alterations in gene sets in D458 cells transfected with shCDK8 compared to the control. c. GSEA showed a downregulation of Reactome pathways associated with mRNA translation following genetic knockdown or pharmacological inhibition of CDK8 in MB cells. d. OPP assay for IC50 in RVU120-treated MB cells was compared with control cells, as determined by flow cytometry using FlowSight. Scale bar, 20 μm. e. The normalized expression of ribosomal genes was compared to that of all other genes in MB cells. f. RNA-Seq analysis demonstrated alterations in the expression of mitochondrial and cytoplasmic ribosomal genes. g. The GSEA network revealed downregulation of gene sets associated with ribosome biogenesis in shCDK8 D458 cells compared to shNull D458 cells. The plot was generated using Cytoscape, where each node represents the gene counts within specific gene sets and each line represents shared genes. h. GSEA indicated alterations in GO biological process gene sets (FDR < 0.05) following the knockdown of CDK8, MYC, CDK7, CDK11, HNRNPH1, SOX11, or PLK1.
Fig. 4:
Fig. 4:. CDK8 depletion leads to repression of ribosome biogenesis.
a. Gene set variation analysis of patient samples (n=763) revealed that the MYC-overexpressing subtypes Group3β and 3γ were enriched with gene sets related to ribosome biogenesis. b. Single-cell RNA-Seq analysis using MB patient samples demonstrates differentiated cells and undifferentiated cell populations (left). Representative expression of ribosomal genes is presented (right). c. CRISPR knockout of CDK8 in D458 cells. RNA-seq analysis shows the expression of CDK8 in knockout cells compared to control cells. IGV displays the short reads mapping to CDK8 exons in shRNA-CDK8 transfected, sgRNA-CDK8 transfected, and control cells. d. Immunoblot analysis of CDK8 in control and sgRNA-CDK8 transfected D458 cells. Images of neurosphere size in CDK8 knockout and control cells are shown. Scale bar, 200 μm. Knockout of CDK8 decreases the proliferation of D458 cells. e. RNA-Seq analysis showing the expression of cytosolic ribosomal genes in shRNA-CDK8 transfected, sgRNA-CDK8 transfected, and control D458 cells. f. GSEA indicates the top 10 GO biological process gene sets in knockout CDK8 D458 cells compared to control D458 cells. g. Polysome profiling of lysates isolated from CDK8 knockout D458 cells and control cells shows that KO-CDK8 alters the assembly of 80 monosomes. h. Immunofluorescence of Y10B (red, anti-ribosomal RNA) and DAPI (blue) at 40X. MB cells were treated with the IC50 of RVU120 for 48 h. Scale bar, 10 μm. i. Immunofluorescence of Fibrillarin (red), Nucleolin (green) and DAPI (blue) at 40X magnification. D425 and D458 cells were treated with IC50 RVU120 for 48 h. Mean ± SD. Scale bar, 10 μm. Statistical analysis: Mann-Whitney Wilcoxon test.
Fig. 5:
Fig. 5:. Chromatin binding profiles of CDK8 in MB cells.
a. Heatmaps showing CUT&RUN signals of CDK8, H3K4me3, H3K4me1, H3K27ac, BRD4, and MYC in D458 MB cells. The signals were displayed within a region spanning ± 3kb around the transcription start site (TSS). b. Pie chart showing CDK8 peaks are localized at promoter and enhancer. c. Pathway enrichment analysis of CDK8 binding genes inferred from CUT&RUN. Translation pathways are enriched in MB cell lines. d. Venn-diagram showing overlapping of CDK8 binding genes associated with mRNA translation pathways. e. Heatmaps displaying genome-wide binding CUT&RUN signals of CDK8 in CDK8 knockdown D458 cells compared to control cells. The signals are displayed within a region spanning ± 3kb around the transcription start site (TSS). f. Heatmaps displaying CUT&RUN signals of CDK8 and H3K4me3 in D458 cells with CDK8 knockdown compared to control cells at promoter regions. g. Pathway enrichment analysis showing the top pathways associated with the loss of H3K4me3 peaks. h. Representative examples of genes with H3K4me3 and H3K27me3 peaks in chromatin remodeling, transcription factors, and neurogenesis pathways following CDK8 knockdown. i. Heatmaps showing CUT&RUN signals of BRD4, H3K4me1, and MYC in D458 MB cells following CDK8 knockdown.
Fig. 6:
Fig. 6:. CDK8 transcriptionally regulates the expression of ribosomal genes.
a. Immunoblot showing the levels of Pol II and phospho-Pol II in D458 cells following treatment with RVU120. b. Heatmaps showing CUT&RUN signals of Pol II and phospho-Pol II in D458 cells with CDK8 knockdown compared to control cells at promoter regions. c. Empirical cumulative distribution function (ECDF) plot shows significant increase in promoter-proximal pausing following CDK8 knockdown. d. Average distribution and heatmaps of H3K4me3, Pol II, and phospho-Pol II signals on ribosomal genes. e. Representative examples of Pol II and phospho-Pol II binding sites on ribosomal genes observed following CDK8 knockdown. f. Enrichment analysis identifies mRNA translation pathways are enriched among genes with an increase in Pol II peaks or a decrease in phospho-Pol II following CDK8 knockdown. g. Heatmaps showing CUT&RUN signals of RNA Pol II and phospho-RNA Pol II in D458 MB cells treated with IC50 RVU120 for 48 hours. h. Average distribution of RNA Pol II and phospho-RNA Pol II peaks showing the alteration of RNA Pol II and phospho-RNA Pol II signals across the gene body following the treatment of RVU120. i. Average distribution and heatmaps of RNA Pol II and phospho-RNA Pol II signals on cytosolic and mitochondrial ribosomal genes following the treatment of RVU120. j. Representative examples of RNA Pol II and phospho-RNA Pol II binding sites on ribosomal genes observed following the treatment of RVU120.
Fig. 7:
Fig. 7:. CDK8 regulates mTOR signaling in MYC-driven medulloblastoma.
a. Gene set variation analysis of patient samples (n=763) revealed that the MYC-overexpressing subtypes Group3β and 3γ were enriched with gene sets of MYC and mTOR signaling. b. Multiplex IHC on G3-MB patient samples using CDK8, p-4EBP1, c-MYC, RPS12, p-S6, and p-AKT antibodies. p<0.05 in all biomarker groups. Scale bar, 100 μm. Statistical analysis: unpaired t-test. c. GSEA plots of representative gene sets involved in mTOR signaling following CDK8 depletion. Normalized enrichment score (NES) and false discovery rate (FDR) are indicated. d. Immunoblot showing the levels of p-4EBP1 and p-S6 following CDK8 knockdown. e. Immunoblot showing the levels of p-4EBP1 and p-S6 upon treatment with RVU120. f. Representative bioluminescence images of mice treated with TAK-228 (1mg/kg, daily, oral gavage) compared with those of the control cohort. g. Kaplan–Meier survival curves for animals treated with control or TAK-228. Statistical analysis: Log-rank test. h. IHC analyses of cleaved caspase 3 in xenografts mice. Three mice from each group were sacrificed 18 days after tumor implantation. Original magnification, ×40.
Fig. 8:
Fig. 8:. Synergistic targeting of CDK8 and mTOR in MYC-Driven medulloblastoma.
a. Dose-dependent assay of the combined treatment with RVU120 and Torin1 on Day 5. b. Real-time proliferation assay quantifying the combined treatment with RVU120 and Torin1. c. Heatmap representation of the Fraction Affected and the Bliss interaction index across the five-point dose range of RVU120 and Torin1. Mean values of triple biological experiments are shown. d. The combination index of RVU120 and Torin1 using chou-talalay method. The mean combination index was determined from three independent experiment. e. Apoptosis assay following combined treatment with RVU120 and Torin1. MB cells were treated for 48 h before staining with PI and Annexin V. f. Effects of the combination of RVU120 and Torin1 on protein synthesis markers, phospho-Pol2 and phospho-STAT1, in MB cells after 48 h of treatment. g. The nude mice injected with D458 cells were treated with vehicle, RVU120 (40 mg/kg), TAK-228 (1 mg/kg), or their combination. h. Kaplan-Meier survival curve of D458 xenograft mice. Statistical analysis: log-rank (Mantel-Cox) test. i. Representative Sagittal T2-weighted turboRARE MRI of D458 xenografted mice at 22 days. White arrows indicate tumors. MRI volumetric analysis is shown.

References

    1. Hovestadt V. et al. Medulloblastomics revisited: biological and clinical insights from thousands of patients. Nat Rev Cancer 20, 42–56 (2020). 10.1038/s41568-019-0223-8 - DOI - PMC - PubMed
    1. Cho Y. J. et al. Integrative genomic analysis of medulloblastoma identifies a molecular subgroup that drives poor clinical outcome. J Clin Oncol 29, 1424–1430 (2011). 10.1200/JCO.2010.28.5148 - DOI - PMC - PubMed
    1. Northcott P. A. et al. Medulloblastoma comprises four distinct molecular variants. J Clin Oncol 29, 1408–1414 (2011). 10.1200/JCO.2009.27.4324 - DOI - PMC - PubMed
    1. Northcott P. A. et al. Medulloblastoma. Nat Rev Dis Primers 5, 11 (2019). 10.1038/s41572-019-0063-6 - DOI - PubMed
    1. Llombart V. & Mansour M. R. Therapeutic targeting of “undruggable” MYC. EBioMedicine 75, 103756 (2022). 10.1016/j.ebiom.2021.103756 - DOI - PMC - PubMed

Publication types

LinkOut - more resources