Development of a prognostic model for early-stage gastric cancer-related DNA methylation-driven genes and analysis of immune landscape
- PMID: 39575189
- PMCID: PMC11579923
- DOI: 10.3389/fmolb.2024.1455890
Development of a prognostic model for early-stage gastric cancer-related DNA methylation-driven genes and analysis of immune landscape
Abstract
Background and aims: This study aimed to develop a prognostic model based on DNA methylation-driven genes for patients with early-stage gastric cancer and to examine immune infiltration and function across varying risk levels.
Methods: We analyzed data from stage I/II gastric cancer patients in The Cancer Genome Atlas which included clinical details, mRNA expression profiles, and level 3 DNA methylation array data. Using the empirical Bayes method of the limma package, we identified differentially expressed genes (DEGs), and the MethylMix package facilitated the identification of DNA methylation-driven genes (DMGs). Univariate Cox regression and LASSO (least absolute shrinkage and selector operation) analyses were utilized to pinpoint critical genes. A risk score prediction model was formulated using two genes that demonstrated the most significant hazard ratios (HRs). Model performance was evaluated within the initial cohort and verified in the GSE84437 cohort; a nomogram was also constructed based on these genes. We further examined 50 methylation sites associated with three CpG islands in C1orf35 and 14 methylation sites linked to one CpG island in FAAH. The CIBERSORT package was employed to identify immune cell clusters in the prediction model.
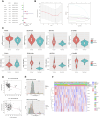
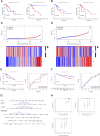
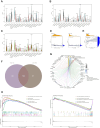
Results: A total of 176 DNA methylation-driven genes were refined down to a four-gene signature (ZC3H12A was hypermethylated; GATA3, C1orf35, and FAAH were hypomethylated), which exhibited a significant correlation with overall survival (OS), as evidenced by p-values below 0.05 following univariate Cox regression and LASSO analysis. Specifically, for the risk score prediction model, C1orf35, which had the highest hazard ratio (HR = 2.035, p = 0.028), and FAAH, with the lowest hazard ratio (HR = 0.656, p = 0.012), were selected. The Kaplan-Meier analysis demonstrated distinct survival outcomes between the high-risk and low-risk score groups. The model's predictive accuracy was confirmed with an area under the curve (AUC) of 0.611 for 3-year survival and 0.564 for 5-year survival. Notably, the hypomethylation of the three CpG islands in C1orf35 and the single CpG island in FAAH was significantly different in stage I/II gastric cancer patients compared to normal tissues. Additionally, the high-risk score group showed a notable association with resting CD4 memory T cells.
Conclusion: Promoter hypomethylation of C1orf35 and FAAH in early-stage gastric cancer underscores their potential as biomarkers for accurate diagnosis and treatment. The developed predictive model employing genes affected by DNA methylation serves as a crucial independent prognostic factor in early-stage gastric cancer.
Keywords: C1orf35; DNA methylation-driven gene; FAAH; gastric cancer; prognosis.
Copyright © 2024 Su, Lin, Ye, Liang, Yu, Wan and Hou.
Conflict of interest statement
The authors declare that the research was conducted in the absence of any commercial or financial relationships that could be construed as a potential conflict of interest.
Figures


Similar articles
-
Development and Validation of a Prognostic Nomogram for Gastric Cancer Based on DNA Methylation-Driven Differentially Expressed Genes.Int J Biol Sci. 2020 Feb 10;16(7):1153-1165. doi: 10.7150/ijbs.41587. eCollection 2020. Int J Biol Sci. 2020. PMID: 32174791 Free PMC article.
-
Development and Validation of a Prognostic Nomogram Based on DNA Methylation-Driven Genes for Patients With Ovarian Cancer.Front Genet. 2021 Sep 9;12:675197. doi: 10.3389/fgene.2021.675197. eCollection 2021. Front Genet. 2021. PMID: 34567062 Free PMC article.
-
A nomogram model based on the number of examined lymph nodes-related signature to predict prognosis and guide clinical therapy in gastric cancer.Front Immunol. 2022 Nov 2;13:947802. doi: 10.3389/fimmu.2022.947802. eCollection 2022. Front Immunol. 2022. PMID: 36405735 Free PMC article.
-
Identification of cuproptosis-related subtypes, construction of a prognosis model, and tumor microenvironment landscape in gastric cancer.Front Immunol. 2022 Nov 21;13:1056932. doi: 10.3389/fimmu.2022.1056932. eCollection 2022. Front Immunol. 2022. PMID: 36479114 Free PMC article.
-
Identification of DNA methylation-driven genes and construction of a nomogram to predict overall survival in pancreatic cancer.BMC Genomics. 2021 Nov 3;22(1):791. doi: 10.1186/s12864-021-08097-w. BMC Genomics. 2021. PMID: 34732125 Free PMC article.
Cited by
-
Beyond Biomarkers: Machine Learning-Driven Multiomics for Personalized Medicine in Gastric Cancer.J Pers Med. 2025 Apr 24;15(5):166. doi: 10.3390/jpm15050166. J Pers Med. 2025. PMID: 40423038 Free PMC article. Review.
-
Identification of key therapeutic targets in nicotine-induced intracranial aneurysm through integrated bioinformatics and machine learning approaches.BMC Pharmacol Toxicol. 2025 Apr 17;26(1):86. doi: 10.1186/s40360-025-00921-3. BMC Pharmacol Toxicol. 2025. PMID: 40247428 Free PMC article.
References
-
- Bausys R., Bausys A., Vysniauskaite I., Maneikis K., Stratilatovas E., Strupas K. (2018). Surgical treatment outcomes of patients with T1-T2 gastric cancer: does the age matter when excellent treatment results are expected? World J. Surg. Oncol. 16, 79. 10.1186/s12957-018-1388-4 - DOI - PMC - PubMed
LinkOut - more resources
Full Text Sources
Research Materials

