. 2024 Nov 7:15:1426016.
doi: 10.3389/fimmu.2024.1426016. eCollection 2024.

Ensemble modeling of SARS-CoV-2 immune dynamics in immunologically naïve rhesus macaques predicts that potent, early innate immune responses drive viral elimination

Affiliations

Ensemble modeling of SARS-CoV-2 immune dynamics in immunologically naïve rhesus macaques predicts that potent, early innate immune responses drive viral elimination

Catherine Byrne et al. Front Immunol. .

Abstract

Introduction: An unprecedented breadth of longitudinal viral and multi-scale immunological data has been gathered during SARS-CoV-2 infection. However, due to the high complexity, non-linearity, multi-dimensionality, mixed anatomic sampling, and possible autocorrelation of available immune data, it is challenging to identify the components of the innate and adaptive immune response that drive viral elimination. Novel mathematical models and analytical approaches are required to synthesize contemporaneously gathered cytokine, transcriptomic, flow cytometry, antibody response, and viral load data into a coherent story of viral control, and ultimately to discriminate drivers of mild versus severe infection.

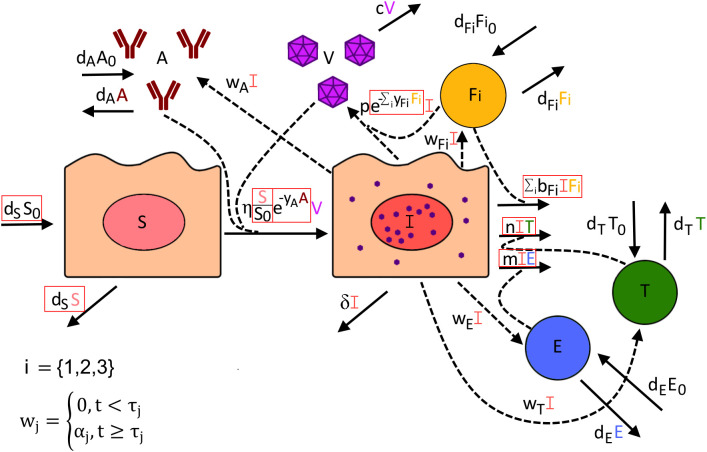
Methods: We investigated a dataset describing innate, SARS-CoV-2 specific T cell, and antibody responses in the lung during early and late stages of infection in immunologically naïve rhesus macaques. We used multi-model inference and ensemble modeling approaches from ecology and weather forecasting to compare and combine various competing models.

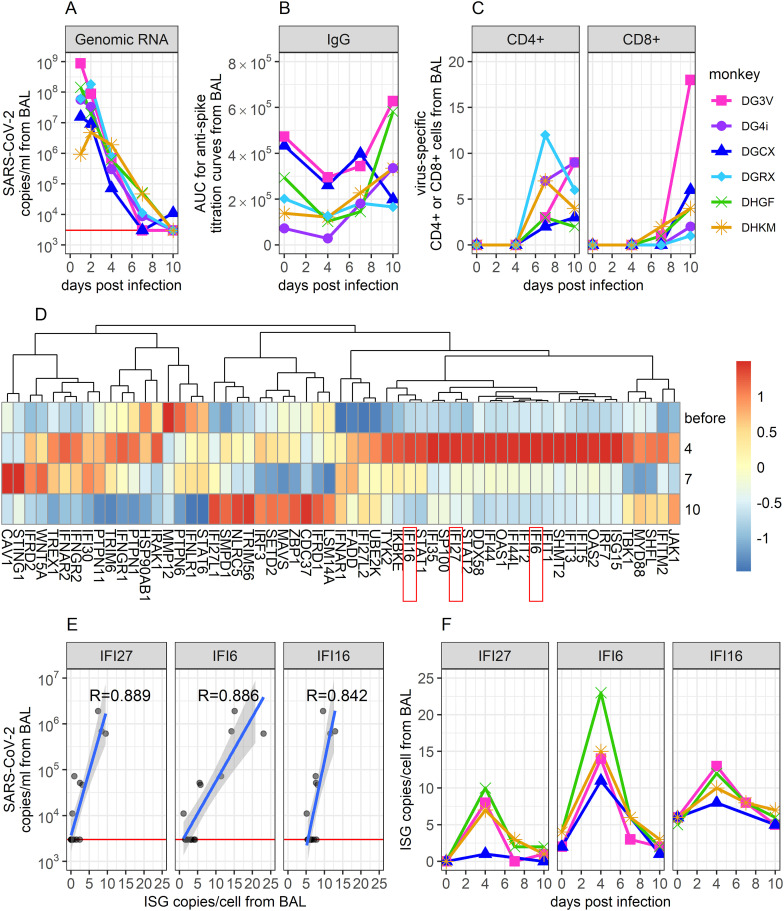
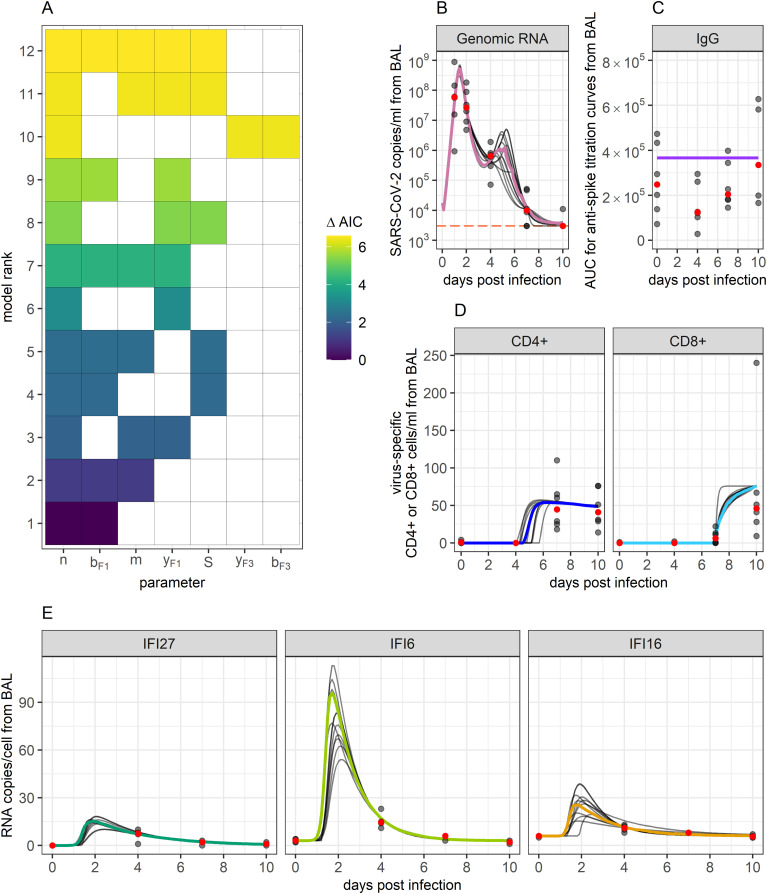
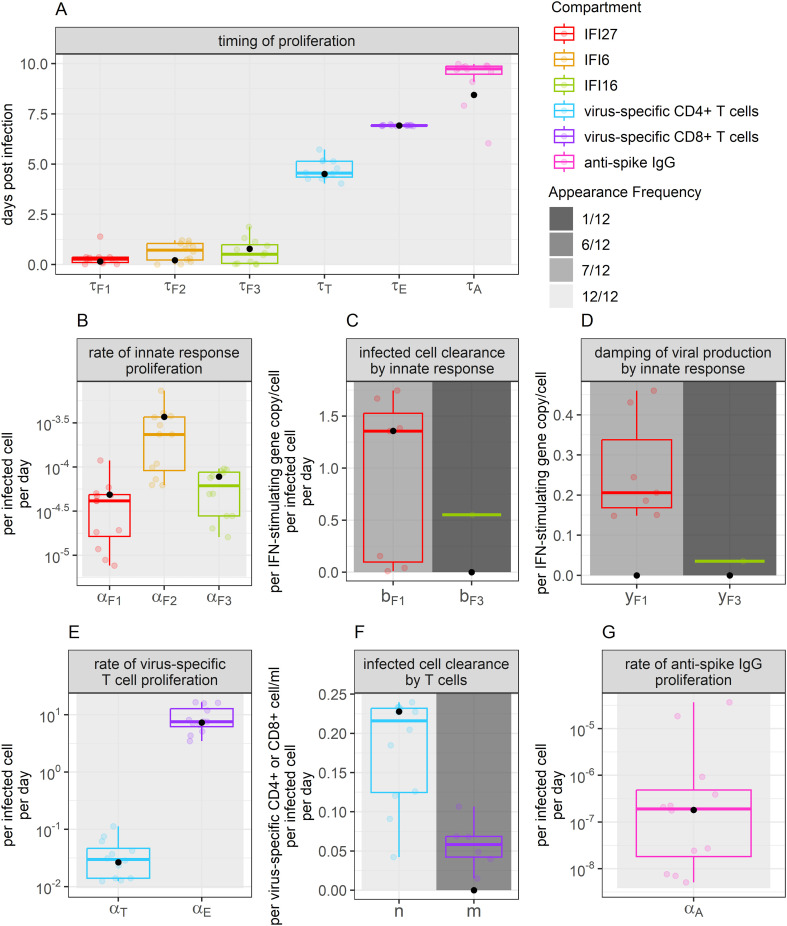
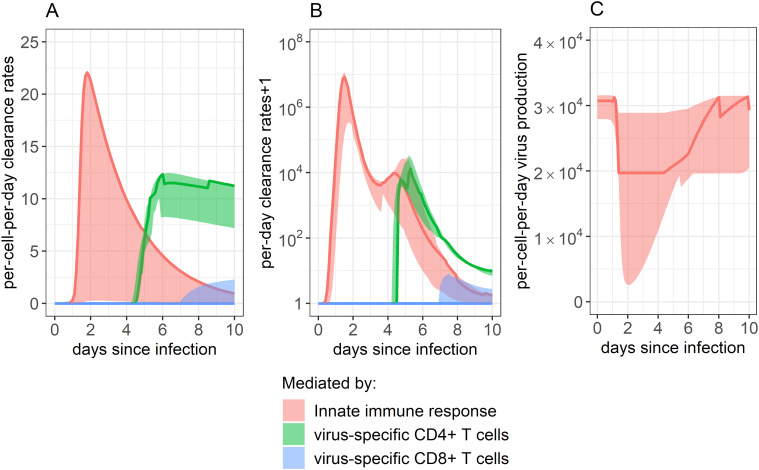
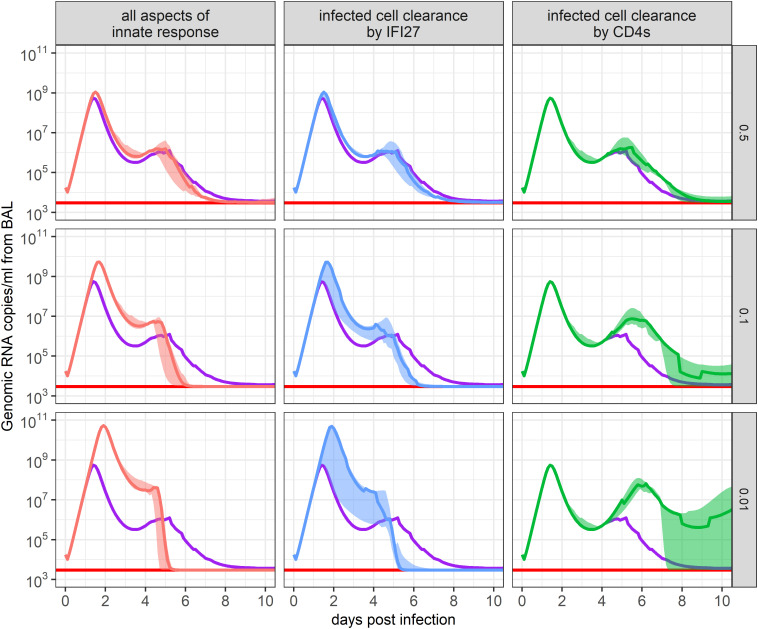
Results and discussion: Model outputs suggest that the innate immune response plays a crucial role in controlling early infection, while SARS-CoV-2 specific CD4+ T cells correspond to later viral elimination, and anti-spike IgG antibodies do not impact viral dynamics. Among the numerous genes potentially contributing to the innate response, we identified IFI27 as most closely linked to viral load decline. A 90% knockdown of the innate response from our validated model resulted in a ~10-fold increase in peak viral load during infection. Our approach provides a novel methodological framework for future analyses of similar complex, non-linear multi-component immunologic data sets.

Keywords: SARS-CoV-2; ensemble model; innate immunity; mathematical modeling; rhesus macaques; systems immunology; within-host infection dynamics.


Conflict of interest statement

JS has done previous consultation for GSK and Pfizer. The remaining author declares that the research was conducted in the absence of any commercial or financial relationships that could be construed as a potential conflict of interest.

Figures

Figure 1
Figure 1
Description of viral and immunological data collected from BAL during SARS-CoV-2 infection in immunologically naïve Rhesus Macaques. (A) SARS-CoV-2 genomic (g)RNA copies/ml of BALF were measured using qPCR. The red horizontal line shows the threshold of detection (3000 copies/ml). Data points on days 1 and 2 are extrapolated from corresponding viral loads measured in the throat and the nose on these days (see Methods). (B) Area under the curve (AUC) from ELISA titration curves of SARS-CoV-2 anti-spike proteins in collected BALF. (C) Percentage of virus-specific CD4+ and CD8+ T cells in BALF, measured via flow cytometry. CD4+ and CD8+ cells were considered virus-specific if they stain positively for IFN γ or TNF following exposure to a megapool of SARS-CoV-2 antigens. (D) Normalized average expression values of IFN genes and ISGs, measured via scRNAseq. (E) Correlation between ISG expression and same-day gRNA levels in BALF. The three genes with the most significant correlation are shown (correlation coefficient indicated). These genes also showed the greatest change over time, according to feature selection. (F) Time-series data of these top three genes. Data comes from (2).
Figure 2
Figure 2
Visual description of all potential terms included within our mathematical model of SARS-CoV-2 infection. Red boxes indicate which model terms were alternatively included or excluded to determine how well each version of this model fits the data. The rate at which susceptible cells (S) become infected (I) is dependent on the number of susceptible cells, the amount of virus (V) present, and the presence of anti-spike IgG (A), which may dampen infection rates through neutralization of virus. Infected cells can potentially be cleared by interacting with virus-specific CD8+ T cells I, virus-specific CD4+ T cells (T), or the innate immune response ( Fi ). The rate of viral production is dependent on the number of infected cells but can be dampened by the innate immune response inducing an antiviral state in infected cells. The rate of proliferation for anti-spike IgG antibody, virus-specific CD8+ T cells, virus-specific CD4+ T cells, and innate immune cells is proportional to the number of infected cells but is not turned on until time τj , where j is specific to the type of immune response. For the innate immune response ( Fi ), we test its dynamics being represented by three possible ISGs: IFN27 (i=1), IFI6 (i=2), and IFI16 (i=3).
Figure 3
Figure 3
Ensemble model fits to SARS-CoV-2 viral and immune data. (A) Ranking of the top 12 models that best fit biological data and whose AIC scores add up to a summed weight of 0.95. The X-axis displays which of the tested parameters were included within a particular model, while the Y-axis ranks models based on their AIC scores. Term “S” represents the inclusion of target cell limitation. AIC scores are indicated by the color of the filled-in boxes. These top 12 models were used to create an ensemble model to capture the combined results. (B–E) Ensemble weighted median (colored lines) and the individual top 12 model fits (grey lines) to data. Grey dots indicate data points. Red dots indicate the median of the data points. Orange horizontal line indicates the threshold of detection for qPCR.
Figure 4
Figure 4
Parameter values appearing for the best-ranked models. Boxplot color indicates the immune compartment to which a parameter belongs. Background shade indicates how often a parameter appeared within the 12 best-ranked models. Colored dots show individual parameter values for the models that include each parameter (value not set to 0). Boxplots show the median and interquartile range (IQR), while whiskers indicate 1.5 times the IQR. Black dots indicate the weighted median of each parameter value, determined using model Akaike weights when accounting for all models in the 95% confidence set. Panel (A) displays values related to the timing of proliferation. Panel (B) displays values related to innate immune response proliferation. Panels (C, D) display values related to the clearance of infected cells and damping of viral production by the innate response, respectively. Panels (E, F) display values related to the proliferation of, and clearance of infection by T cells, respectively. Panel (G) displays values describing the rate of anti-spike IgG proliferation.
Figure 5
Figure 5
Impact of each immune component in eliminating SARS-CoV-2 infected cells. (A, B) Rate of infected cell clearance throughout infection, as mitigated by the innate immune response, CD4+ T cell response, and CD8+ T cell response. Panel A shows the per-infected cell-per-day clearance, while panel B shows the total per-day clearance rate. Note that panel B shows the “per-day clearance rate+1” so that values may be displayed on a log scale. (C) Innate immune system’s impact on dampening the rate of viral production by inducing an antiviral state in infected cells. The innate immune system’s impact was determined by combining the impact of all ISGs examined. As our best-fitting models did not include any impact of anti-spike IgG on infection control, their role is not displayed here. Solid lines show the weighted median, while ribbons show the weighted interquartile range, calculated using the Akaike weights from the 95% confidence set of best-ranked models.
Figure 6
Figure 6
Impact of immune response parameters on the ensemble model’s SARS-CoV-2 viral load projections. The 95% confidence set of best-ranked models was run where each immune response parameter was multiplied by a scaling factor to maintain or dampen its impact on infection. The resulting ensemble weighted median and IQR of predicted viral loads are shown. The scaled parameters descriptions are in the x-axis strip text while the scaling factor is in the y-axis strip text. Red lines show the threshold of detection and purple lines show the weighted median of the unchanged ensemble model. The panel labeled “all aspects of innate response” indicates the impact of all innate immune response parameters ( bFi and yFi , where i=1,2,3) appearing in the set of best-ranked models.
Figure 7
Figure 7
Predictions of SARS-CoV-2 infection viral dynamics assuming different memory T cell conditions. Here, we varied the initial number of virus-specific CD4+ T cells present in the BALF (i) and the time at which memory T cell proliferation was assumed to begin (j) to capture potential conditions during a SARS-CoV-2 reinfection. (A) Ensemble model’s predicted peak SARS-CoV-2 viral load (copies/ml) measured from BAL from all scenarios examined. (B) Time series dynamics of predicted viral loads from a subset of the scenarios examined (ratio of virus-specific CD4+ T cells to virus-specific CD8+ T cells is 1:1). Purple lines show the ensemble model’s prediction of the viral load during primary infection. Pink and green lines show the individual predictions of the top 12 models within the 95% confidence set. Blue lines show the ensemble model’s predictions of the viral load under each reinfection scenario.

Similar articles

  • Responses to acute infection with SARS-CoV-2 in the lungs of rhesus macaques, baboons and marmosets.
    Singh DK, Singh B, Ganatra SR, Gazi M, Cole J, Thippeshappa R, Alfson KJ, Clemmons E, Gonzalez O, Escobedo R, Lee TH, Chatterjee A, Goez-Gazi Y, Sharan R, Gough M, Alvarez C, Blakley A, Ferdin J, Bartley C, Staples H, Parodi L, Callery J, Mannino A, Klaffke B, Escareno P, Platt RN 2nd, Hodara V, Scordo J, Gautam S, Vilanova AG, Olmo-Fontanez A, Schami A, Oyejide A, Ajithdoss DK, Copin R, Baum A, Kyratsous C, Alvarez X, Ahmed M, Rosa B, Goodroe A, Dutton J, Hall-Ursone S, Frost PA, Voges AK, Ross CN, Sayers K, Chen C, Hallam C, Khader SA, Mitreva M, Anderson TJC, Martinez-Sobrido L, Patterson JL, Turner J, Torrelles JB, Dick EJ Jr, Brasky K, Schlesinger LS, Giavedoni LD, Carrion R Jr, Kaushal D. Singh DK, et al. Nat Microbiol. 2021 Jan;6(1):73-86. doi: 10.1038/s41564-020-00841-4. Epub 2020 Dec 18. Nat Microbiol. 2021. PMID: 33340034 Free PMC article.
  • Recovery from Acute SARS-CoV-2 Infection and Development of Anamnestic Immune Responses in T Cell-Depleted Rhesus Macaques.
    Hasenkrug KJ, Feldmann F, Myers L, Santiago ML, Guo K, Barrett BS, Mickens KL, Carmody A, Okumura A, Rao D, Collins MM, Messer RJ, Lovaglio J, Shaia C, Rosenke R, van Doremalen N, Clancy C, Saturday G, Hanley P, Smith BJ, Meade-White K, Shupert WL, Hawman DW, Feldmann H. Hasenkrug KJ, et al. mBio. 2021 Aug 31;12(4):e0150321. doi: 10.1128/mBio.01503-21. Epub 2021 Jul 27. mBio. 2021. PMID: 34311582 Free PMC article.
  • Influence of Aerosol Delivered BCG Vaccination on Immunological and Disease Parameters Following SARS-CoV-2 Challenge in Rhesus Macaques.
    White AD, Sibley L, Sarfas C, Morrison AL, Bewley K, Churchward C, Fotheringham S, Gkolfinos K, Gooch K, Handley A, Humphries HE, Hunter L, Kennard C, Longet S, Mabbutt A, Moffatt M, Rayner E, Tipton T, Watson R, Hall Y, Bodman-Smith M, Gleeson F, Dennis M, Salguero FJ, Carroll M, McShane H, Cookson W, Hopkin J, Sharpe S. White AD, et al. Front Immunol. 2022 Feb 9;12:801799. doi: 10.3389/fimmu.2021.801799. eCollection 2021. Front Immunol. 2022. PMID: 35222355 Free PMC article.
  • Immunological Aspects of SARS-CoV-2 Infection and the Putative Beneficial Role of Vitamin-D.
    Peng MY, Liu WC, Zheng JQ, Lu CL, Hou YC, Zheng CM, Song JY, Lu KC, Chao YC. Peng MY, et al. Int J Mol Sci. 2021 May 16;22(10):5251. doi: 10.3390/ijms22105251. Int J Mol Sci. 2021. PMID: 34065735 Free PMC article. Review.
  • The immune response to SARS-CoV-2 and COVID-19 immunopathology - Current perspectives.
    Boechat JL, Chora I, Morais A, Delgado L. Boechat JL, et al. Pulmonology. 2021 Sep-Oct;27(5):423-437. doi: 10.1016/j.pulmoe.2021.03.008. Epub 2021 Apr 9. Pulmonology. 2021. PMID: 33867315 Free PMC article. Review.

Cited by

References

    1. Hay JA, Kissler SM, Fauver JR, Mack C, Tai CG, Samant RM, et al. . Quantifying the impact of immune history and variant on SARS-CoV-2 viral kinetics and infection rebound: A retrospective cohort study. eLife. (2022) 11:e81849. doi: 10.7554/eLife.81849 - DOI - PMC - PubMed
    1. Nelson CE, Namasivayam S, Foreman TW, Kauffman KD, Sakai S, Dorosky DE, et al. . NIAID/DIR Tuberculosis Imaging Program, Brooks K, Potter EL, et al. Mild SARS-CoV-2 infection in rhesus macaques is associated with viral control prior to antigen-specific T cell responses in tissues. Sci Immunol. (2022) 7:eabo0535. doi: 10.1126/sciimmunol.abo0535 - DOI - PMC - PubMed
    1. Chandrashekar A, Liu J, Yu J, McMahan K, Tostanoski LH, Jacob-Dolan C, et al. . Prior infection with SARS-CoV-2 WA1/2020 partially protects rhesus macaques against reinfection with B.1.1.7 and B.1.351 variants. Sci Transl Med. (2021) 13:eabj2641. doi: 10.1126/scitranslmed.abj2641 - DOI - PMC - PubMed
    1. Cohen KW, Linderman SL, Moodie Z, Czartoski J, Lai L, Mantus G, et al. . Longitudinal analysis shows durable and broad immune memory after SARS-CoV-2 infection with persisting antibody responses and memory B and T cells. Cell Rep Med. (2021) 2:100354. doi: 10.1016/j.xcrm.2021.100354 - DOI - PMC - PubMed
    1. Hvidt AK, Guo H, Andersen R, Lende SSF, Vibholm LK, Søgaard OS, et al. . Long-term humoral and cellular immunity after primary SARS-CoV-2 infection: a 20-month longitudinal study. BMC Immunol. (2023) 24:45. doi: 10.1186/s12865-023-00583-y - DOI - PMC - PubMed

Substances