. 2024 Nov 7:15:1433119.
doi: 10.3389/fimmu.2024.1433119. eCollection 2024.

Human CD34+-derived plasmacytoid dendritic cells as surrogates for primary pDCs and potential cancer immunotherapy

Affiliations

Human CD34+-derived plasmacytoid dendritic cells as surrogates for primary pDCs and potential cancer immunotherapy

Giovanna Fiore et al. Front Immunol. .

Abstract

Introduction: Plasmacytoid dendritic cells (pDCs) are capable of triggering broad immune responses, yet, their scarcity in blood coupled to their reduced functionality in cancer, makes their therapeutic use for in situ activation or vaccination challenging.

Methods: We designed an in vitro differentiation protocol tailored for human pDCs from cord blood (CB) hematopoietic stem cells (HSCs) with StemRegenin 1 (SR-1) and GM-CSF supplementation. Next, we evaluated the identity and function of CB-pDCs compared to human primary pDCs. Furthermore, we tested the potential of CB-pDCs to support anti-tumor immune responses in co-culture with tumor explants from CRC patients.

Results: Here, we report an in vitro differentiation protocol enabling the generation of 200 pDCs per HSC and highlight the role of GM-CSF and SR-1 in CB-pDC differentiation and function. CB-pDCs exhibited a robust resemblance to primary pDCs phenotypically and functionally. Transcriptomic analysis confirmed strong homology at both, baseline and upon TLR9 or TLR7 stimulation. Further, we could confirm the potential of CB-pDCs to promote inflammation in the tumor microenvironment by eliciting cytokines associated with NK and T cell recruitment and function upon TLR7 stimulation ex vivo in patient tumor explants.

Discussion: This study highlights CB-pDCs as surrogates for primary pDCs to investigate their biology and for their potential use as cell therapy in cancer.

Keywords: DC vaccination; cancer immunotherapy; dendritic cell differentiation; hematopoietic stem cells (HSCs); human; plasmacytoid dendritic cells (pDCs).


Conflict of interest statement

All authors are employees of Roche, except AK. GF was employed by Roche Diagnostics GmbH at the moment this work was undertaken. KP, LAS, MG, JR, SD, MM, SH, and MW hold stock and stock options in F Hoffmann-La Roche. The remaining author declares that the research was conducted in the absence of any commercial or financial relationships that could be construed as a potential conflict of interest.

Figures

Figure 1
Figure 1
Tumor-associated pDCs are tolerogenic towards stimulation with TLR7 agonist. (A) Representative dot plots showing TA-pDCs infiltrating various solid tumor types as detected by CD123+CD303+ staining in single cell suspensions from tumor digests using flow cytometry. (B) Quantification of TA-pDCs (defined as Lin-CD123+CD303+ cells) as fraction of living cells in various tumor indications (breast cancer: n=8; colon cancer: n=3; lung cancer: n=4; head and neck cancer: n=5; ovarian cancer: n=4). (C) Quantification of IFN-ɑ release from TLR7-stimulated (left) single cell suspension from breast cancer tissue (n=3) and blood pDCs (right) from healthy donors (n=6). Results are shown as mean ± SEM. See also Supplementary Table S1 .
Figure 2
Figure 2
Generation of in vitro differentiated CB-pDCs from CD34+ HSCs. (A) Schematic overview depicting the generation of CB-pDCs from CB-derived CD34+ HSCs. 5,000 HSCs were expanded for 7 days in expansion media and cryopreserved. Expanded, thawed HSCs were differentiated for 12 days on a monolayer of Mitomycin C-treated MS-5 stromal cells before being harvested on day 19 or used for subsequent experiments. (B) Graph displaying the frequencies of CB-pDCs as percentage of living cells. (C) Graph displaying the total cell proliferation in the mixed culture during differentiation by fold increase and (D) absolute CB-pDC numbers corrected on the frequency of differentiated CB-pDCs on day 19 comparing supplementation of SR-1 and GM-CSF separately or in combination. (E, F) Quantification of IFN-ɑ release from (E) TLR9-activated and (F) TLR7-activated cells in the mixed culture comparing unprimed and primed cells of the different conditions with LLOD at 1.95 pg/mL. (G) Pie chart showing the mean frequencies of CB-cDC1s, CB-cDC2s, CB-pDCs, and other not further characterized cells from 6 independent CB donors as defined by flow cytometry phenotyping. (H) Quantification of CB-pDCs and CB-pre/AS-DC frequencies (from CD45+Lin-CD123+CD45RA+) from 5 independent CB donors and dot plot displaying CB-pDC and CB-pre/AS-DC gates from one representative donor. (I) Overlaid histograms comparing expression of CD4, CD45RA, ILT-7, and CD304 of CB-pDCs and primary pDCs of one representative donor. Graph depicts GMFI of CD4, CD45RA, ILT-7, and CD304 as determined by flow cytometry shown as mean ± SEM of 2 independent experiments, 8 independent CB donors, and 3 independent pDC donors. (B–F) Results are shown as mean ± SEM of 4 independent experiments and 12 independent CB donors. *p<0.05; **p<0.01, ***p<0.001, ****p<0.0001, ns: not significant (B–D) one-way ANOVA with Tukey’s post-hoc test or (E, F) Wilcoxon test. See also Supplementary Figure S1 .
Figure 3
Figure 3
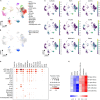
CB-pDCs resemble primary pDCs at the transcriptional level. (A) UMAP plot showing the immune cell subsets in CB-DCs and primary pan-DCs. (B) UMAP plot showing pDCs resolved from enriched pan-DC and CB-DC samples. (C) UMAP plot showing the gene expression levels of different pDC markers. NA stands for not applicable and refers to cells not annotated as pDCs due to the lack of pDC marker expression. (D) Mean expression levels of selected pDC signature genes in the different immune cell subsets. Dot size indicates fraction of positive cells, color indicates mean expression levels. (E) GSEA analysis comparing CB-DCs of the different donors with the DC signatures published by Villani et al. Results of 3 independent untreated, unprimed CB donors and 3 independent pan-DC donors are depicted. See also Supplementary Figure S2 .
Figure 4
Figure 4
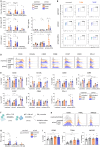
CB-pDCs show key functional features resembling primary pDCs. Unprimed and primed sorted CB-pDCs as well as primary pDCs were activated by TLR9 or TLR7 agonists for 24 hrs. (A) Quantification of pan-IFN-ɑ release in supernatant. (B) Representative flow cytometry dot plots showing expression of intracellular IFN-ɑ2 after 6 hrs (from CD45+CD123+CD303+) of 2 independent experiments. (C) Quantification of IFN-λ1, TNF-ɑ, CCL5, and IFN-β in supernatant. (D) Overlaid histograms comparing expression of activation markers on the surface of the different pDC types. (E) Quantification of marker expression on the surface of pDCs (from CD45+CD123+CD303+). (F) Scheme illustrating the set-up of pDC-NK cell co-culture assay. (G) Quantification of IFN-ɣ in supernatant upon co-culture of NK cells with CB-pDCs or pDCs. (H) Overlaid histograms showing activation marker expression on NK cells upon co-culture with CB-pDCs. (I) Quantification of activation marker expression on NK cells (from CD45+CD56+CD123-) upon co-culture with pDCs. Results are shown as mean ± SEM of 2 independent experiments, (A, C, E) 6 independent CB donors and 4 independent primary pDC donors and (G, I) 5 independent CB donors, 4 independent pDC donors and 4 independent NK cell donors are depicted. *p<0.05; **p<0.01, ***p<0.001, ****p<0.0001, (A, C, E) two-way ANOVA or (G, I) one-way ANOVA with Tukey’s post-hoc test. See also Supplementary Figure S3 .
Figure 5
Figure 5
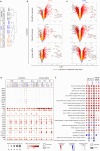
TLR stimulation activates similar genes and pathways in CB and primary pDCs. (A) Cluster dendrogram depicting a hierarchical clustering analysis of the different donors comparing primary pDCs to CB-pDCs with or without priming upon TLR stimulation or left untreated. (B, C) Volcano plots showing differentially expressed genes (right: up-regulated, left: down-regulated) between untreated and upon (B) TLR9 or (C) TLR7 activation of various pDC types as indicated by labeling. Colors display significance (orange) and significance and high log fold change (red), n.s.: not significant (gray). (D) Dot plot depicting the fraction of positive cells (dot size) and their mean expression levels (dot color) of different donors and various treatments as indicated. Genes were selected based on function or activation in pDCs. (E) BubbleMap showing the most relevant pathways enriched in TLR9- and TLR7-activated CB-pDCs and primary pDCs. Color code as explained in the figure, increasing intensity represents stronger enrichment in TLR-treated groups (red) or in untreated controls (blue) with bubble sizes corresponding to the absolute values for the normalized enrichment score. Results of 3 independent CB donors and 3 independent pan-DC donors are shown, with unprimed and primed CB cells and primary pan-DCs with or without activation with TLR9 or TLR7 agonists for 4 hrs. See also Supplementary Figure S4 and Supplementary Table S3 .
Figure 6
Figure 6
CB-pDCs can induce inflammation in co-culture with cells from CRC tumor digests. (A) Graphical representation of the experimental set-up of the CB-pDC/CRC co-culture. (B) Quantification of activation markers on CB-pDCs upon co-culture with CRC digests using flow cytometry. (C) Quantification of IFN-ɑ release in supernatant of CB-pDCs either from co-culture with CRC digests or cultured alone showing all indicated treatment groups. (D, E) Quantification of (D) cytokine and chemokine release and (E) release of cytotoxic mediators in supernatant of CB-pDCs either from co-culture with CRC digests or cultured alone of all indicated treatment groups. Colors displaying the minimum (0%) to maximum (100%) mean cytokine concentration per column. Results are shown as mean ± SEM of 2 independent experiments, with one independent CB donor and 4 independent CRC donors. *p>0.1, ns: not significant, one-way ANOVA with Tukey’s post-hoc test. See also Supplementary Figure S5 and Supplementary Table S1 .

References

    1. Cella M, Jarrossay D, Facchetti F, Alebardi O, Nakajima H, Lanzavecchia A, et al. . Plasmacytoid monocytes migrate to inflamed lymph nodes and produce large amounts of type I interferon. Nat Med. (1999) 5:919–23. doi: 10.1038/11360 - DOI - PubMed
    1. Honda K, Yanai H, Negishi H, Asagiri M, Sato M, Mizutani T, et al. . IRF-7 is the master regulator of type-I interferon-dependent immune responses. Nature. (2005) 434:772–7. doi: 10.1038/nature03464 - DOI - PubMed
    1. Colonna M, Trinchieri G, Liu Y-J. Plasmacytoid dendritic cells in immunity. Nat Immunol. (2004) 5:1219–26. doi: 10.1038/ni1141 - DOI - PubMed
    1. Swiecki M, Colonna M. The multifaceted biology of plasmacytoid dendritic cells. Nat Rev Immunol. (2015) 15:471–85. doi: 10.1038/nri3865 - DOI - PMC - PubMed
    1. Lynch JP, Werder RB, Loh Z, Sikder M, Curren B, Zhang V, et al. . Plasmacytoid dendritic cells protect from viral bronchiolitis and asthma through semaphorin 4a–mediated T reg expansion. J Exp Med. (2018) 215:537–57. doi: 10.1084/jem.20170298 - DOI - PMC - PubMed

MeSH terms

Substances

LinkOut - more resources