. 2024 Nov 7:15:1437688.
doi: 10.3389/fimmu.2024.1437688. eCollection 2024.

Causal association between plasma metabolites and diverse autoimmune diseases: a two-sample bidirectional mendelian randomization study

Affiliations

Causal association between plasma metabolites and diverse autoimmune diseases: a two-sample bidirectional mendelian randomization study

Xiwen Yuan et al. Front Immunol. .

Abstract

Background: Autoimmune diseases (ADs) are a category of conditions characterized by misrecognition of autologous tissues and organs by the immune system, leading to severe impairment of patients' health and quality of life. Increasing evidence suggests a connection between fluctuations in plasma metabolites and ADs. However, the existence of a causal relationship behind these associations remains uncertain.

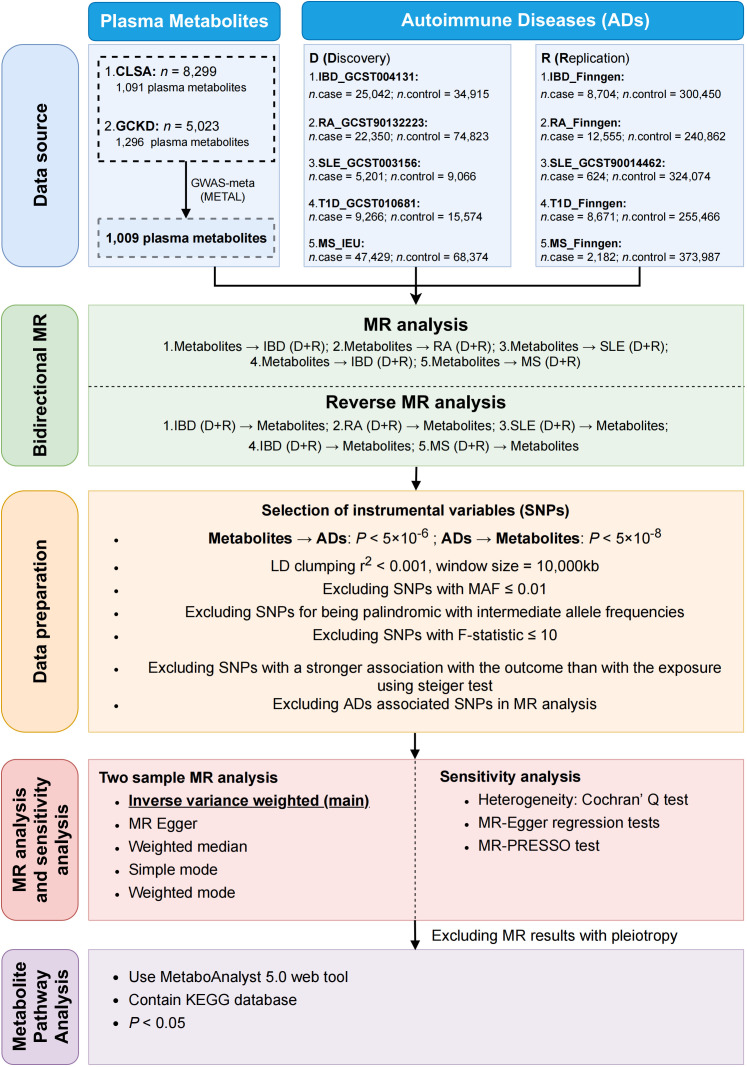
Methods: Applying the two-sample mendelian randomization (MR) method, the reciprocal causality between plasma metabolites and ADs was analyzed. We took the intersection of two metabolite genome-wide association study (GWAS) datasets for GWAS-meta and obtained 1,009 metabolites' GWAS data using METAL software. We accessed GWAS summary statistics for 5 common ADs, inflammatory bowel disease (IBD), multiple sclerosis (MS), type 1 diabetes (T1D), systemic lupus erythematosus (SLE) and rheumatoid arthritis (RA) from published GWAS data. MR analyses were performed in discovery and replication stage simultaneously. Meanwhile, the reverse MR analysis was conducted to investigate the possibility of reverse causal association. Furthermore, a series of sensitivity analyses were conducted to validate the robustness of the results. These statistical analyses were conducted using R software. Finally, the web version of MetaboAnalyst 5.0. was applied to analyze metabolic pathways. Ultimately, we conducted ELISA assays on plasma samples from patients to validate the results.

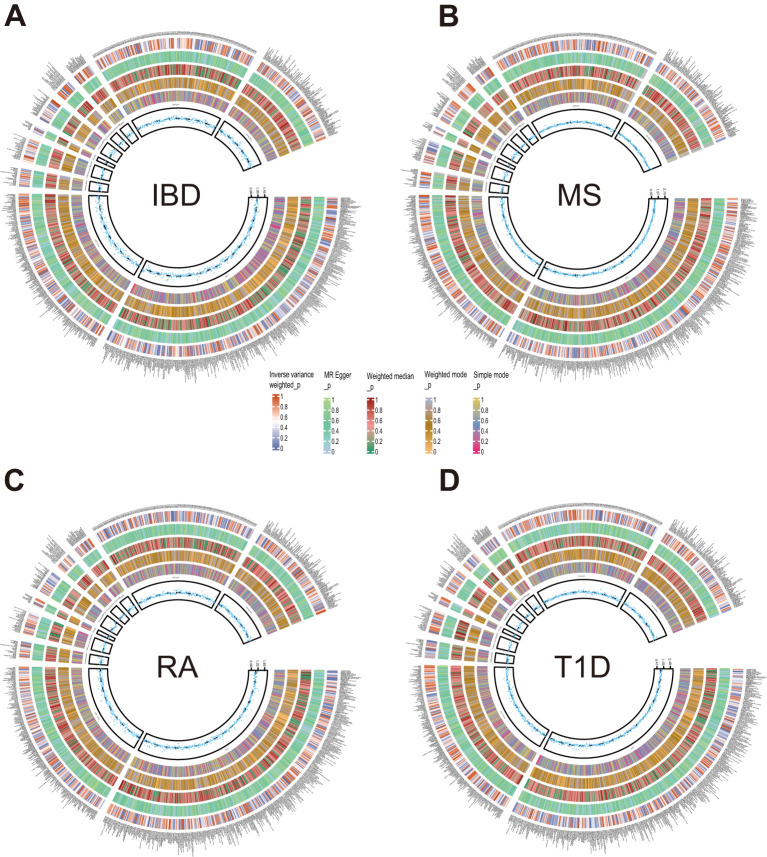
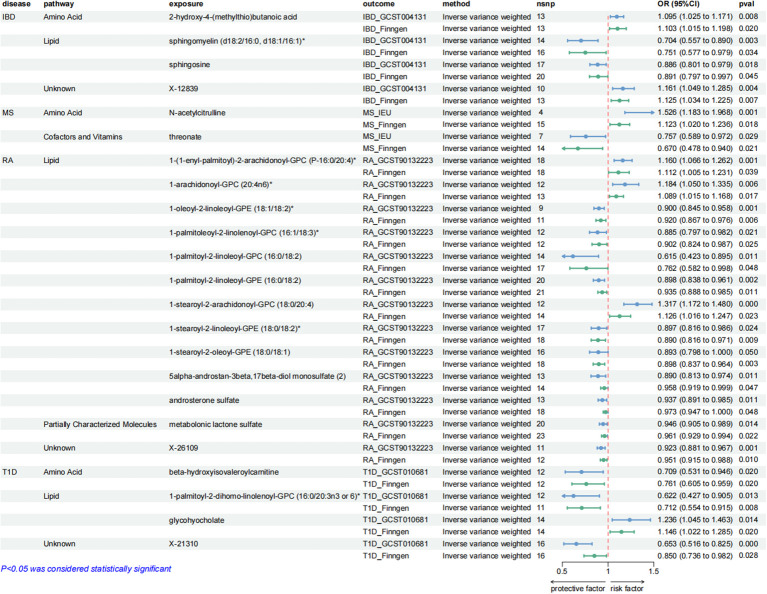
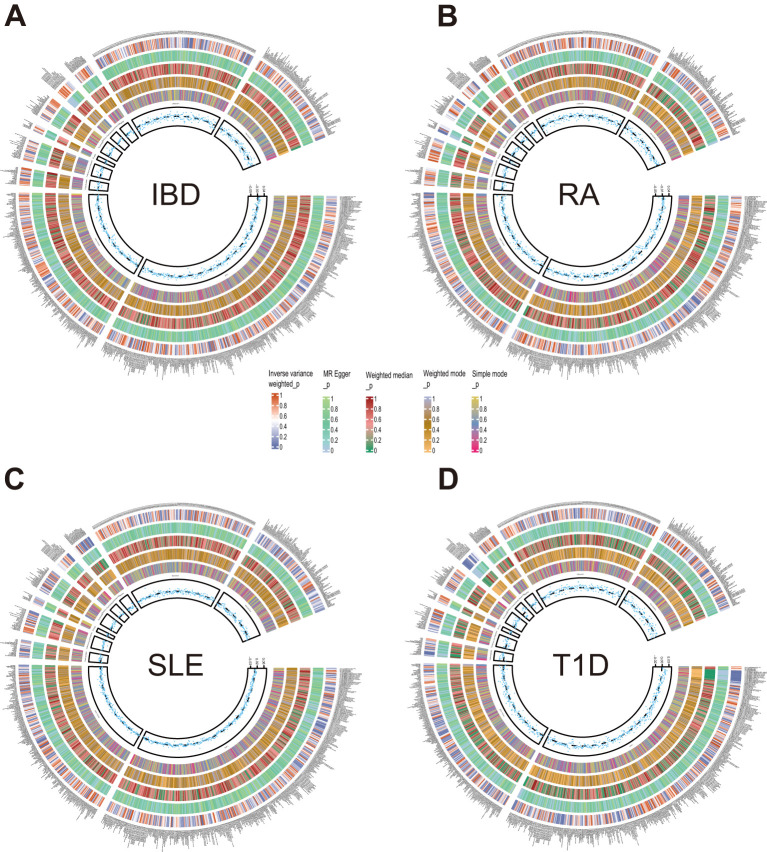
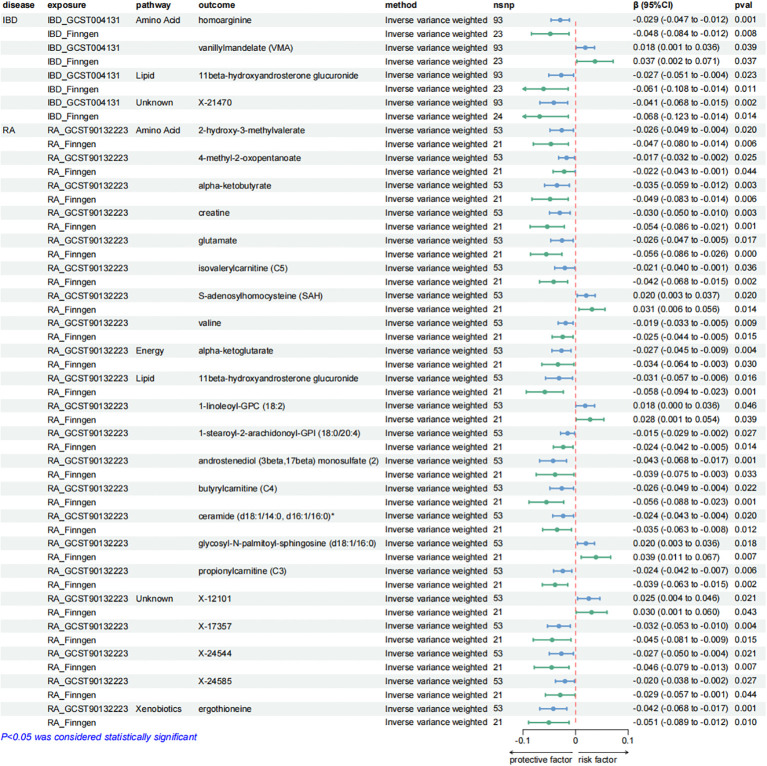
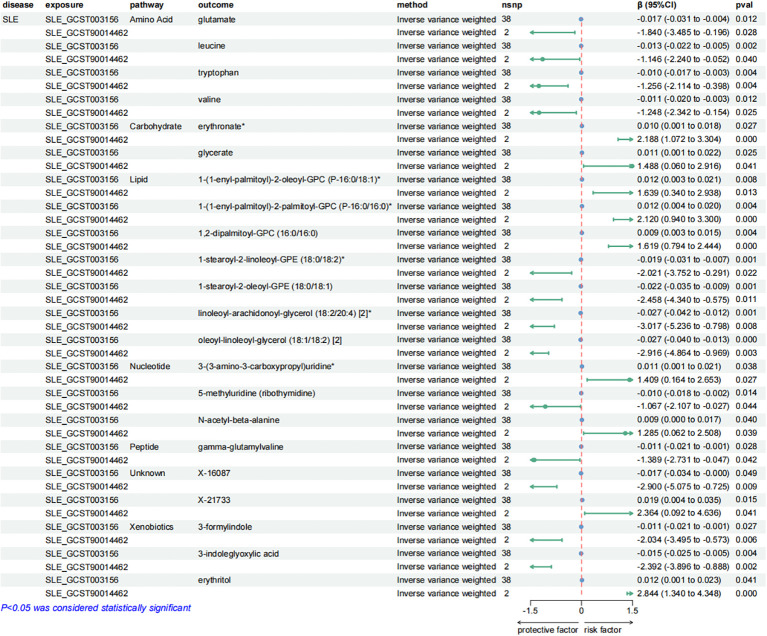
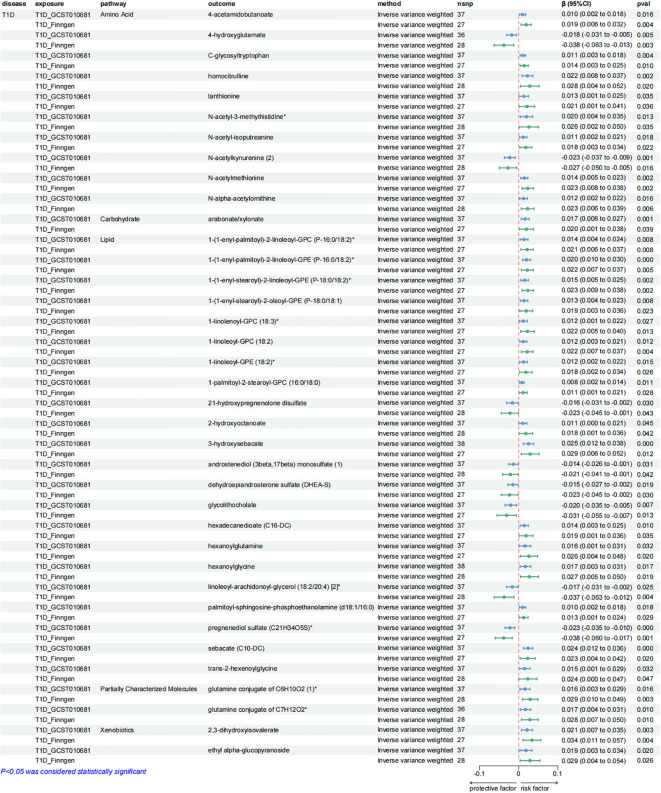
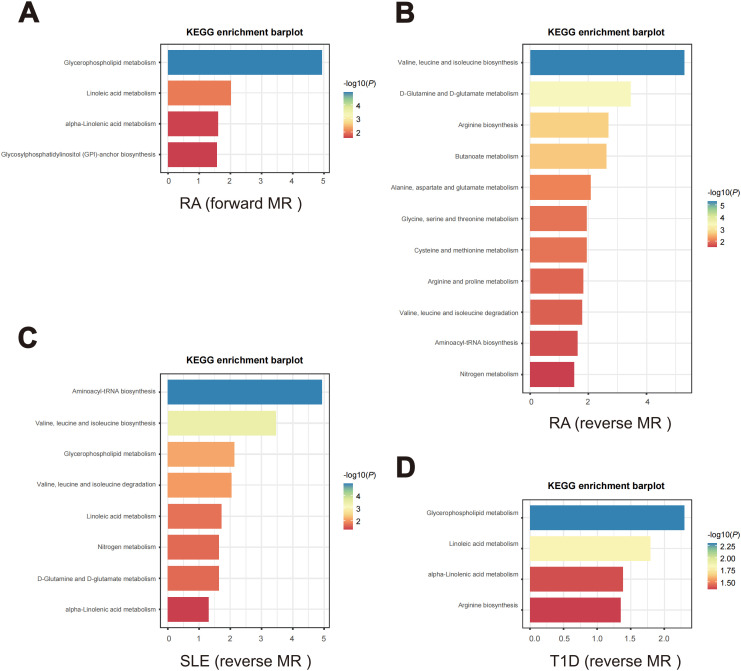
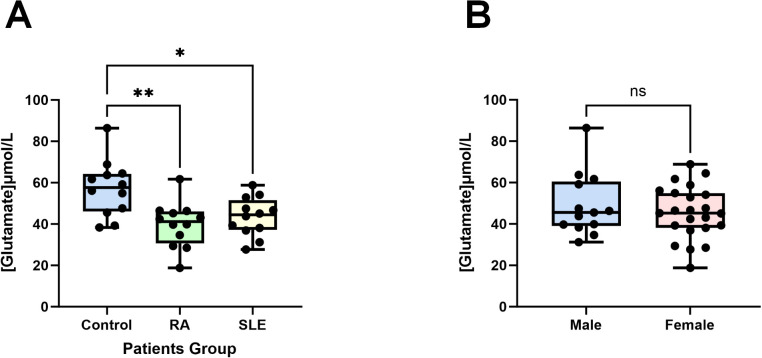
Results: 4 metabolites were identified to have causal relationships with IBD, 2 metabolites with MS, 13 metabolites with RA, and 4 metabolites with T1D. In the reverse MR analysis, we recognized causality between SLE and 22 metabolites, IBD and 4 metabolites, RA and 22 metabolites, and T1D and 37 metabolites. Additionally, 4 significant metabolic pathways were identified in RA by metabolic pathway analysis in the forward MR analysis. Correspondingly, in the reverse, 11 significant metabolic pathways in RA, 8 in SLE, and 4 in T1D were obtained using identical approaches. Furthermore, the protective role of glutamate was confirmed through ELISA assays.

Conclusions: Our research established a reciprocal causality between plasma metabolites and ADs. Furthermore, diverse metabolic pathways correlated with ADs were uncovered. Novel insights into the prediction and diagnosis were provided, as well as new targets for precise treatment of these conditions were discovered.

Keywords: Mendelian randomization; autoimmune diseases; inflammatory bowel disease; multiple sclerosis; plasma metabolites; rheumatoid arthritis; systemic lupus erythematosus; type 1 diabetes.


Conflict of interest statement

The authors declare that the research was conducted in the absence of any commercial or financial relationships that could be construed as a potential conflict of interest.

Figures

Figure 1
Figure 1
The summary of the research process.
Figure 2
Figure 2
Circle diagrams of the discovery sample in the forward MR analysis. The complete results of the forward MR analysis, showing the causal effects of plasma metabolites on ADs. (A) IBD, (B) MS, (C) RA, (D) T1D. Five statistical methods, respectively, IVW, MR Egger, Weighted median, Weighted mode, and Simple mode, are represented by five circles from inner to outer.
Figure 3
Figure 3
Forest plots showing the causal relationships between plasma metabolites and ADs outcomes. All causal relationships were derived from the fixed-effect IVW analysis and can be supported by both discovery and replication samples.
Figure 4
Figure 4
Circle diagrams of the discovery sample in the reverse MR analysis. The complete results of the reverse MR analysis, showing the causal effects of ADs on plasma metabolites. (A) IBD, (B) RA, (C) SLE, (D) T1D. Five statistical methods, respectively, IVW, MR Egger, Weighted median, Weighted mode, and Simple mode, are represented by five circles from inner to outer.
Figure 5
Figure 5
Forest plots presenting the results of reverse MR analysis (1). Causal effects of IBD and RA on plasma metabolites using IVW method, which were supported by both discovery and replication samples.
Figure 6
Figure 6
Forest plots presenting the results of reverse MR analysis (2). Causal effects of SLE on plasma metabolites using IVW method, which were supported by both discovery and replication samples.
Figure 7
Figure 7
Forest plots presenting the results of reverse MR analysis (3). Causal effects of T1D on plasma metabolites using IVW method, which were supported by both discovery and replication samples.
Figure 8
Figure 8
Enriched key metabolic pathways associated with ADs. (A) Metabolic pathways in RA identified through the forward MR analysis. (B-D) Metabolic pathways in the reverse MR analysis for different ADs. (B) RA, (C) SLE, (D) T1D.
Figure 9
Figure 9
Glutamate concentrations in patients’ plasma. (A) Compared to the control group (healthy individuals, n = 12), the plasma glutamate concentrations in patients with RA (n = 12) and SLE (n = 12) were significantly reduced. (B) There are no differences in male (n = 13) and female (n = 23) plasma glutamate concentrations. Data are presented as the mean ± SD; ns: not significant, *P < 0.05, **P < 0.01.

Similar articles

Cited by

References

    1. Rose NR. Prediction and prevention of autoimmune disease in the 21st century: A review and preview. Am J Epidemiol. (2016) 183:403–6. doi: 10.1093/aje/kwv292 - DOI - PubMed
    1. Cao F, Liu YC, Ni QY, Chen Y, Wan CH, Liu SY, et al. . Temporal trends in the prevalence of autoimmune diseases from 1990 to 2019. Autoimmun Rev. (2023) 22:103359. doi: 10.1016/j.autrev.2023.103359 - DOI - PubMed
    1. Miller FW. The increasing prevalence of autoimmunity and autoimmune diseases: an urgent call to action for improved understanding, diagnosis, treatment, and prevention. Curr Opin Immunol. (2023) 80:102266. doi: 10.1016/j.coi.2022.102266 - DOI - PMC - PubMed
    1. Stojanovich L, Marisavljevich D. Stress as a trigger of autoimmune disease. Autoimmun Rev. (2008) 7:209–13. doi: 10.1016/j.autrev.2007.11.007 - DOI - PubMed
    1. Beckwith-Hall BM, Thompson NA, Nicholson JK, Lindon JC, Holmes E. A metabonomic investigation of hepatotoxicity using diffusion-edited 1H NMR spectroscopy of blood serum. Analyst. (2003) 128:814–8. doi: 10.1039/b302360p - DOI - PubMed

LinkOut - more resources