. 2024 Nov 7:15:1487966.
doi: 10.3389/fimmu.2024.1487966. eCollection 2024.

Integrated analysis of single-cell, spatial and bulk RNA-sequencing identifies a cell-death signature for predicting the outcomes of head and neck cancer

Affiliations

Integrated analysis of single-cell, spatial and bulk RNA-sequencing identifies a cell-death signature for predicting the outcomes of head and neck cancer

Yue Pan et al. Front Immunol. .

Abstract

Background: Cell death plays an essential role in carcinogenesis, but its function in the recurrence and postoperative prognosis of head and neck cancer (HNC), which ranks as the 7th most common malignancy globally, remains unclear.

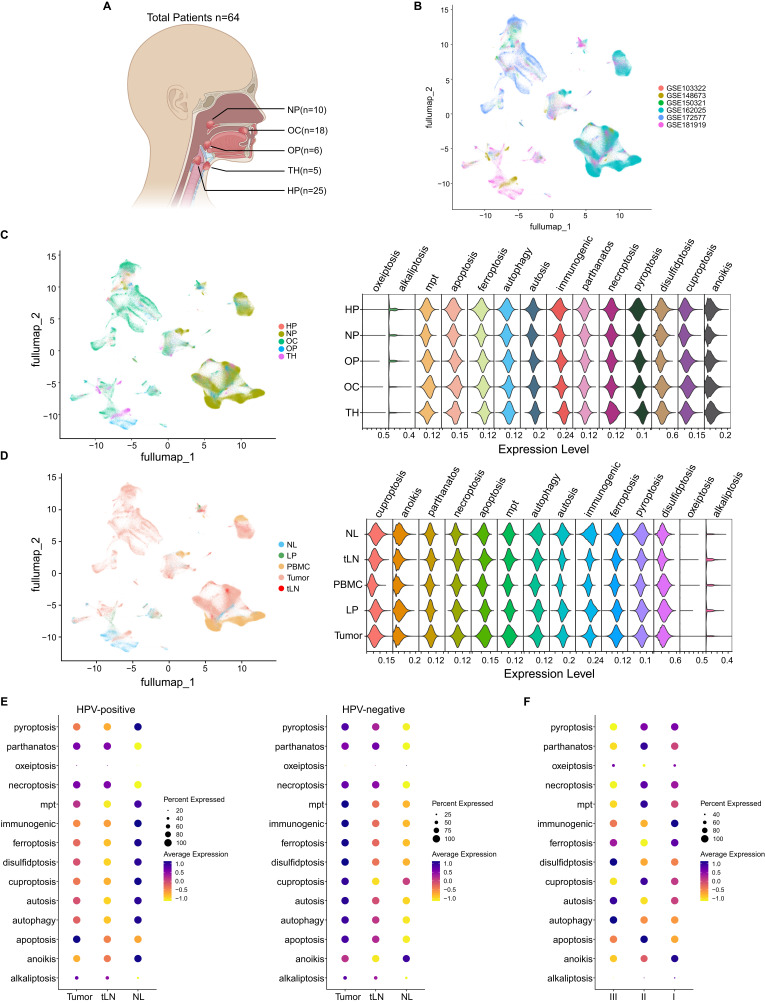
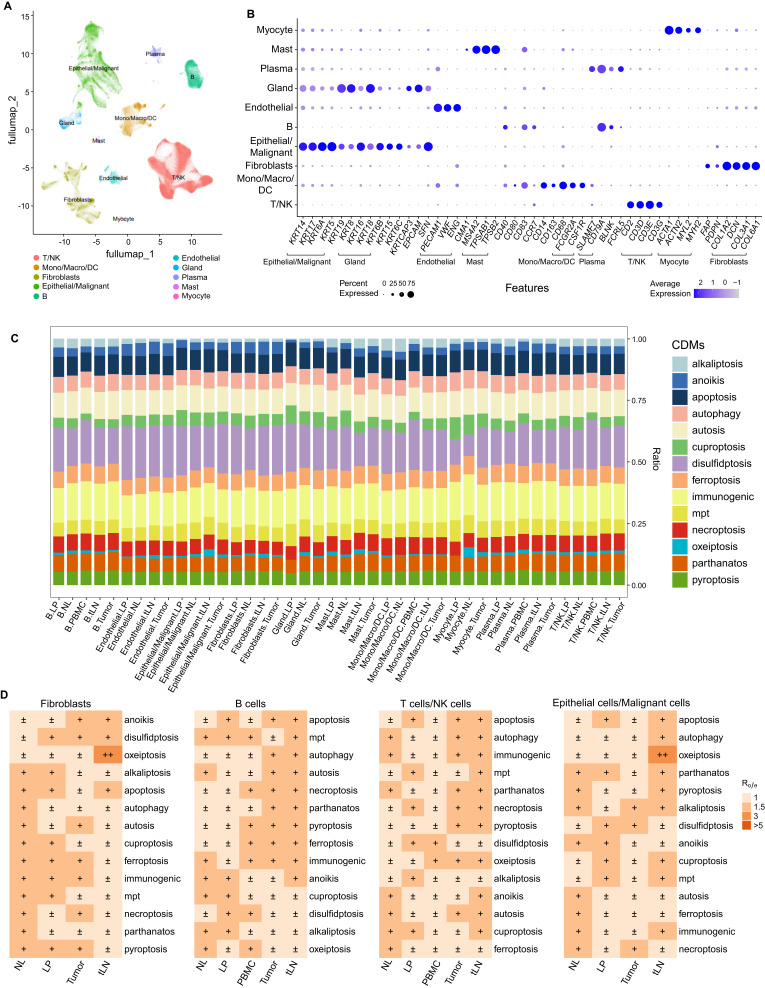
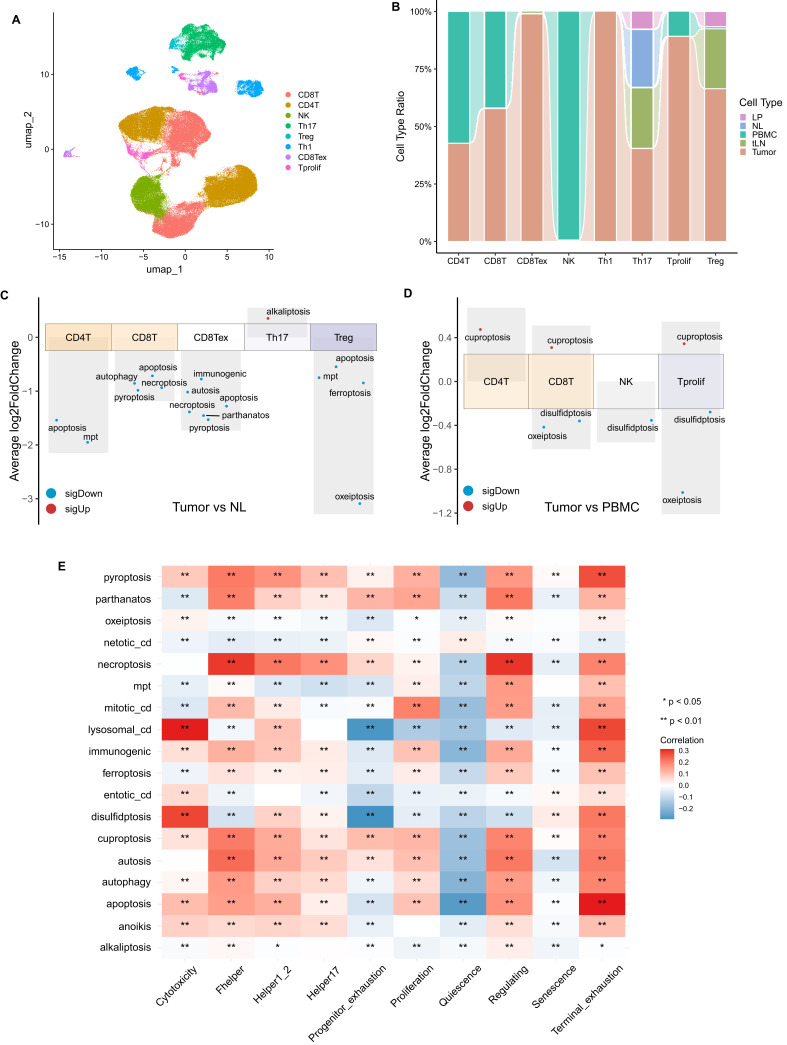
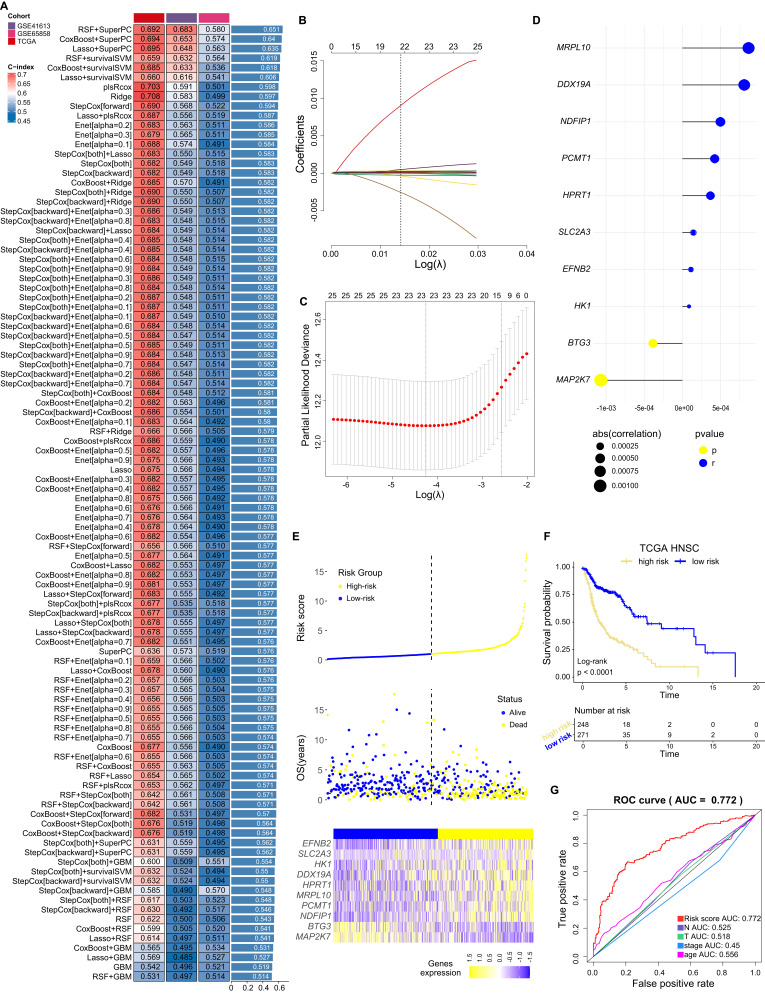
Methods: Data from five main subtypes of HNC related single-cell RNA sequencing (scRNA-seq) were recruited to establish a single-cell atlas, and the distribution of cell death models (CDMs) across different tissues as well as cell subtypes were analyzed. Bulk RNA-seq from the Cancer Genome Atlas Program (TCGA) dataset was subjected to a machine learning-based integrative procedure for constructing a consensus cell death-related signature risk score (CDRscore) model and validated by external data. The biofunctions including different expression analysis, immune cell infiltration, genomic mutations, enrichment analysis as well as cellchat analysis were compared between the high- and low- risk score groups categorized by this CDRscore model. Finally, samples from laryngeal squamous cell cancer (LSCC) were conducted by spatial transcriptomics (ST) to further validate the results of CDRscore model.

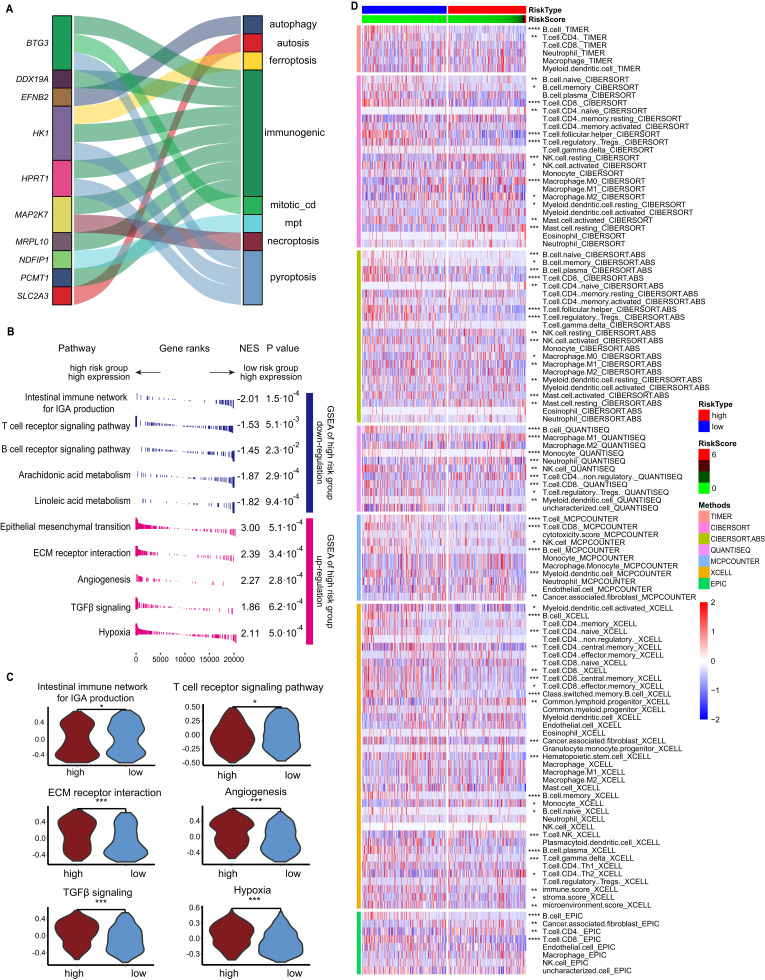
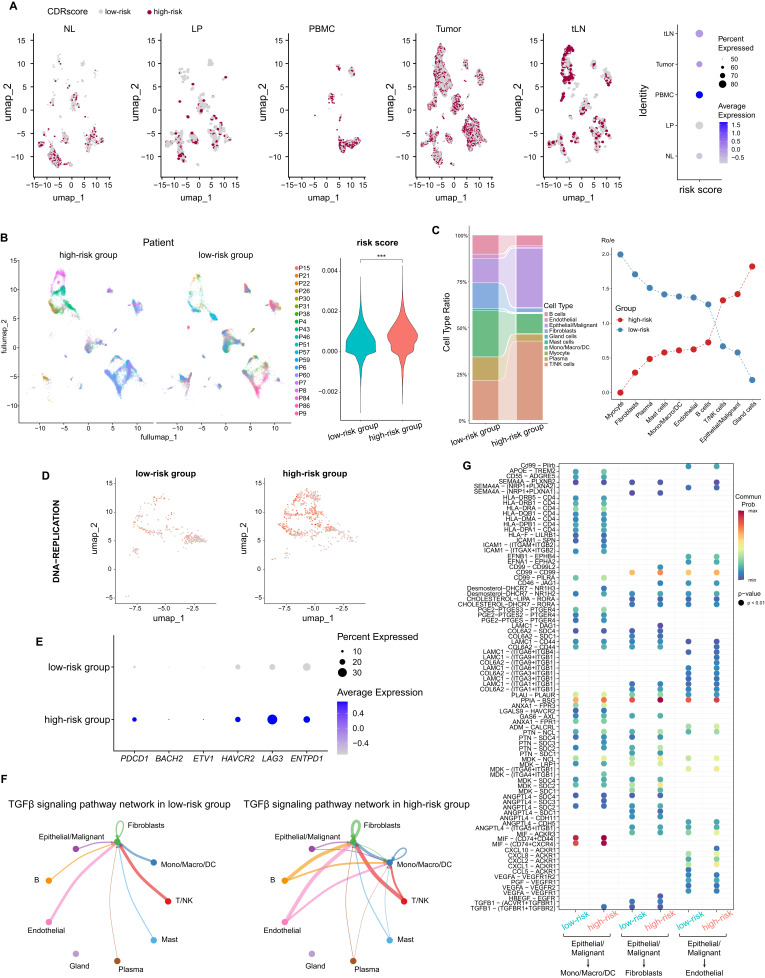
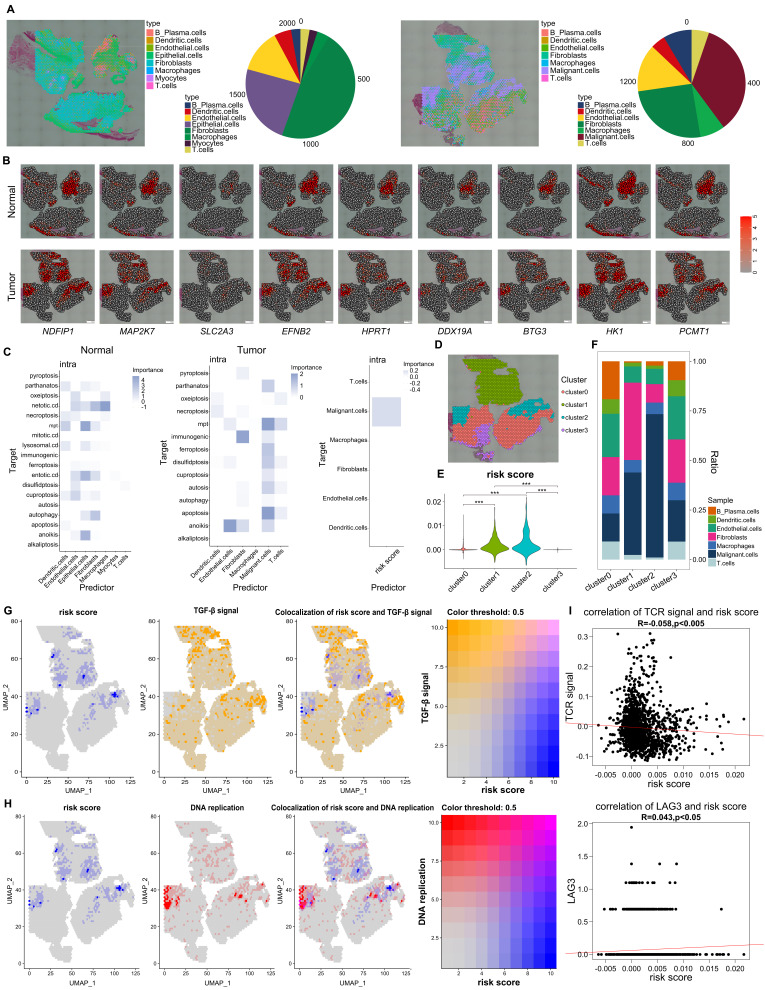
Results: T cells from HNC patients manifested the highest levels of cell death while HPV infection attenuates malignant cell death based on single-cell atlas. CDMs are positively correlated with the tumor-cell stemness, immune-related score and T cells are infiltrated. A CDRscore model was established based on the transcription of ten cell death prognostic genes (MRPL10, DDX19A, NDFIP1, PCMT1, HPRT1, SLC2A3, EFNB2, HK1, BTG3 and MAP2K7). It functions as an independent prognostic factor for overall survival in HNC and displays stable and powerful performance validated by GSE41613 and GSE65858 datasets. Patients in high CDRscore manifested worse overall survival, more active of epithelial mesenchymal transition, TGF-β-related pathways and hypoxia, higher transcription of T cell exhausted markers, and stronger TP53 mutation. ST from LSCC showed that spots with high-risk scores were colocalized with TGF-β and the proliferating malignant cells, additionally, the risk scores have a negative correlation with TCR signaling but positive association with LAG3 transcription.

Conclusion: The CDRscore model could be utilized as a powerful prognostic indicator for HNC.

Keywords: HNC; cell death; machine learning; risk score; spatial transcriptomics.


Conflict of interest statement

The authors declare that the research was conducted in the absence of any commercial or financial relationships that could be construed as a potential conflict of interest.

Figures

Figure 1
Figure 1
Deciphering the distribution of CDMs in HNC. (A) Schematic representing patients were recruited in this study. TH, thyroid carcinoma; HP, hypopharyngeal carcinoma; OP, oropharyngeal carcinoma; NP, nasopharyngeal carcinoma; OC, oral squamous cell carcinoma. (B) UMAP projection of 326178 cells aggregated from six different datasets. (C) UMAP projection of HNC subtypes aggregated (left) and the violin plot shows the scores of different CDMs in different HNC subtypes (right). (D) UMAP projection of different HNC tissues aggregated (left) and the violin plot shows the scores of different CDMs in different HNC tissues (right). (E) HNC patients were categorized into HPV-positive (left) and HPV-negative (right) groups and the distribution of different CDMs was shown. (F) The status of different CDMs in different disease stages was shown.
Figure 2
Figure 2
Depicting different CDMs in cell subsets based on scRNA-seq atlas. (A) UMAP projection of cell type annotation for HNC single-cell atlas. (B) Dot plot showed the typic marker expression of each subtype. (C) Stacked bar plot showed the proportion of CDMs in each subtype. (D) The Fibroblasts, B, T/NK and Epithelial/Malignant cells in different tissues from HNC, and the distributions of specific CDMs were showed.
Figure 3
Figure 3
T cells from HNC patients manifested high levels of cell death. (A) UMAP projection of T/NK subtypes from HNC based on single-cell atlas. (B) bar plot showed the proportion of T/NK subtypes. Volcano plot showed the differences of cell death models in T/NK subtypes from tumor tissues vs. normal tissues (C), and tumor tissues vs. patients’ PBMCs (D). (E) The heatmap showed the correlations between T cell state and cell death in T/NK cells. *p<0.05, **p<0.01.
Figure 4
Figure 4
The distribution of different CDMs in HNC via Bulk RNA-seq atlas. (A) Box plot showed the different of CDMs between tumor tissues and normal tissues in all TCGA-HNSC bulk RNA sequencing atlas. (B) The correlations of different CDMs and MSI (left) as well as TMB (right). (C) The heatmap showed the correlations between immune score and different CDMs, and dots indicate statistically significant results (D) Dot plot showed correlations between immune cell infiltration and different CDMs. *p<0.05, **p<0.01, ***p<0.001 and ****p<0.0001.
Figure 5
Figure 5
Integrative construction of a consensus CDR signature. (A) A total of 100 kinds of prediction models via LOOCV framework and further calculated the C-index of each model across all validation datasets. (B) LASSO regression analysis of the cell death related genes selected by RSF and superPC. (C) The plot showed the determination of the optima with log(λ) values on the abscissa for LASSO regression analysis. (D) Ten cell death related genes finally obtained in stepwise Cox regression. (E) Distribution of risk score, patients’ survival status and the transcription of indicated genes in high/low risk group from TCGA-HNSC based on our RCD signature. (F) Kaplan-Meier curves of OS according to our CDR signature in TCGA-HNSC. (G) ROC curves for our CDR signature with risk score and clinical data.
Figure 6
Figure 6
Different biofunctions between the high- and low- risk score groups classified by the CDRscore model. (A) Graphical summary of the ten signature genes and the CDMs. (B) GSEA of the upregulation and downregulation in high-risk score group. (C) Box plot showed the different GSVA results between high- and low-risk score groups. (D) Heatmap showed the different immune cell infiltration based on seven different analytic method between high- and low-risk group. *p<0.05, **p<0.01, ***p<0.001 and ****p<0.0001.
Figure 7
Figure 7
Explore the impact of CDRscore risk model at single-cell level based on scRNA-seq. (A) UMAP projection of risk score in different tissues from HNC (left), and dot plot showed the average and percent risk score in different tissues (right). (B) UMAP projection of different patients from GSE181919 based on high- and low- risk scores (left), and the violin plot shows the difference in risk score between high- and low- risk score groups (right). (C) The stacked histogram shows the differences in cell composition between high- and low-risk groups (left), and the dot plot shows the difference in Ro/e values between high- and low-risk groups (right). (D) UMAP projection of the score of DNA replication pathway in malignant cells of patients from high and low-risk groups. The darker the color, the higher the score,which indicating stronger activity of the DNA replication pathway. (E) Dot plot showed the transcription of T cell exhausted-related genes between high- and low-risk score groups. (F) Communication quantities of TGF-βsignaling pathway network among each cell types in high- and low-risk score groups. (G) Different LRIs in high- and low-risk groups. ***p<0.001.
Figure 8
Figure 8
Verification of our CDRscore model via ST. (A) Deconvoluted ST images of normal samples (left) and tumor samples (right) from LSCC, each spot included a pie chart and showed potential cell composition. The pie chart on the right showed the total proportion of cells from two samples, respectively. (B) The ST images showed the transcription of genes from CDR signature in normal and tumor tissues. (C) The median importance of different cell death models in the predicting cell subsets of normal (left), and tumor tissues (middle), and high risk-score was seen in malignant cells (right). (D) ST images showed four different clusters in tumor sample. (E) Statistic analysis of risk score among four different cluster. (F) the proportion of different cell subtypes across clusters. (G) ST images showed the colocalization between risk score and TGF-β signaling (G) and DNA replication (H). (I) The correlations between risk score and TCR signaling pathway (up panel) and the transcription of LAG3 (down panel). ***p<0.0001.

Similar articles

Cited by

References

    1. Chow LQM. Head and Neck Cancer. N Engl J Med. (2020) 382(1):60–72. doi: 10.1056/NEJMra1715715 - DOI - PubMed
    1. Bray F, Ferlay J, Soerjomataram I, Siegel RL, Torre LA, Jemal A. Global cancer statistics 2018: GLOBOCAN estimates of incidence and mortality worldwide for 36 cancers in 185 countries. CA Cancer J Clin. (2018) 68(6):394–424. doi: 10.3322/caac.21492 - DOI - PubMed
    1. Hellström H, Liedes J, Rainio O, Malaspina S, Kemppainen J, Klén R. Classification of head and neck cancer from PET images using convolutional neural networks. Sci Rep. (2023) 13:10528. doi: 10.1038/s41598-023-37603-1 - DOI - PMC - PubMed
    1. Dauby N. Head and neck cancer. New Engl J Med. (2020) 382:e57. doi: 10.1056/NEJMc2001370 - DOI - PubMed
    1. Yuan JY, Ofengeim D. A guide to cell death pathways. Nat Rev Mol Cell Bio. (2024) 25:379–95. doi: 10.1038/s41580-023-00689-6 - DOI - PubMed

Substances