

Exploring the role of neutrophil extracellular traps in neuroblastoma: identification of molecular subtypes and prognostic implications
- PMID: 39575432
- PMCID: PMC11578966
- DOI: 10.3389/fonc.2024.1361871
Exploring the role of neutrophil extracellular traps in neuroblastoma: identification of molecular subtypes and prognostic implications
Abstract
Background: Cancer cells induce neutrophil extracellular traps (NETs) to promote tumor progression and metastasis. However, only a few studies have focused on the role of NETs in Neuroblastoma (NB).
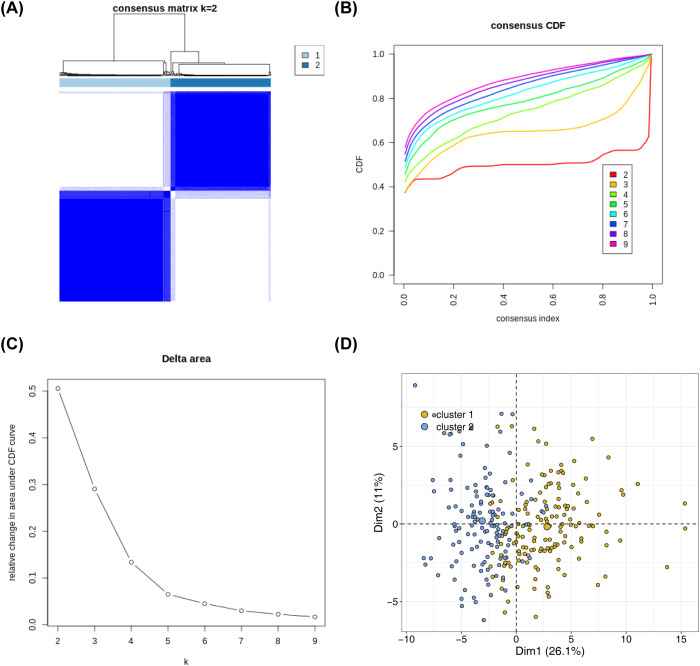
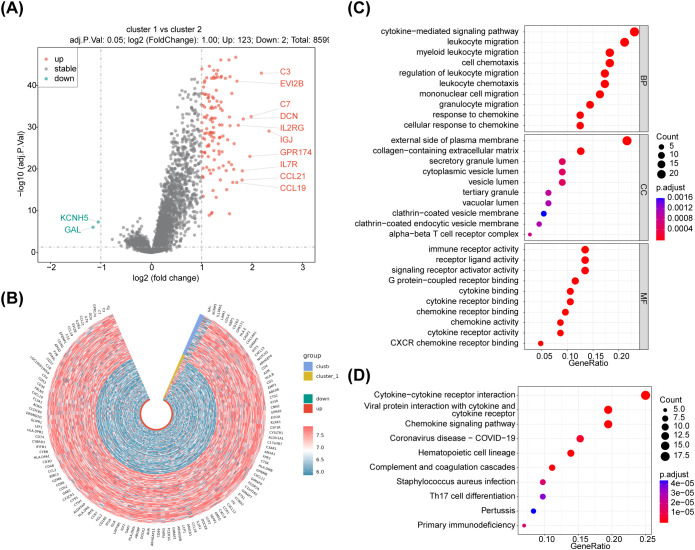
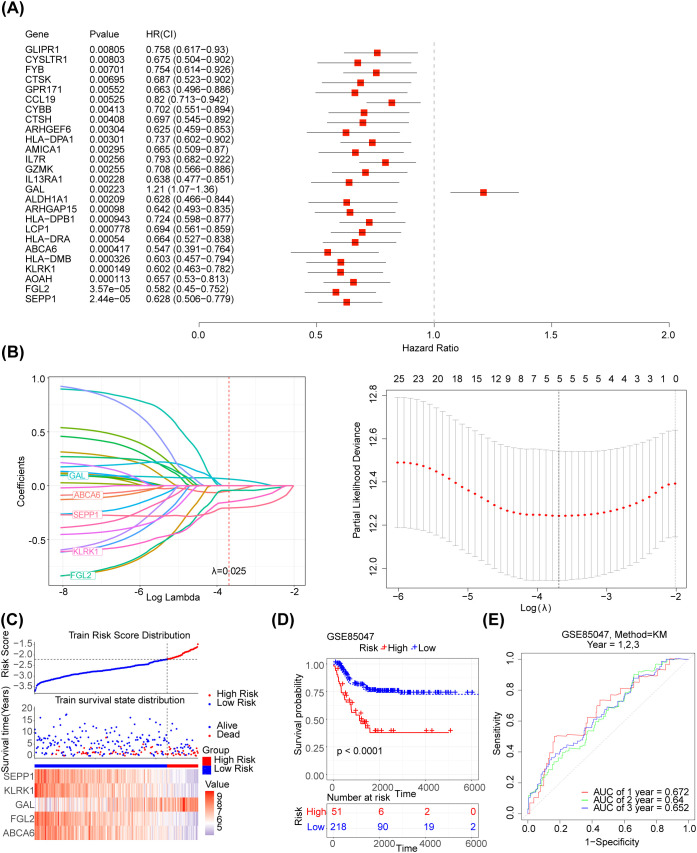
Methods: First, based on the expression of NET-related genes, consensus clustering analysis was conducted to cluster NB samples into different subtypes. Differential analysis was performed to identify DEGs between subtypes. Functional items and related pathways of DEGs were identified using enrichment analysis. Univariate Cox analysis and the LASSO algorithm were used to identify biomarkers for prognosis. Furthermore, independent prognostic analysis was performed. Immune infiltration analysis was performed to identify differential immune cells. Finally, the verification of prognostic model genes were taken by the immunohistochemical staining and quantitative real-time PCR.
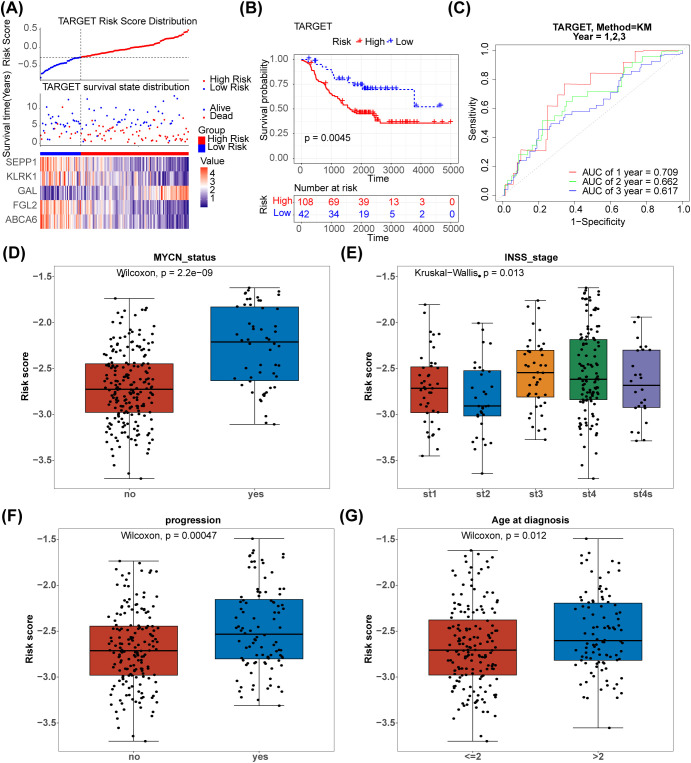
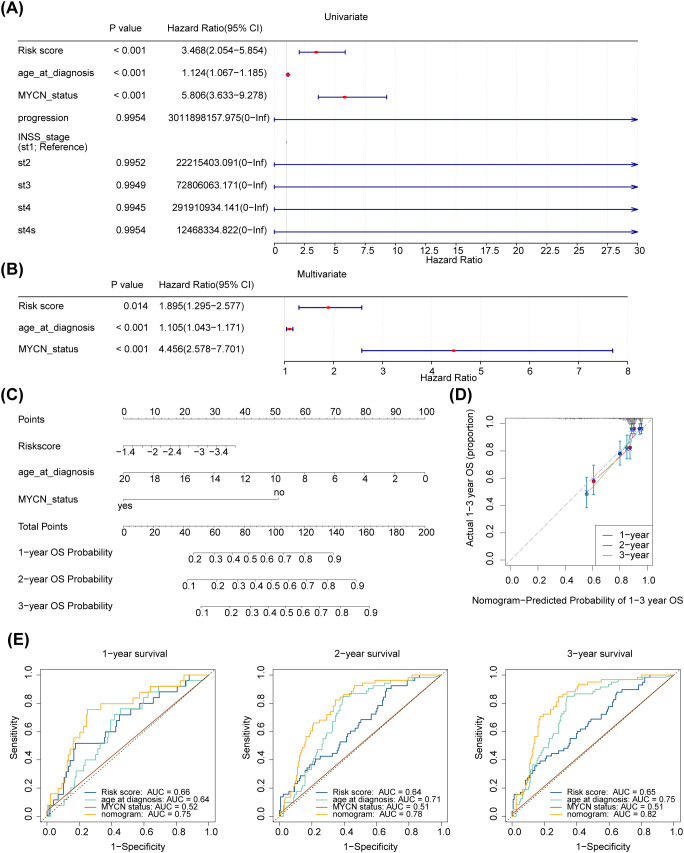
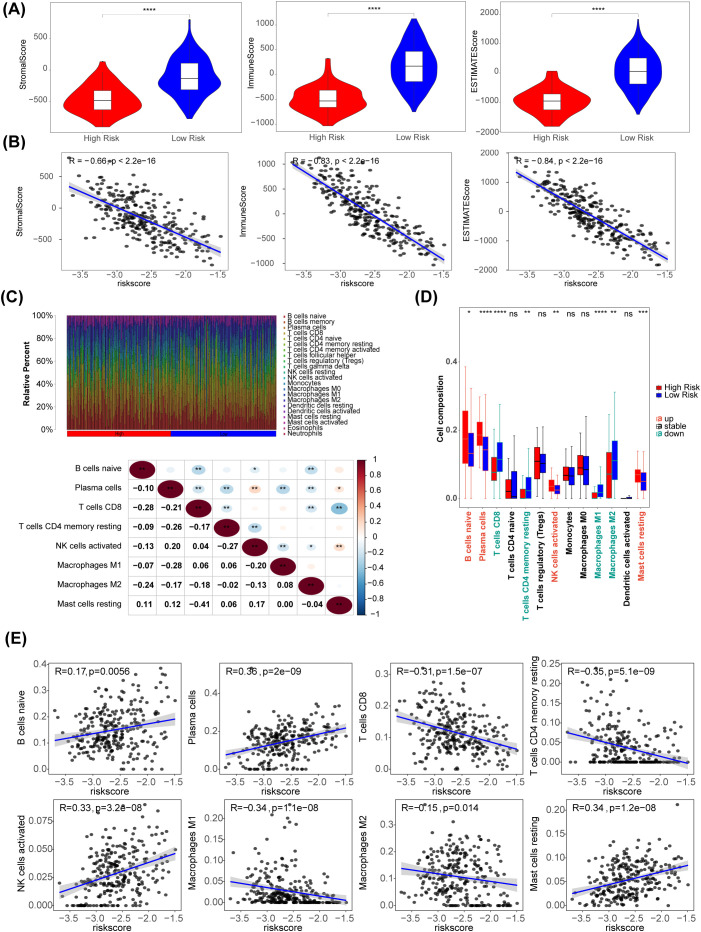
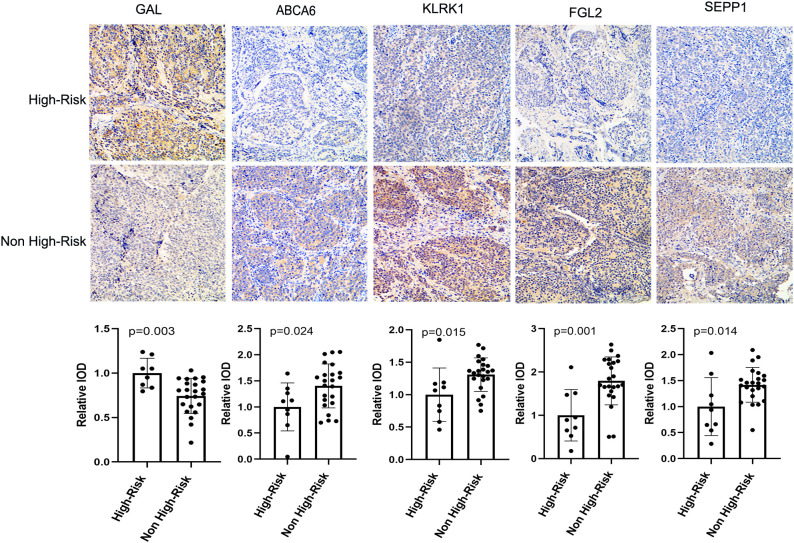
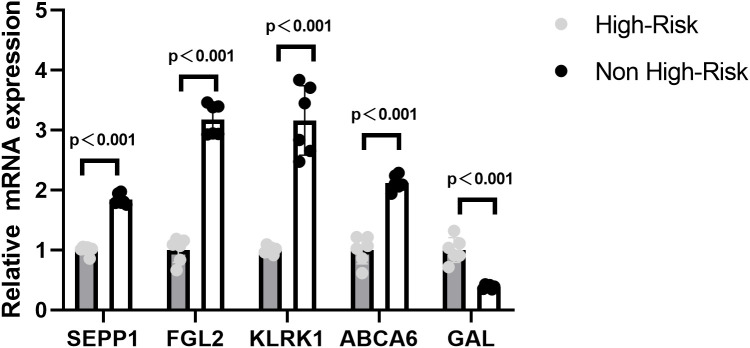
Results: Consensus clustering analysis demonstrated that NB samples were clustered into two subtypes. There were 125 DEGs between the two subtypes of NB. Moreover, the enrichment analysis results showed that the DEGs were mainly associated with 'external side of plasma membrane,' 'immune receptor activity' 'regulation of leukocyte migration' GO items. There were also several GO items related to neutrophils, such as regulation of neutrophil migration and differentiation. KEGG pathways revealed that the DEGs were correlated with in immunity-related activities, including 'Complement and coagulation cascades,' 'Neutrophil extracellular trap formation, 'T cell receptor signaling pathway,' 'PD-L1 expression and PD-1 checkpoint pathway in cancer' and so on. A total of five biomarkers,[Selenoprotein P1 (SEPP1), Fibrinogen-like protein 2 (FGL2), NK cell lectin-like receptor K1 (KLRK1), ATP-binding cassette transporters 6(ABCA6) and Galectins(GAL)], were screened, and a risk model based on the biomarkers was created. Furthermore, a nomogram for forecasting the survival rates of patients with NB was established based on the risk score, age at diagnosis, and MYCN status. Eight differential immune cells (CD8 + T cells, resting mast cells, etc.) were acquired between the two risk subgroups. The expression levels of five prognostic model genes at the protein and mRNA were verified and all results were consistent with the results of our bioinformatics analysis.
Conclusion: We initially found that five NET-related genes were significantly differentially expressed in NETs-associated molecular isoforms and two Netrg molecular isoforms were found to be associated with poorer prognosis. This stratification might provide insight into the prediction of prognosis and ideal immunotherapy strategies for patients with NB. However, we also noted that the formation of NETs is a complex biological process involving the regulation of multiple cytokines and cellular interactions. Therefore, the exact roles of these genes and their specific mechanisms in the formation of NETs and the development of NB still need to be further investigated.
Keywords: immune; inflammation; neuroblastoma; neutrophil extracellular traps; prognosis.
Copyright © 2024 Qi, Zhao, Chen, Wang, Zhou and Duan.
Conflict of interest statement
The authors declare that the research was conducted in the absence of any commercial or financial relationships that could be construed as a potential conflict of interest.
Figures
Similar articles
-
Identification of cuproptosis-related subtypes, construction of a prognosis model, and tumor microenvironment landscape in gastric cancer.Front Immunol. 2022 Nov 21;13:1056932. doi: 10.3389/fimmu.2022.1056932. eCollection 2022. Front Immunol. 2022. PMID: 36479114 Free PMC article.
-
Identification of novel neutrophil-extracellular-traps-related genes as biomarkers for breast cancer prognosis and immunotherapy.Transl Cancer Res. 2025 Mar 30;14(3):1737-1752. doi: 10.21037/tcr-24-1826. Epub 2025 Mar 27. Transl Cancer Res. 2025. PMID: 40224973 Free PMC article.
-
Prediction of prognosis and immunotherapy response in breast cancer based on neutrophil extracellular traps-related classification.Front Mol Biosci. 2023 May 26;10:1165776. doi: 10.3389/fmolb.2023.1165776. eCollection 2023. Front Mol Biosci. 2023. PMID: 37304069 Free PMC article.
-
Prognosis and immune infiltration prediction in neuroblastoma based on neutrophil extracellular traps-related gene signature.Sci Rep. 2025 Feb 13;15(1):5343. doi: 10.1038/s41598-025-88608-x. Sci Rep. 2025. PMID: 39948114 Free PMC article.
-
Neutrophil extracellular traps-associated modification patterns depict the tumor microenvironment, precision immunotherapy, and prognosis of clear cell renal cell carcinoma.Front Oncol. 2022 Dec 22;12:1094248. doi: 10.3389/fonc.2022.1094248. eCollection 2022. Front Oncol. 2022. PMID: 36620592 Free PMC article.
References
LinkOut - more resources
Full Text Sources
Research Materials
Miscellaneous