. 2025 May 15;27(4):1061-1075.
doi: 10.1093/neuonc/noae255.

Inhibition of mitochondrial bioenergetics and hypoxia to radiosensitize diffuse intrinsic pontine glioma

Affiliations

Inhibition of mitochondrial bioenergetics and hypoxia to radiosensitize diffuse intrinsic pontine glioma

Han Shen et al. Neuro Oncol. .

Abstract

Background: Diffuse intrinsic pontine gliomas (DIPGs) and other H3K27M-mutated diffuse midline gliomas (DMGs) are brain tumors that primarily affect children. Radiotherapy is the standard of care but only provides only temporary symptomatic relief due to radioresistance. Although hypoxia is a major driver of radioresistance in other tumors, there is no definitive evidence that DIPGs are hypoxic. Diffuse intrinsic pontine gliomas often contain histone mutations, which alter tumor metabolism and are also associated with radioresistance. Our objective was to identify the metabolic profiles of DIPG cells, detect hypoxia signatures, and uncover metabolism-linked mechanisms of radioresistance to improve tumor radiosensitivity.

Methods: Using DIPG models combined with clinical datasets, we examined mitochondrial metabolism and signatures of hypoxia. We explored DIPG reliance on mitochondrial metabolism using extracellular flux assays and targeted metabolomics. In vitro and in vivo models were used to explore the mechanisms of targeting mitochondrial bioenergetics and hypoxia for radiosensitization. Treatment-induced transcriptomics and metabolomics were also investigated.

Results: Comprehensive analyses of DIPG cells show signatures of enhanced oxidative phosphorylation (OXPHOS). We also identified increased expression of specific OXPHOS-related genes and signatures of hypoxia gene expression in datasets obtained from DIPG patients. We found the presence of hypoxia in orthotopic mouse models bearing DIPG tumors. These findings enabled us to develop a proof-of-concept treatment strategy to enhance radiosensitivity of DIPGs in vitro and in animal models.

Conclusions: Diffuse intrinsic pontine glioma cells rely on mitochondrial metabolism for growth, and targeting mitochondria disrupts bioenergetics, alleviates hypoxia, and enhances radiosensitivity. These findings warrant further exploration of OXPHOS inhibition as a radiosensitizing strategy for DIPG treatment.

Keywords: diffuse intrinsic pontine gliomas; hypoxia; mitochondria; radiotherapy.


Conflict of interest statement

The authors have declared that no conflict of interest exists.

Figures

Graphical Abstract
Graphical Abstract
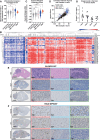
Figure 1.
Figure 1.
Characterization of bioenergetic profiles of DIPG cell lines. (A) Seahorse XF assay measurements of mitochondrial ATP (mitoATP) and glycolytic ATP (glycoATP) in DIPG cell lines. (B) The percentage of total ATP production resulting from oxidative phosphorylation (OXPHOS) or glycolysis in DIPG cell lines. (C) Cell doubling time of DIPG cell lines. (D) Correlation between ATP production and basal respiration. (E) Correlation between basal respiration and doubling time. (F) Correlation between ATP production and doubling time. (G) Mitochondrial Complex I gene expression score for nontumor cell lines (NSC and NHB) and DIPG cell lines derived from the CCMA.
Figure 2.
Figure 2.
DIPG tumors show evidence of increased OXPHOS/hypoxia-related gene expression and signatures. (A) Mitochondrial Complex I gene expression scores for normal brain tissues (GTEx, age not specified; caudate n = 246; hypothalamus n = 202) and pediatric brain tumor subtypes which largely consisted of patients of 21 years of age and younger (BSG-DIPG n = 10; DMG-H3K27M n = 220), except glioblastoma (GBM, n = 167). (B) Heatmap of DIPG-H3K27 altered pediatric patient tumor (by sample) and expression levels of individual mitochondrial Complex I genes. (C) Hypoxia metagene expression scores for normal brain tissues (GTEx, caudate n = 246; hypothalamus n = 202), pediatric brain tumor subtypes (BSG-DIPG n = 10; DMG-H3K27M n = 220), and adult GBMs (n = 167). (D) Correlation between hypoxia metagene score and mitochondrial Complex I gene expression score for individual pediatric tumors (BSG-DIPG n = 10 and DIPG-H3K27M n = 220) or normal brain tissue samples (caudate n = 246; hypothalamus n = 202) shown in (A), (B), and (C). (E) H&E and immunohistochemistry staining (HIF-1α and VEGFA) for SU-DIPG13P* tumors taken from an orthotopic mouse model. The second (red), third (blue), and fourth (green) columns show zoomed-in images of tumor cells, normal cerebral cortex, and normal granular layer of cerebellum of mouse brains, respectively. (F) Immunohistochemistry staining (H3K27M, EF-5, Pimonidazole) for HSJD-DIPG-007 tumors taken from an orthotopic mouse model. (G) Data from the oxygen probe inserted stereotactically into orthotopic xenograft models of SU-DIPG13P* (graphed by the depth of insertion from the skull).
Figure 3.
Figure 3.
Efficacy of targeting mitochondria with biguanides (metformin and phenformin) in DIPG cells. (A) Viability of three representative DIPG cell lines (HSJD-DIPG007, SU-DIPG6, and 17) treated with metformin (met) and phenformin (phen) for 72 h. (B) Seahorse XF Extracellular Flux assay measures OCR and extracellular acidification rate (ECAR) of SU-DIPG17 cells treated with metformin and phenformin as acute injections. (C) Metformin and phenformin inhibit mitochondrial Complex I-dependent OCR in HSJD-DIPG007 cells; effect of phenformin on (D) mitochondrial functions, (E) ATP production rate, (F) ATP rate index, and (G) phosphorylated AMPK (p-AMPK) and total AMPK (t-AMPK) in HSJD-DIPG007 and SU-DIPG17 cells. *P < .05, **P < .01, ***P < .001, and ****P < .0001 (vs. control).
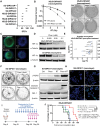
Figure 4.
Figure 4.
Phenformin radiosensitizes DIPGs in vitro and in vivo by reducing hypoxia. (A) Survival fractions (SFs) of DIPG cell lines 14 days after radiotherapy (RT, 2Gy). (B) SF and representative images of HSJD-DIPG007 neurospheres (growing in soft agar) treated with RT alone and RT in combination with phenformin (Phen). (C) Image-iT measurement of hypoxia within phenformin-treated DIPG neurospheres (HSJD-DIPG007, SU-DIPG6). The green fluorescence indicates low oxygen level, <5% vol/vol. The Blue, Hoechst nuclear staining. (D) HIF-1α expression in phenformin-treated DIPG neurospheres (HSJD-DIPG007, SU-DIPG6). (E) Effect of phenformin on hypoxia gene expression in HSJD-DIPG007 neurospheres, fold change (FC), and false discovery rate (FDR). (F) Representative colony formation images of SU-DIPG17 cells (growing as adherent monolayer culture) treated with RT, phenformin, or combination. (G) Western blot of γ-H2AX, cleaved caspase 3, and Mcl-1 in monolayer culture of SU-DIPG17 cells treated with phenformin (0.5 mM), RT (2 Gy) or combination. (H) Confocal microscopy of γ-H2AX staining (green) and Hoechst nuclear staining (blue) in SU-DIPG17 monolayer culture treated with phenformin (0.5 mM), RT (2 Gy), or combination. (I) Schematic of in vivo experiment showing injection and treatment schedule. (J) Kaplan-Meier survival curves of an orthotopic model of HSJD-DIPG007 treated with phenformin, RT, and combination. ###P = .0004, HR = 4.310 (95% CI: 1.129–16.46) (control vs. Phen + RT); $$$P = .0007, HR = 3.670 (95% CI: 1.117–12.06) (Phen vs. Phen + RT); **P = .0011 HR = 3.7 (95% CI: 1.030–13.33) (RT vs. Phen + RT).
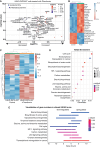
Figure 5.
Figure 5.
DIPG cells treated with phenformin have widely disrupted cellular metabolism. (A) Volcano plot of key metabolite changes in phenformin-treated HSJD-DIPG007 cells as measured in targeted metabolomics (n = 4). The figure was made using Metaboanalyst 5.0. (B) Heatmap of metabolite changes shown in (A) (n = 3). (C) Heatmap of all significantly DEGs from RNA sequencing between control and phenformin-treated HSJD-DIPG007 cells. Row scaling and hierarchical clustering were applied to both rows and columns. The color represents the FC (log2). A KEGG enrichment analysis dot plot (D) was performed for the DEGs shown in (C); the number of upregulated and downregulated genes within individual KEGG terms (E) is displayed.
Figure 6.
Figure 6.
Schematic of selected metabolic and transcriptomic changes following phenformin treatment of HSJD-DIPG-007 cells. Increased quantity for a metabolite or RNA is shown in red, while decreases are highlighted in blue. Metabolites or RNAs that were either not measured or did not change are in black.

References

    1. Wu G, Broniscer A, McEachron TA, et al.; St. Jude Children's Research Hospital–Washington University Pediatric Cancer Genome Project. Somatic histone H3 alterations in pediatric diffuse intrinsic pontine gliomas and non-brainstem glioblastomas. Nat Genet. 2012;44(3):251–253. - PMC - PubMed
    1. Schwartzentruber J, Korshunov A, Liu XY, et al. Driver mutations in histone H3.3 and chromatin remodelling genes in paediatric glioblastoma. Nature. 2012;482(7384):226–231. - PubMed
    1. Khuong-Quang DA, Buczkowicz P, Rakopoulos P, et al. K27M mutation in histone H3.3 defines clinically and biologically distinct subgroups of pediatric diffuse intrinsic pontine gliomas. Acta Neuropathol. 2012;124(3):439–447. - PMC - PubMed
    1. Chung C, Sweha SR, Pratt D, et al. Integrated metabolic and epigenomic reprograming by H3K27M mutations in diffuse intrinsic pontine gliomas. Cancer Cell. 2020;38(3):334–349.e9. - PMC - PubMed
    1. Ashton TM, McKenna WG, Kunz-Schughart LA, Higgins GS. Oxidative phosphorylation as an emerging target in cancer therapy. Clin Cancer Res. 2018;24(11):2482–2490. - PubMed

MeSH terms