. 2024 Nov;92(5):e70016.
doi: 10.1111/aji.70016.

Galectin-1 Elicits a Tissue-Specific Anti-Inflammatory and Anti-Degradative Effect Upon LPS-Induced Response in an Ex Vivo Model of Human Fetal Membranes Modeling an Intraamniotic Inflammation

Affiliations

Galectin-1 Elicits a Tissue-Specific Anti-Inflammatory and Anti-Degradative Effect Upon LPS-Induced Response in an Ex Vivo Model of Human Fetal Membranes Modeling an Intraamniotic Inflammation

Jazmin Hernández-Rodríguez et al. Am J Reprod Immunol. 2024 Nov.

Abstract

Problem: Intrauterine infection is one of the most jeopardizing conditions associated with adverse outcomes, including preterm birth; however, multiple tolerance mechanisms operate at the maternal-fetal interface to avoid the rejection of the fetus. Among the factors that maintain the uterus as an immunoprivileged site, Galectin-1 (Gal-1), an immunomodulatory glycan-binding protein secreted by the maternal-fetal unit, is pivotal in promoting immune cell homeostasis. This work aimed to evaluate the role of Gal-1 during a lipopolysaccharide (LPS)-induced-inflammatory milieu.

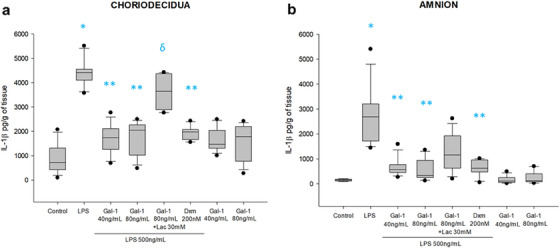
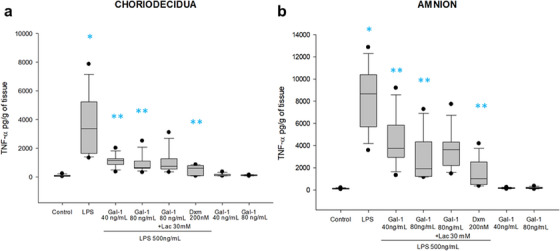
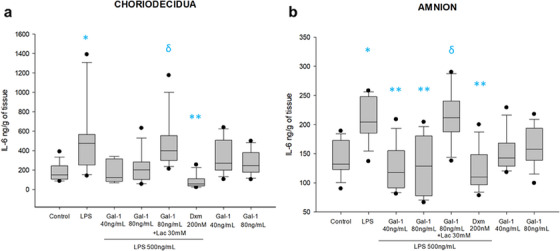
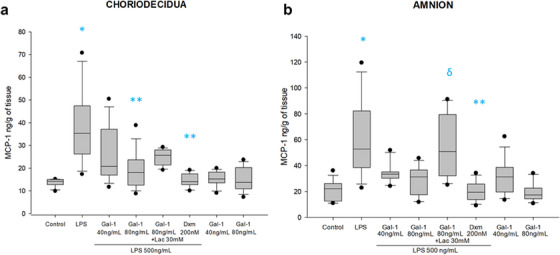
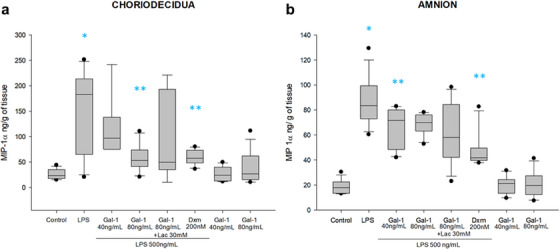
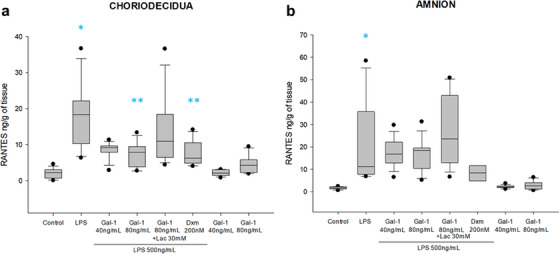
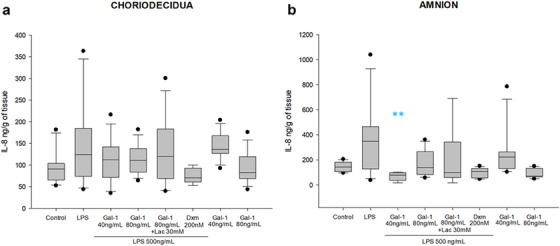
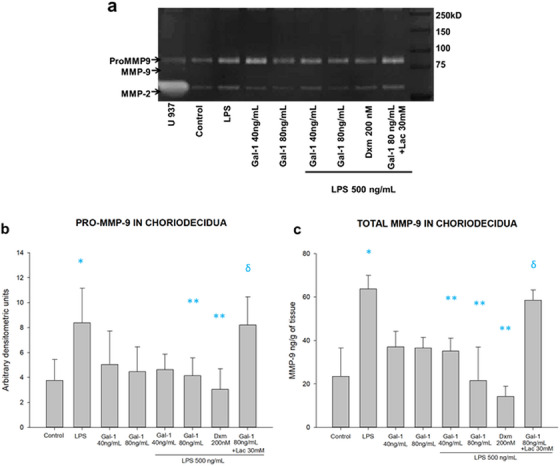
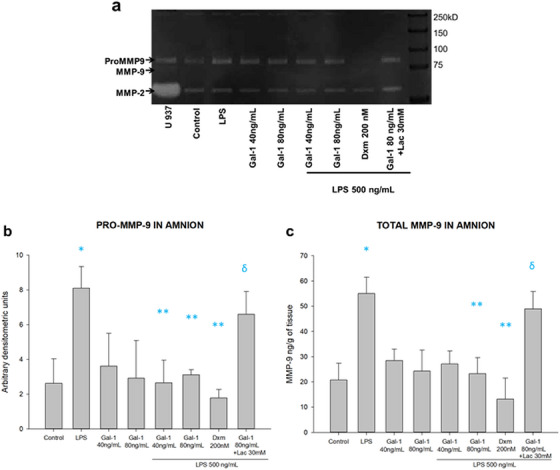
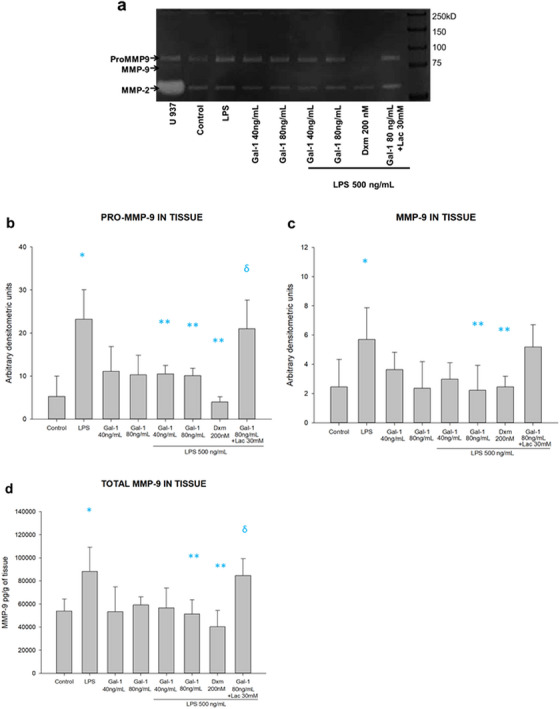
Method of study: Using an ex vivo culture with two independent compartments, human fetal membranes at term were pretreated with 40 and 80 ng/mL of Gal-1, then to reproduce an intraamniotic inflammation, the fetal side of membranes was stimulated with 500 ng/mL of LPS for 24 h. The concentrations of tumor necrosis factor (TNF)-α, interleukin (IL)-1β, IL-6, monocyte chemoattractant protein (MCP1), macrophage inflammatory protein (MIP1) α, regulated upon activation normal T cell expressed and secreted (RANTES), and matrix metalloproteinase (MMP)-9 were measured in both amnion and choriodecidua compartments.

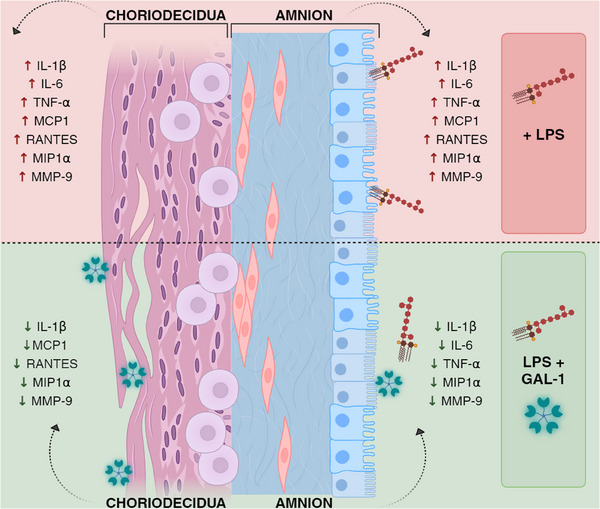
Results: In a tissue-specific fashion profile, pretreatment with the physiologic concentration of Gal-1 significantly diminished the LPS-dependent secretion of TNF-α, IL-1β, Il-6, MCP1, MIP1α, RANTES, and MMP-9.

Conclusion: Gal-1 elicits an anti-inflammatory effect on the human fetal membranes stimulated with LPS, which supports the hypothesis that Gal-1 is part of the immunomodulatory mechanisms intended to stop the harmful effect of inflammation of the maternal-fetal interface.

Keywords: galectin‐1; human chorioamniotic membranes; inflammation; intraamniotic infection; maternal‐fetal unit; preterm birth; preterm labor; tolerogenic.


Conflict of interest statement

The authors declare no conflicts of interest.

Figures

FIGURE 1
FIGURE 1
IL‐1β secretion profile in choriodecidua and amnion. Quantification by ELISA (a) in choriodecidua and (b) amnion culture medium. Plots are presented as boxes and whiskers: graphs show medians with interquartile range. Outliers are indicated by closed circles. LPS: lipopolysaccharide 500 ng/mL, Dxm: dexamethasone (200 nM), lac: Lac (30 mM). Significant differences versus * control, **LPS, and ẟ versus Gal‐1 80ng+LPS (p ≤ 0.05) are indicated.
FIGURE 2
FIGURE 2
TNF‐α secretion profile in chorion and amnion. Quantification by ELISA (a) in chorion and (b) amnion culture medium. Plots are presented as boxes and whiskers: graphs show medians with interquartile range. Outliers are indicated by closed circles. LPS: lipopolysaccharide 500 ng/mL, Dxm: dexamethasone (200 nM), lac: Lac (30 mM). Significant differences versus * control, **LPS, and ẟ versus Gal‐1 80ng+LPS (p ≤ 0.05) are indicated.
FIGURE 3
FIGURE 3
IL‐6 secretion profile in chorion and amnion. Quantification by ELISA (a) in chorion and (b) amnion culture medium. Because the data did not show a normal distribution, they are presented as boxes and whiskers: graphs show medians with interquartile range. Outliers are indicated by closed circles. LPS: lipopolysaccharide 500 ng/mL, Dxm: dexamethasone (200 nM), lac: Lac (30 mM). Significant differences versus * control, **LPS, and ẟ versus Gal‐1 80ng+LPS (p < 0.05) are indicated.
FIGURE 4
FIGURE 4
Secretion profile of MCP‐1 in chorion and amnion. Quantification by ELISA in (a) chorion and (b) amnion culture medium. Plots are presented as boxes and whiskers: graphs show medians with interquartile range. Outliers are indicated by closed circles. LPS: lipopolysaccharide 500 ng/mL, Dxm: dexamethasone (200 nM), lac: Lac (30 mM). Significant differences versus * control, **LPS, and ẟ versus Gal‐1 80ng+LPS (p ≤ 0.05) are indicated.
FIGURE 5
FIGURE 5
Secretion profile of MIP‐1α in chorion and amnion. Quantification by ELISA in (a) chorion and (b) amnion culture medium. Plots are presented as boxes and whiskers: graphs show medians with interquartile range. Outliers are indicated by closed circles. LPS: lipopolysaccharide 500 ng/mL, Dxm: dexamethasone (200 nM), lac: Lac (30 mM). Significant differences versus * control, **LPS, and ẟ versus Gal‐1 80ng+LPS (p ≤ 0.05) are indicated.
FIGURE 6
FIGURE 6
RANTES secretion profile in chorion and amnion. Quantification by ELISA in (a) chorion and (b) amnion culture medium. Plots are presented as boxes and whiskers: graphs show medians with interquartile range. Outliers are indicated by closed circles. LPS: lipopolysaccharide 500 ng/mL, Dxm: dexamethasone (200 nM), lac: Lac (30 mM). Significant differences versus * control, **LPS, and ẟ versus Gal‐1 80ng+LPS (p ≤ 0.05) are indicated.
FIGURE 7
FIGURE 7
IL‐8 secretion profile in chorion and amnion. Quantification by ELISA in (a) chorion and (b) amnion culture medium. Plots are presented as boxes and whiskers: graphs show medians with interquartile range. LPS: lipopolysaccharide 500 ng/mL, Dxm: dexamethasone (200 nM), lac: Lac (30 mM). Significant differences versus *control, **LPS and ẟ versus Gal‐1 80ng+LPS (p ≤ 0.05) are indicated.
FIGURE 8
FIGURE 8
Activity and secretion profile of MMP‐9 in chorion. (a) Representative zymogram showing the enzymatic activity of pro MMP‐9 (lysis bands) in culture medium from the chorion. (b) Quantification by densitometric analysis of the zymogen. (c) Quantification of total MMP‐9 (active and proenzyme) by ELISA in chorion culture medium. LPS: lipopolysaccharide 500 ng/mL, Dxm: dexamethasone (200 nM), Lac (30 mM). Each bar represents the mean and standard deviation; significant differences (p ≤ 0.05) are indicated * versus control, ** versus LPS and ẟ versus Gal‐1 80ng+LPS.
FIGURE 9
FIGURE 9
Activity and secretion profile of MMP‐9 in amnion. (a) Representative zymogram showing the enzymatic activity of pro MMP‐9 (lysis bands) in culture medium from the amnion. (b) Quantification by densitometric analysis of the zymogen. (c) Quantification of total MMP‐9 (active and proenzyme) by ELISA in amnion culture medium. LPS: lipopolysaccharide 500 ng/mL, Dxm: dexamethasone (200 nM), lac: Lac (30 mM). Each bar represents the mean and standard deviation; significant differences (p ≤ 0.05) are indicated * versus control, ** versus LPS and ẟ versus Gal‐1 80ng + LPS.
FIGURE 10
FIGURE 10
Activity and secretion profile of MMP‐9 in tissue. (a) Representative zymogram showing the enzymatic activity of Pro MMP‐9 (92 kDa) and the active isoform (82 kDa) in fetal membranes lysates. (b) Quantification by densitometric analysis of the zymogen and (c) the active form. (d) Quantification of total MMP‐9 (active and zymogenic) by ELISA. LPS: lipopolysaccharide 500 ng/mL, Dxm: dexamethasone (200 nM), lac: Lac (30 mM). Each bar represents the mean and standard deviation; significant differences versus * control, ** LPS, and ẟ versus Gal‐1 80ng+LPS ( p ≤ 0.05) are indicated.
FIGURE 11
FIGURE 11
Efect of Gal‐1 treatment on structure of fetal membranes. Histological examination to evaluate structural changes damage to the fetal membranes after different treatments. (a) Control 0 h, (b) Control 72 h, (c) LPS (500 ng/mL) treatment, (d) co‐treatment with LPS (500 ng/mL) and Gal‐1 (40 ng/mL), (e) co‐treatment with LPS (500 ng/mL) and Gal‐1 (80 ng/mL), (f) co‐treatment with LPS (500 ng/mL) and Gal‐1 (80 ng/mL) and Lac (30 mM), (g) co‐treatment with LPS (500 ng/mL) and Dxm (200 nM), (h) Gal‐1 treatment(40 ng/mL), (i) Gal‐1 treatment(80 ng/mL). The amnion (AMN) of the fetal membranes is composed of amniotic epithelium (AE), fibrous layer (FL), spongy layer (SL), and reticular layer (RL), while the choriodecidua (CHD) contains trophoblast cells. Arrows show the zones with clear structural damage. Original magnification (20×).
FIGURE 12
FIGURE 12
Role of Gal‐1 in the human fetal membranes. Gal‐1 induces a tissue‐specific anti‐inflammatory and anti‐degrative effect on human fetal membranes stimulated and inflamed with LPS. Amnion and choriodecidua regions respond differentially to the stimulus, with Gal‐1 offering a compartmentalized response to the fetus and mother.

Similar articles

References

    1. Ohuma E. O., Moller A. B., Bradley E., et al., “National, Regional, and Global Estimates of Preterm Birth in 2020, With Trends From 2010: A Systematic Analysis,” Lancet 402, no. 10409 (2023): 1261–1271, 10.1016/S0140-6736(23)00878-4. - DOI - PubMed
    1. Perin J., Mulick A., Yeung D., et al., “Global, Regional, and National Causes of Under‐5 Mortality in 2000–19: An Updated Systematic Analysis With Implications for the Sustainable Development Goals,” Lancet Child Adolesc Health 6, no. 2 (2022): 106–115, 10.1016/S2352-4642(21)00311-4. - DOI - PMC - PubMed
    1. Secretaria de Salud . Cada Año Nacen En México 200 Mil Bebés Prematuros: Secretaría de Salud. 2022. Accessed July 29, 2024. https://www.gob.mx/salud/prensa/558‐cada‐ano‐nacen‐en‐mexico‐200‐mil‐beb....
    1. Menon R. and Richardson L. S., “Preterm Prelabor Rupture of the Membranes: A Disease of the Fetal Membranes,” Seminars in Perinatology 41, no. 7 (2017): 409–419, 10.1053/j.semperi.2017.07.012. - DOI - PMC - PubMed
    1. Lee W. L., Chang W. H., and Wang P. H., “Risk Factors Associated with Preterm Premature Rupture of Membranes (PPROM),” Taiwanese Journal of Obstetrics and Gynecology 60, no. 5 (2021): 805–806, 10.1016/j.tjog.2021.07.004. - DOI - PubMed