. 2024 Dec 15;137(24):jcs262182.
doi: 10.1242/jcs.262182. Epub 2024 Dec 23.

AMPK associates with and causes fragmentation of the Golgi by phosphorylating the guanine nucleotide exchange factor GBF1

Affiliations

AMPK associates with and causes fragmentation of the Golgi by phosphorylating the guanine nucleotide exchange factor GBF1

Jordana B Freemantle et al. J Cell Sci. .

Abstract

AMP-activated protein kinase (AMPK) is an energy sensor that regulates cellular functions in response to changes in energy availability. However, whether AMPK activity is spatially regulated, and the implications for cell function, have been unclear. We now report that AMPK associates with the Golgi, and that its activation by two specific pharmacological activators leads to Golgi fragmentation similar to that caused by the antibiotic Golgicide A, an inhibitor of Golgi-specific Brefeldin A resistance factor-1 (GBF1), a guanine nucleotide exchange factor that targets ADP-ribosylation factor 1 (ARF1). Golgi fragmentation in response to AMPK activators is lost in cells carrying gene knockouts of AMPK-α subunits. AMPK has been previously reported to phosphorylate GBF1 at residue Thr1337, and its activation causes phosphorylation at that residue. Importantly, Golgi disassembly upon AMPK activation is blocked in cells expressing a non-phosphorylatable GBF1-T1337A mutant generated by gene editing. Furthermore, the trafficking of a plasma membrane-targeted protein through the Golgi complex is delayed by AMPK activation. Our findings provide a mechanism to link AMPK activation during cellular energy stress to downregulation of protein trafficking involving the Golgi.

Keywords: AMP-activated protein kinase; Golgi; Membrane trafficking; Protein secretion; Subcellular localization.


Conflict of interest statement

Competing interests The authors declare no competing or financial interests.

Figures

Fig. 1.
Fig. 1.
Targeting of β1 complexes to different subcellular locations. Images show fluorescence micrographs obtained by deconvolution microscopy (0.2 µm optical sections) of transfected HeLa cells co-expressing β1 with GFP–α1 (A–C) or GFP–α2 (D–F), and γ1 (A,D), γ2 (B,E) or γ3 (C,F). The enrichment of fluorescence adjacent to one pole of the nucleus is indicated by yellow arrows. Images representative of five repeats. Scale bars: 10 µm.
Fig. 2.
Fig. 2.
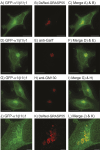
The juxtanuclear region where AMPK is enriched contains the Golgi. Images were obtained by deconvolution microscopy and are whole-cell projections of fixed HeLa cells co-transfected with GFP–α1, β1 and γ1, that had been either co-transfected with DNA encoding DsRed–GRASP55 (A–C,J–L), or counterstained with Texas Red-labelled antibodies against GalT (D–F) or GM130 (G–I). Left-hand panels show GFP fluorescence (green), centre panels show DsRed or Texas Red fluorescence, and right-hand panels show merged images. Images representative of at least three repeats. Scale bars: 15 µm (A–I); 2 µm (J–L).
Fig. 3.
Fig. 3.
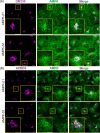
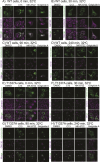
Endogenous AMPK-β1 and -β2 are associated with the Golgi. IFM (optical slices) of U2OS cells stained with anti-β1 or anti-β2 antibodies (green) reveals that they partially colocalize with (A) GM-130 (a cis-Golgi marker, magenta) or (B) ACBD3 (a medial-Golgi marker, magenta) as revealed by the merged images (right). The large yellow rectangles (insets) are the areas indicated by small yellow rectangles at higher magnification. Images representative of six repeats. Scale bars: 10 µm (main images); 5 µm (insets).
Fig. 4.
Fig. 4.
Activation of AMPK and/or inhibition of GBF1 cause phosphorylation of AMPK targets including GBF1 and disaggregation of the Golgi. (A) Duplicate dishes of parental (WT), T1337A knock-in or AMPK-α1/-α2 (α1/α2) DKO cells were treated for 1 h with 0.1% DMSO (vehicle control), 300 µM C13 or 200 nM MK-8722, cell lysates were analysed by SDS-PAGE and blots probed for the phosphorylated or total proteins shown. Image of blot representative of three repeats. (B) Parental (WT), T1337A knock-in or AMPK-α1/-α2 DKO cells were treated for 1 h with 0.1% DMSO, 300 µM C13, 200 nM MK-8722 or 1 µM Golgicide A, fixed, and stained with antibody against the cis-Golgi marker GM130. The large white rectangles (insets) are the areas indicated by smaller white rectangles at higher magnification. The results in B are quantified in Fig. S5. Scale bars: 10 µm (main images); 5 µm (insets).
Fig. 5.
Fig. 5.
Changes in colocalization of GM130 and GBF1 with AMPK-β1, and GBF1 with GM130 in WT and T1337A knock-in cells treated with C13, MK-8722 or Golgicide A. Cells were incubated with 0.1% DMSO, 300 µM C13, 200 nM MK-8722 or 1 µM Golgicide A for 1 h. The images were obtained by staining with the indicated antibodies in the left-hand and centre panels, with merged images shown in the right-hand panels. Quantification (changes in Pearson's correlation) are shown in Fig. S6. The small yellow rectangles show the areas that are enlarged in the inset (large yellow rectangles). Scale bars: 10 µm (main images); 5 µm (insets).
Fig. 6.
Fig. 6.
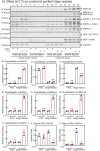
Purification of Golgi vesicles from lysates of WT U2OS cells expressing a triple HA-tagged version of the Golgi membrane protein Tmem115 and treated with or without C13. (A) Western blots, (B) quantification of western blots. (A) Lanes 1–4 and 5–8 are from cells that had been mock-transfected with empty vector and lanes 9–12 and 13–16 are from cells expressing triple HA-tagged Tmem115. Cells were treated with 0.1% DMSO (control) or 300 µM C13 for 1 h. Samples loaded were either whole-cell lysates (1–4, 9–12) or fractions binding to anti-HA antibodies coupled to magnetic beads (5–8, 13–16). Sample equivalent to 40 µg of whole-cell lysate protein was loaded in each lane. (B) Quantification by densitometry of the western blots in A; results are mean and actual data points (n=2), and only results for the cells expressing triple HA-tagged Tmem115 are shown. Asterisks show mean values significantly different from controls without C13: *P<0.05, **P<0.01, ***P<0.001, ****P<0.0001; ns, not significant (one-way ANOVA with Holm–Sidak post test).
Fig. 7.
Fig. 7.
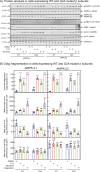
Fragmentation of the Golgi induced by AMPK activation is not dependent on the myristoylation status of AMPK-β1 or -β2. (A) Cells stably expressing WT or non-myristoylatable (G2A) mutants of AMPK-β1 or -β2 were treated for 1 h with 0.1% DMSO (control), 300 µM C13 or 200 nM MK-8722, lysates prepared and analysed by western blotting with the antibodies shown. The anti-AMPK-β antibody used recognizes both β1 and β2, but they can be distinguished by differing mobilities on SDS-PAGE. (B) Cells expressing WT or G2A mutants were treated for 1 h with 0.1% DMSO, 300 µM C13, 200 nM MK-8722 or 1 µM Golgicide A, IFM images prepared using anti-GM130 antibodies and quantified as in Fig. S5. Results are mean±s.d. for six biological replicates in each case. Mean values significantly different from DMSO controls are indicated: *P<0.05, **P<0.01, ***P<0.001, ****P<0.0001; ns, not significant (one-way ANOVA with Holm–Sidak post test).
Fig. 8.
Fig. 8.
Transit of temperature-sensitive VSVG3–GFP from the ER to the plasma membrane via the Golgi is inhibited by AMPK activation or GBF1 inhibition. U2OS cells were transfected with DNA encoding VSVG–GFP for 6 h at the restrictive temperature (40°C), which causes the protein to misfold and accumulate in the ER. Cells were then treated with 0.1% DMSO (control), 300 µM C13, 200 nM MK-8722 or 1 µM Golgicide A. After 1 h (defined as time zero) cells were transferred to the permissive temperature (32°C). At the indicated times cells were fixed and stained with antibodies against markers for the ER (calnexin) or Golgi (GM130) and Z sections (1 µM) were visualized in the confocal microscope. Results for six biological replicates are quantified in Fig. S8. Scale bars: 10 µm.

References

    1. Abu-Remaileh, M., Wyant, G. A., Kim, C., Laqtom, N. N., Abbasi, M., Chan, S. H., Freinkman, E. and Sabatini, D. M. (2017). Lysosomal metabolomics reveals V-ATPase- and mTOR-dependent regulation of amino acid efflux from lysosomes. Science 358, 807-813. 10.1126/science.aan6298 - DOI - PMC - PubMed
    1. Baillie, G. S., Huston, E., Scotland, G., Hodgkin, M., Gall, I., Peden, A. H., Mackenzie, C., Houslay, E. S., Currie, R., Pettitt, T. R.et al. (2002). TAPAS-1, a novel microdomain within the unique N-terminal region of the PDE4A1 cAMP-specific phosphodiesterase that allows rapid, Ca2+-triggered membrane association with selectivity for interaction with phosphatidic acid. J. Biol. Chem. 277, 28298-28309. 10.1074/jbc.M108353200 - DOI - PubMed
    1. Bain, J., Plater, L., Elliott, M., Shpiro, N., Hastie, C. J., Mclauchlan, H., Klevernic, I., Arthur, J. S., Alessi, D. R. and Cohen, P. (2007). The selectivity of protein kinase inhibitors: a further update. Biochem. J. 408, 297-315. 10.1042/BJ20070797 - DOI - PMC - PubMed
    1. Benziane, B., Bjornholm, M., Lantier, L., Viollet, B., Zierath, J. R. and Chibalin, A. V. (2009). AMP-activated protein kinase activator A-769662 is an inhibitor of the Na(+)-K(+)-ATPase. Am. J. Physiol. Cell Physiol. 297, C1554-C1566. 10.1152/ajpcell.00010.2009 - DOI - PubMed
    1. Cheung, P. C. F., Salt, I. P., Davies, S. P., Hardie, D. G. and Carling, D. (2000). Characterization of AMP-activated protein kinase g subunit isoforms and their role in AMP binding. Biochem. J. 346, 659-669. 10.1042/bj3460659 - DOI - PMC - PubMed

MeSH terms