

Pharmacokinetic Modeling and Model-Based Hypothesis Generation for Dose Optimization of Clonidine in Neonates With Neonatal Opioid Withdrawal Syndrome
- PMID: 39575611
- PMCID: PMC11993295
- DOI: 10.1002/cpt.3507
Pharmacokinetic Modeling and Model-Based Hypothesis Generation for Dose Optimization of Clonidine in Neonates With Neonatal Opioid Withdrawal Syndrome
Abstract
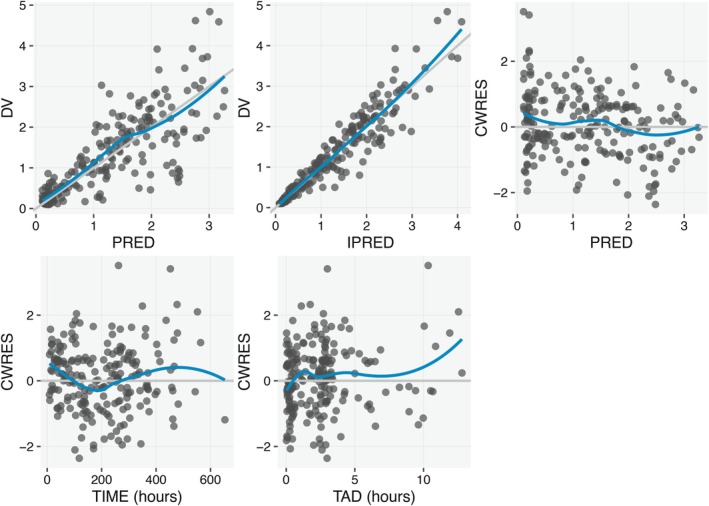
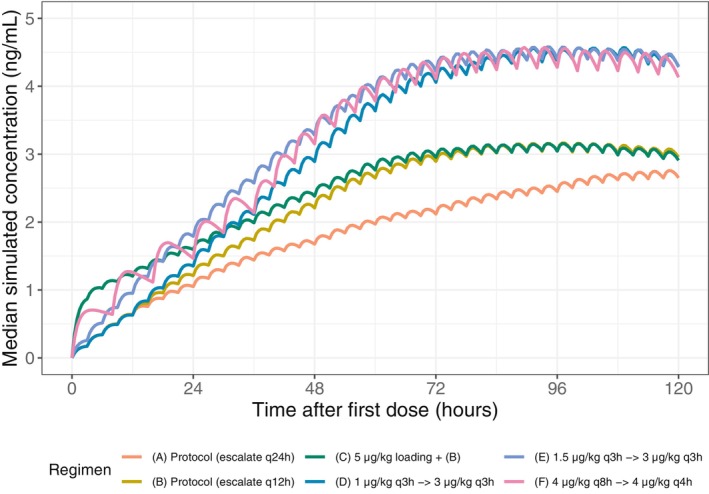
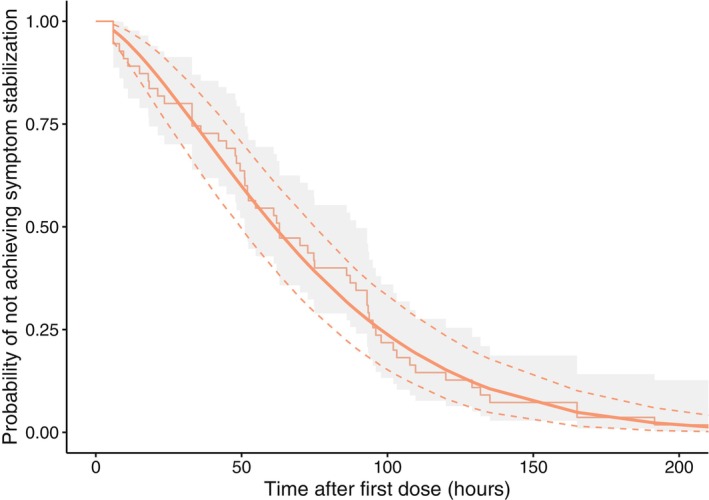
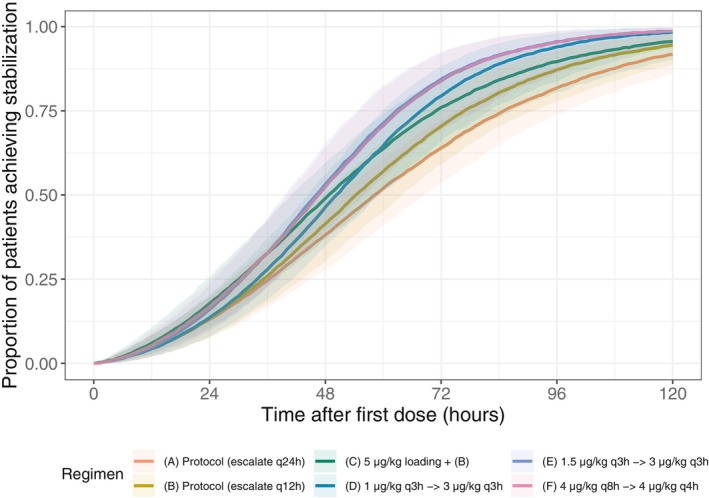
The No-POPPY study (NCT03396588), a double-blind, randomized trial compared morphine with clonidine therapy for neonatal opioid withdrawal syndrome (NOWS) and found that the duration of treatment was similar across groups. This is significant because perinatal use of morphine has the potential for neurodevelopmental consequences. Still, the clonidine group reached symptom stabilization (Finnegan score (FS) < 8) later than the morphine group and had a more significant number of patients who required adjunct therapy. However, the mean FS was consistently lower in the clonidine group after day 6. This prompted us to use pharmacokinetic (PK) and parametric time-to-event (TTE) modeling to simulate dosage schedules that may decrease the time to stabilization and reduce the need for adjunct therapy. Population PK (popPK) analysis was conducted, and the final model was a one-compartment model with first-order absorption and elimination, incorporating allometric scaling and age effect on apparent clearance (CL/F) and apparent volume (V/F). The population estimates for CL/F and V/F were 13.6 L/h/70 kg and 416 L/70 kg, respectively, similar to the reported values. A Weibull model described the TTE data best, followed by incorporating predicted average concentrations to yield the final Weibull accelerated failure time model. Simulations of dosing strategies showed that increasing both the starting and maximum doses could potentially shorten the time to stabilization, and thus, length of treatment and hospital stay. Given the hypothesis-generating nature of this analysis, the recommended dosing regimens should be tested prospectively to evaluate their benefits.
© 2024 The Author(s). Clinical Pharmacology & Therapeutics published by Wiley Periodicals LLC on behalf of American Society for Clinical Pharmacology and Therapeutics.
Conflict of interest statement
FT was an employee of the University of Kentucky when the work was initially conducted and is now an employee of Genentech, Inc. CMN was an employee of the University of Kentucky when the work was initially conducted and is now an employee of NewGround Pharmaceutical Consulting LLC. All other authors declared no competing interests in this work. Genentech, Inc. and NewGround Pharmaceutical Consulting LLC do not fund this study and have no roles in its design or conduct.
Figures
Similar articles
-
Clonidine clearance matures rapidly during the early postnatal period: a population pharmacokinetic analysis in newborns with neonatal abstinence syndrome.J Clin Pharmacol. 2011 Apr;51(4):502-11. doi: 10.1177/0091270010370587. Epub 2010 May 19. J Clin Pharmacol. 2011. PMID: 20484620 Clinical Trial.
-
Clonidine as Monotherapy for Neonatal Opioid Withdrawal Syndrome: A Randomized Trial.Pediatrics. 2024 Nov 1;154(5):e2023065610. doi: 10.1542/peds.2023-065610. Pediatrics. 2024. PMID: 39403061 Clinical Trial.
-
Phenobarbital and Clonidine as Secondary Medications for Neonatal Opioid Withdrawal Syndrome.Pediatrics. 2021 Mar;147(3):e2020017830. doi: 10.1542/peds.2020-017830. Pediatrics. 2021. PMID: 33632932 Free PMC article.
-
Pharmacotherapy of neonatal opioid withdrawal syndrome: a review of pharmacokinetics and pharmacodynamics.Expert Opin Drug Metab Toxicol. 2021 Jan;17(1):87-103. doi: 10.1080/17425255.2021.1837112. Epub 2020 Oct 29. Expert Opin Drug Metab Toxicol. 2021. PMID: 33049155 Review.
-
Opioid treatment for opioid withdrawal in newborn infants.Cochrane Database Syst Rev. 2021 Jul 7;7(7):CD002059. doi: 10.1002/14651858.CD002059.pub4. Cochrane Database Syst Rev. 2021. PMID: 34231914 Free PMC article.
Cited by
-
The role of 5-HT modulation in opioid withdrawal and neonatal opioid withdrawal syndrome: mechanisms and potential serotonergic targets.Expert Opin Investig Drugs. 2025 Jan-Feb;34(1-2):49-59. doi: 10.1080/13543784.2025.2462615. Epub 2025 Feb 8. Expert Opin Investig Drugs. 2025. PMID: 39900407 Review.
-
Optimal Drug, Optimal Dose, or Both in the Pharmacological Treatment of Neonatal Opioid Withdrawal Syndrome?Clin Pharmacol Ther. 2025 May;117(5):1182-1184. doi: 10.1002/cpt.3600. Epub 2025 Feb 11. Clin Pharmacol Ther. 2025. PMID: 39935314 Free PMC article. No abstract available.
References
-
- Hudak, M.L. & Tan, R.C. Neonatal drug withdrawal. Pediatrics 129, e540–e560 (2012). - PubMed
-
- Patrick, S.W. , Schumacher, R.E. , Benneyworth, B.D. , Krans, E.E. , McAllister, J.M. & Davis, M.M. Neonatal abstinence syndrome and associated health care expenditures: United States, 2000‐2009. JAMA 307, 1934–1940 (2012). - PubMed
-
- Davidson, A. & Flick, R.P. Neurodevelopmental implications of the use of sedation and analgesia in neonates. Clin. Perinatol. 40, 559–573 (2013). - PubMed
Publication types
MeSH terms
Substances
Grants and funding
LinkOut - more resources
Full Text Sources
