. 2025 Jan;21(1):e14392.
doi: 10.1002/alz.14392. Epub 2024 Nov 22.

APOE ε4-associated heterogeneity of neuroimaging biomarkers across the Alzheimer's disease continuum

Affiliations

APOE ε4-associated heterogeneity of neuroimaging biomarkers across the Alzheimer's disease continuum

Jason Mares et al. Alzheimers Dement. 2025 Jan.

Abstract

Introduction: While the role of apolipoprotein E (APOE) ε4 in Alzheimer's disease (AD) susceptibility has been studied extensively, much less is known about the differences in disease presentation in APOE ε4 carriers versus non-carriers.

Methods: To help elucidate these differences, we performed a broad analysis comparing the regional levels of six different neuroimaging biomarkers in the brains of APOE ε4 carriers versus non-carriers who participated in the Alzheimer's Disease Neuroimaging Initiative (ADNI).

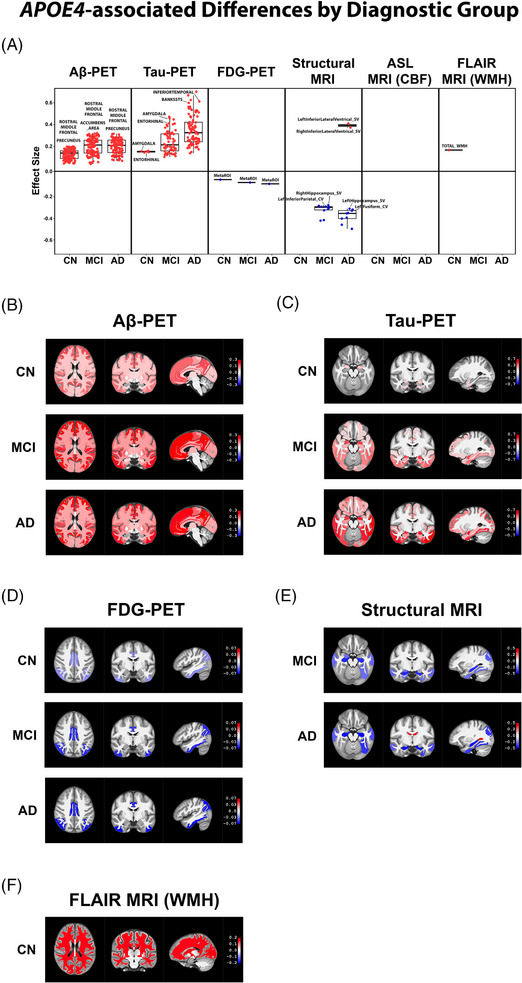
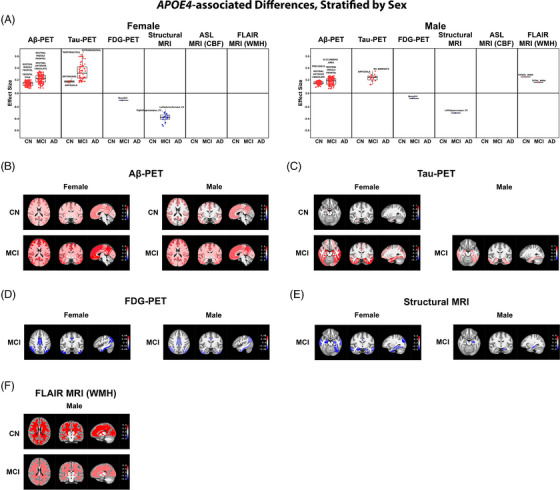
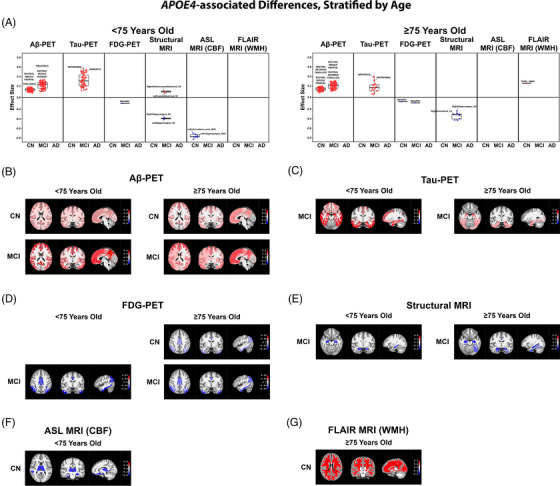
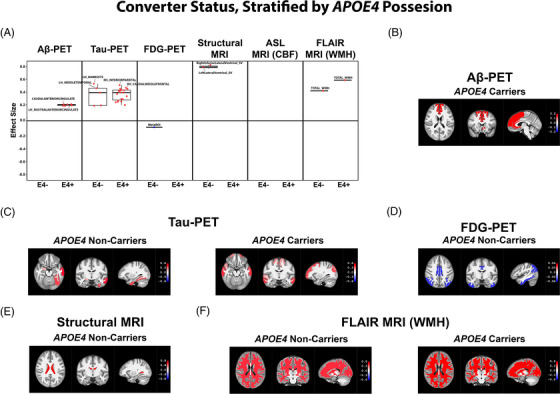
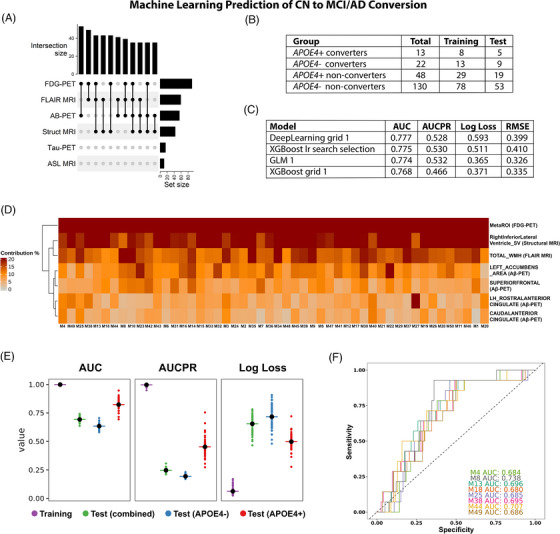
Results: We observed significant APOE ε4-associated heterogeneity in regional amyloid beta deposition, tau accumulation, glucose uptake, brain volume, cerebral blood flow, and white matter hyperintensities within each AD diagnostic group. We also observed important APOE ε4-associated differences in cognitively unimpaired individuals who converted to mild cognitive impairment/AD versus those who did not convert.

Discussion: This observed heterogeneity in neuroimaging biomarkers between APOE ε4 carriers versus non-carriers may have important implications regarding the prevention, diagnosis, and treatment of AD in different subpopulations.

Highlights: An extensive study was performed on the apolipoprotein E (APOE) ε4-associated heterogeneity in neuroimaging biomarkers from the Alzheimer's Disease Neuroimaging Initiative. Robust APOE ε4-associated increases in amyloid beta (Aβ) deposition throughout the brain, in every diagnostic group, were observed. APOE ε4-associated increases in tau pathology, decreases in glucose uptake, and increases in brain atrophy, which expand in regional scope and magnitude with disease progression, were observed. Significant sex- and age-related differences in APOE ε4-associated neuroimaging biomarker heterogeneity, with overall increases in pathological presentation in female APOE ε4 carriers, were observed. Regional differences in Aβ deposition, tau accumulation, glucose uptake, ventricle size, and white matter hyperintensities were observed in cognitively normal participants who converted to mild cognitive impairment/Alzheimer's disease, which may hold potential predictive value.

Keywords: Alzheimer's Disease Neuroimaging Initiative; Alzheimer's disease; apolipoprotein E; biomarkers; heterogeneity; neuroimaging.


Conflict of interest statement

Tal Nuriel is a consultant for Mubadala Capital. The other authors declare no conflicts of interest. Author disclosures are available in the supporting information.

Figures

FIGURE 1
FIGURE 1
APOE ε4–associated differences by diagnostic group. We performed linear mixed‐effects analyses comparing regional neuroimaging biomarker levels between APOE ε4 carriers versus non‐carriers, classified into one of three diagnostic groups: CN, MCI, or AD participants. Regions with significantly different biomarker levels (p < 0.05) between the APOE ε4 carriers and non‐carriers in each diagnostic group were graphed onto box plots with two of the top regions labeled (A). We also rendered the regions onto a human brain template (displayed axially, coronally, and sagittally) using different shades of red (upregulated in APOE ε4 carriers) or blue (downregulated in APOE ε4 carriers) that corresponds to the magnitude of their statistical difference (beta) between APOE ε4 carrier groups (B)–(F). We show the rendered biomarker differences from each analysis that resulted in at least one statistically different region, which in this diagnostic group–level comparison included Aβ PET results (B), tau PET results (C), FDG PET results (D), structural MRI results (E), and FLAIR MRI WMH results (F). Aβ, amyloid beta; AD, Alzheimer's disease; APOE, apolipoprotein E; ASL, arterial spin labeling; CBF, cerebral blood flow; CN, cognitively normal; FDG, fluorodeoxyglucose; FLAIR, fluid‐attenuated inversion recovery; MCI, mild cognitive impairment; MRI, magnetic resonance imaging; PET, positron emission tomography; WMH, white matter hyperintensity
FIGURE 2
FIGURE 2
APOE ε4–associated differences, stratified by sex. We performed linear mixed‐effects analyses comparing regional neuroimaging biomarker levels between either female APOE ε4 carriers versus female APOE ε4 non‐carriers or male APOE ε4 carriers versus male APOE ε4 non‐carriers, again within each diagnostic group: CN, MCI, or AD participants. Regions with significantly different biomarker levels (p < 0.05) between the APOE ε4 carriers and non‐carriers of each sex and within each diagnostic group were graphed onto box plots with two of the top regions labeled (A). We also rendered the regions onto a human brain template (displayed axially, coronally, and sagittally) using different shades of red (upregulated in APOE ε4 carriers) or blue (downregulated in APOE ε4 carriers) that corresponds to the magnitude of their statistical difference (beta) between APOE ε4 carrier groups (B)–(F). Here we show the rendered biomarker differences from each analysis that resulted in at least one statistically different region, which in this sex stratification included Aβ PET results (B), tau PET results (C), FDG PET results (D), structural MRI results (E), and FLAIR MRI WMH results (F). Aβ, amyloid beta; AD, Alzheimer's disease; APOE, apolipoprotein E; ASL, arterial spin labeling; CBF, cerebral blood flow; CN, cognitively normal; FDG, fluorodeoxyglucose; FLAIR, fluid attenuated inversion recovery; MCI, mild cognitive impairment; MRI, magnetic resonance imaging; PET, positron emission tomography; WMH, white matter hyperintensity
FIGURE 3
FIGURE 3
APOE ε4–associated differences, stratified by age. We performed linear mixed‐effects analyses comparing regional neuroimaging biomarker levels between either under‐75 APOE ε4 carriers versus under‐75 APOE ε4 non‐carriers or 75‐and‐over APOE ε4 carriers versus 75‐and‐over APOE ε4 non‐carriers, again within each diagnostic group: CN, MCI, or AD participants. Regions with significantly different biomarker levels (p < 0.05) between the APOE ε4 carriers and non‐carriers from each age group and within each diagnostic group were graphed onto box plots with two of the top regions labeled (A). We also rendered the regions onto a human brain template (displayed axially, coronally, and sagittally) using different shades of red (upregulated in APOE ε4 carriers) or blue (downregulated in APOE ε4 carriers) that corresponds to the magnitude of their statistical difference (beta) between APOE ε4 carrier groups (B)–(G). Here we show the rendered biomarker differences from each analysis that resulted in at least one statistically different region, which in this age stratification included Aβ PET results (B), tau PET results (C), FDG PET results (D), structural MRI results (E), ASL MRI CBF results (F), and FLAIR MRI WMH results (G). Aβ, amyloid beta; AD, Alzheimer's disease; APOE, apolipoprotein E; ASL, arterial spin labeling; CBF, cerebral blood flow; CN, cognitively normal; FDG, fluorodeoxyglucose; FLAIR, fluid attenuated inversion recovery; MCI, mild cognitive impairment; MRI, magnetic resonance imaging; PET, positron emission tomography; WMH, white matter hyperintensity
FIGURE 4
FIGURE 4
Converter status, stratified by APOE ε4 possession. We performed linear mixed‐effects analyses comparing regional neuroimaging biomarker levels between APOE ε4 non‐carrier or APOE ε4 carrier CN participants who converted to MCI or AD over the course of their ADNI participation versus APOE ε4 non‐carrier or APOE ε4 carrier CN participants who did not convert to MCI or AD during their ADNI participation, again within each diagnostic group: CN, MCI, or AD participants. Regions with significantly different biomarker levels (p < 0.05) between the converters and non‐converters from each APOE ε4 carrier group and within each diagnostic group were graphed onto box plots with two of the top regions labeled (A). We also rendered the regions onto a human brain template (displayed axially, coronally, and sagittally) using different shades of red (upregulated in APOE ε4 carriers) or blue (downregulated in APOE ε4 carriers) that corresponds to the magnitude of their statistical difference (beta) between converter status groups (B)–(F). Here we show the rendered biomarker differences from each analysis that resulted in at least one statistically different region, which in this converter status comparison included Aβ PET results (B), tau PET results (C), FDG PET results (D), structural MRI results (E), and FLAIR MRI WMH results (F). Aβ, amyloid beta; AD, Alzheimer's disease; APOE, apolipoprotein E; ASL, arterial spin labeling; CBF, cerebral blood flow; CN, cognitively normal; FDG, fluorodeoxyglucose; FLAIR, fluid attenuated inversion recovery; MCI, mild cognitive impairment; MRI, magnetic resonance imaging; PET, positron emission tomography; WMH, white matter hyperintensity.
FIGURE 5
FIGURE 5
Machine learning prediction of CN to MCI/AD conversion. We performed a machine learning experiment to investigate whether the biomarker regions identified in our conversion analysis could be used to predict future MCI/AD conversion in cognitively unimpaired individuals. A, An upset plot used to determine the amount of participant data overlap for each neuroimaging modality. B, The participant numbers, characteristics, and training versus test set assignments for all participants with overlapping data from the Aβ PET, FDG PET, structural MRI, and FLAIR MRI analyses. C, Performance metrics, including AUC, AUCPR, log‐loss, and RMSE, of the top 4 (out of 40) machine learning models tested from the h2o package. D, The contribution matrix of all 50 models generated by the trained XGBoosted algorithm. E, Performance metrics for all 50 models across the training set and each of the test sets (combined, APOE ε4–, and APOE ε4+). F, AUC ROC curves from the combined test set using the eight models with the lowest log‐loss scores from the training set. Aβ, amyloid beta; AD, Alzheimer's disease; ASL, arterial spin labeling; AUC, area under the curve; AUCPR, area under the precision‐recall curve; CBF, cerebral blood flow; CN, cognitively normal; FDG, fluorodeoxyglucose; FLAIR, fluid attenuated inversion recovery; MCI, mild cognitive impairment; MRI, magnetic resonance imaging; PET, positron emission tomography; RMSE, root mean squared error; ROC, receiver operator characteristic; WMH, white matter hyperintensity

Similar articles

References

    1. Alzheimer A, Stelzmann RA, Schnitzlein HN, Murtagh FR. An English translation of Alzheimer's 1907 paper, “Uber eine eigenartige Erkankung der Hirnrinde”. Clin Anat. 1995;8:429‐431. - PubMed
    1. Jack CR Jr, Bennett DA, Blennow K, et al. A/T/N: an unbiased descriptive classification scheme for Alzheimer disease biomarkers. Neurology. 2016;87:539‐547. - PMC - PubMed
    1. Reiman EM, Chen K, Alexander GE, et al. Functional brain abnormalities in young adults at genetic risk for late‐onset Alzheimer's dementia. Proc Nat Acad Sci USA. 2004;101:284‐289. - PMC - PubMed
    1. Reiman EM, Caselli RJ, Yun LS, et al. Preclinical evidence of Alzheimer's disease in persons homozygous for the epsilon 4 allele for apolipoprotein E. N Engl J Med. 1996;334:752‐758. - PubMed
    1. Reiman EM, Caselli RJ, Chen K, Alexander GE, Bandy D, Frost J. Declining brain activity in cognitively normal apolipoprotein E epsilon 4 heterozygotes: a foundation for using positron emission tomography to efficiently test treatments to prevent Alzheimer's disease. Proc Nat Acad Sci USA. 2001;98:3334‐3339. - PMC - PubMed

MeSH terms