. 2025 Jan;121(1):e17156.
doi: 10.1111/tpj.17156. Epub 2024 Nov 22.

Laser dissection-assisted phloem transcriptomics highlights the metabolic and physiological changes accompanying clubroot disease progression in oilseed rape

Affiliations

Laser dissection-assisted phloem transcriptomics highlights the metabolic and physiological changes accompanying clubroot disease progression in oilseed rape

Sara Blicharz et al. Plant J. 2025 Jan.

Abstract

Plasmodiophora brassicae, a soil-borne biotroph, establishes galls as strong physiological sinks on Brassicaceae plants including Brassica napus and Arabidopsis thaliana. We compare transcriptional profiles of phloem dissected from leaf petioles and hypocotyls of healthy and infected B. napus plants. Our results highlight how pathogenesis accompanies phloem-mediated defence responses whilst exerting a strong influence on carbon-nitrogen (C-N) economy. We observe transcriptional changes indicating decreased aliphatic glucosinolate biosynthesis, fluctuating jasmonic acid responses, altered amino acid (AA) and nitrate transport, carbohydrate metabolism and modified cytokinin responses. Changes observed in phloem-dissected from upper versus lower plant organs point to phloem as a conduit in mediating C-N repartitioning, nutrition-related signalling and cytokinin dynamics over long distances during clubroot disease. To assess changes in physiology, we measured AAs, sugars and cytokinins, in phloem exudates from B. napus plants. Despite the decrease in most AA and sucrose levels, isopentyl-type cytokinins increased within infected plants. Furthermore, we employed Arabidopsis for visualising promoter activities of B. napus AA and N transporter orthologues and tested the impact of disrupted cytokinin transport during P. brassicae-induced gall formation using Atabcg14 mutants. Our physiological and microscopy studies show that the host developmental reaction to P. brassicae relies on cytokinin and is accompanied by intense nitrogen and carbon repartitioning. Overall, our work highlights the systemic aspects of host responses that should be taken into account when studying clubroot disease.

Keywords: Brassica napus; Plasmodiophora brassicae; clubroot; laser dissection transcriptomics; oilseed rape; phloem.


Conflict of interest statement

The authors declare that they have no known competing financial interests or personal relationships that could appear to influence the work reported in this paper.

Figures
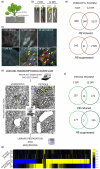
Figure 1
Figure 1
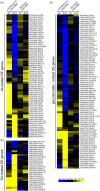
Phloem tissue transcriptional changes observed in Plasmodiophora brassicae‐inoculated Brassica napus reflect clubroot disease progression and diverse roles of the aboveground and belowground parts of the host plant in response to infection. (a) Scheme presenting the aboveground (petiole) and belowground (hypocotyl) material collected for phloem tissue isolation from P. brassicae‐infected plants. (b) B. napus mock‐treated (MOCK) and P. brassicae‐infected (INF) plants 7 and 12 DPI. (c) Hypocotyl cross sections of B. napus plants infected with P. brassicae 7 and 12 DPI stained with Nile Red. Scale bar represents 100 μm. Yellow arrowheads indicate cells colonised by the pathogen (red staining). (d) Workflow for laser‐capture microdissection (LDM) and transcriptomic analysis of phloem tissue. (e, f) Venn diagrams presenting the number of differentially expressed genes (DEGs) in the P. brassicae‐infected (e) hypocotyls and (f) petioles compared to the mock‐treated tissue 7 and 12 DPI. DEGs were split into PB‐induced and PB‐supressed genes. DEGs fold change ≥2, FDR ≤0.05. (g) Heatmap of log2 fold change values of the identified DEGs in the hypocotyl and petiole phloem samples from the P. brassicae‐infected B. napus plants compared to the mock‐treated plants 7 and 12 DPI. Upregulated genes are shaded in yellow and downregulated genes in blue. Significant DEGs were identified based on the thresholds of log2 ratio ≤−1 or ≥1 and a false discovery rate ≤0.05.
Figure 2
Figure 2
Transcriptional profiling of Brassica napus phloem tissue shows local and long‐distance modulation of plant defence response to Plasmodiophora brassicae colonisation. (a–c) Heatmaps of log2 fold change values of the identified DEGs in the hypocotyl and petiole phloem samples from the P. brassicae‐infected plants 7 and 12 DPI involved in plant defence responses, including (a) JA‐related DEGs, (b) SA‐related DEGs and (c) glucosinolate‐related DEGs. Upregulated genes are shaded in yellow and downregulated genes in blue. Significant DEGs were identified based on a log2 ratio ≥1 and a false discovery rate ≤0.05.
Figure 3
Figure 3
Pathogen hijacks the internal host mechanisms for nitrogen‐rich components repartitioning. (a) Heatmaps of log2 fold change values of the identified DEGs in the hypocotyl and petiole phloem samples from the Plasmodiophora brassicae‐infected Brassica napus plants 7 and 12 DPI involved in nitrogen‐related responses, including nitrate transporters (NRT/NPF), glutamine synthetase encoding genes (GLN), Usually Multiple Acids Move In and out Transporters (UMAMIT), amino acid permeases (AAP) and amino acid transporters Lysine/Histidine‐like Transporter (LHT). Upregulated genes are shaded in yellow and downregulated genes in blue. Significant DEGs were identified based on a log2 ratio ≥1 and a false discovery rate ≤0.05. (b) Promoter activities of nitrate transporter NRT1.8/NPF7.2 and AA transporter AAP1 orthologues visualised at 7 and 12 DPI in transverse sections of petioles from mock‐treated and P. brassicae‐infected Arabidopsis plants, using promoter::GFP reporter system and Calcofluor white as a counterstain. Scale bars represent 50 μm. (c) Heatmap of log2 fold change values of the detected AAs in the phloem exudates from the leaves of P. brassicae‐infected B. napus plants at 7, 12, 16, 26 and 32 DPI relative to the content in mock‐treated plants, with five independent biological replicates, each containing 60 leaves (3 leaves from 20 plants). Upregulated genes are shaded in yellow and downregulated genes in blue. The fold change values are shown in parenthesis, and asterisks indicating statistically significant differences where *P ≤ 0.05, **P ≤ 0.01 and ***P ≤ 0.001 are provided as superscript. For data that shows a normal distribution an unpaired t‐test was performed whereas for non‐normal distribution a Wilcoxon signed‐rank test was used.
Figure 4
Figure 4
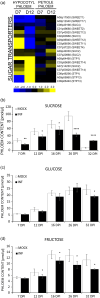
Clubroot disease progression is accompanied by differential expression of sugar transporters, however, the concentration of sucrose in the phloem sap of Plasmodiophora brassicae‐infected Brassica napus plant decreases. (a) Heatmap of log2 fold change values of the identified differentially expressed sugar transporter genes in the hypocotyl and petiole phloem samples from the P. brassicae‐infected plants at 7 and 12 DPI. Upregulated genes are shaded in yellow and downregulated genes in blue. Significantly differentially expressed genes were identified based on a log2 ratio ≥1 and a false discovery rate ≤0.05. (b–d) Content of (b) sucrose, (c) glucose and (d) fructose in the phloem exudates from the leaves of mock‐treated and P. brassicae‐infected B. napus plants measured at 7, 12, 16, 26 and 32 DPI with five independent biological replicates, each containing exudates collected from 60 leaves (3 leaves from 20 plants). Asterisks indicate statistically significant differences at *P ≤ 0.05, **P ≤ 0.01, ***P ≤ 0.001, ****P ≤ 0.0001, according to unpaired t‐test for data showing normal distribution or by Wilcoxon signed‐rank test for data with non‐normal distribution.
Figure 5
Figure 5
Transcriptional changes in cytokinin‐related factors as well as elevated levels of the iP type cytokinins in phloem sap suggest the role of these hormones in long‐distance coordination of host responses to clubroot disease. (a) Heatmaps of log2 fold change values of the identified DEGs in the hypocotyl and petiole phloem samples from the Plasmodiophora brassicae‐infected plants 7 and 12 DPI related to cytokinin (CK) signalling. Upregulated genes are shaded in yellow and downregulated genes in blue. Significantly differentially expressed genes were identified based on a log2 ratio ≥1 and a false discovery rate ≤0.05. (b) Content of different cytokinin forms, including cis‐Zeatin (cZ), trans‐Zeatin (tZ), trans‐Zeatin Riboside (tZR), isoPentenyladenine (iP), isoPentenyladenine Riboside (iPR) and isoPentenyladenosine‐5′‐MonoPhosphate (iPMP) in the phloem exudates from the leaves of mock‐treated and P. brassicae‐infected Brassica napus plants measured at 7, 10, 14 and 26 DPI, with five independent biological replicates, each containing exudates collected from 60 leaves. Asterisks indicate statistically significant differences at P ≤ 0.05 that were calculated using unpaired t‐test for results that showed normal distribution, or by Wilcoxon signed‐rank test for data that did not follow a normal distribution.
Figure 6
Figure 6
Disruption of cytokinin transport affects growth responses without impacting Plasmodiophora brassicae lifecycle progression in the infected host. (a) Clubroot disease symptoms in the rosettes and hypocotyls of Arabidopsis Col‐4 and mutant abcg14 plants 26 DPI. Scale bars represent 5 cm and 5 mm for rosettes and hypocotyls, respectively. (b) Changes in hypocotyl area and diameter were observed between Atabcg14 mutant and Col‐4 mock‐inoculated and P. brassicae‐infected plants. Calculated means and SEs are presented. Asterisks indicate statistically significant differences between means at *P ≤ 0.05, **P ≤ 0.01, ***P ≤ 0.001, according to the unpaired t‐test. (c) Hypocotyl cross sections of mock‐treated and P. brassicae‐infected wild‐type Col‐4 and Atabcg14 plants 26 DPI stained with toluidine blue. Scale bars represent 20 μm for mock‐inoculated and 50 μm for P. brassicae‐infected radial hypocotyl sections. The xylem area is outlined in red, the phloem area in green, whilst examples of enlarged cells filled with P. brassicae resting spores are indicated with yellow asterisks. Panel (d) illustrates cytokinin content in rosettes and root systems of Col‐4 and Atabcg14 plants.
Figure 7
Figure 7
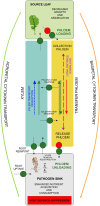
Overview on the possible routes of long‐distance coordination and repartitioning that occurs in Plasmodiophora brassicae infected OSR plants. Infected hosts decrease its photosynthetic activity and aboveground organ growth. This results in a lower supply of carbon‐ and nitrogen‐rich components. Despite the overall deficits of nutrients and stunted growth the host transport machinery is dominated by the strong pathogen sink in developing galls. This can be manifested as differential expression of amino‐acid and nitrate transporters as well as carbohydrate transporters having possible roles in loading at the source and unloading at the sink. Transcriptomic changes observed in dissected phloem cells also show that observed host adaptive growth and defence responses are accompanied by long‐distance signalling (purple arrow) and cytokinins may play an important role in this process. It is known that CRFs may be involved in both nitrogen status and defence response mediation. This signalling, and precise regulation of the circular long‐distance distribution of the iPR/iP type cytokinins, as well as their loading and unloading, shapes plant growth responses and source/sink relations like photoassimilate accumulation at the pathogen site, or host defence reactions like the movement of nutrients away from the pathogen site, as suggested by McIntyre et al. (2021). Possible routes of carbohydrate transport are labelled in red whereas nitrogen is marked in green. Dark blue arrow indicates disrupted water transport in impacted xylem tissue of the clubroot‐infected host. The AtABCG14‐mediated circular long‐distance transport of iP‐type CKs is pictured by the orange (basipetal) and bright green (acropetal) arrows. This aspect were reviewed in Zhao et al. (2023). Colonising pathogen gradually suppresses defence in the underground part of the host, whilst in aboveground numerous defence responses, possibly decreasing host assimilation and modulating organ growth, are observed.

Similar articles

References

    1. Abualia, R. , Ötvös, K. , Novák, O. , Bouguyon, E. , Domanegg, K. , Krapp, A. et al. (2022) Molecular framework integrating nitrate sensing in root and auxin‐guided shoot adaptive responses. Proceedings of the National Academy of Sciences, 119, e2122460119. - PMC - PubMed
    1. Aigu, Y. , Daval, S. , Gazengel, K. , Marnet, N. , Lariagon, C. , Laperche, A. et al. (2022) Multi‐omic investigation of low‐nitrogen conditional resistance to clubroot reveals Brassica napus genes involved in nitrate assimilation. Frontiers in Plant Science, 13, 790563. - PMC - PubMed
    1. Bi, K. , He, Z. , Gao, Z. , Zhao, Y. , Fu, Y. , Cheng, J. et al. (2016) Integrated omics study of lipid droplets from Plasmodiophora brassicae . Scientific Reports, 6, 36965. - PMC - PubMed
    1. Bíbová, J. , Kábrtová, V. , Večeřová, V. , Kučerová, Z. , Hudeček, M. , Plačková, L. et al. (2023) The role of a cytokinin antagonist in the progression of clubroot disease. Biomolecules, 13, 299. - PMC - PubMed
    1. Bieleski, R.L. (1964) The problem of halting enzyme action when extracting plant tissues. Analytical Biochemistry, 9, 431–442. - PubMed

MeSH terms

LinkOut - more resources