

Impact of Deprivation and Preferential Usage on Functional Connectivity Between Early Visual Cortex and Category-Selective Visual Regions
- PMID: 39575904
- PMCID: PMC11583081
- DOI: 10.1002/hbm.70064
Impact of Deprivation and Preferential Usage on Functional Connectivity Between Early Visual Cortex and Category-Selective Visual Regions
Abstract
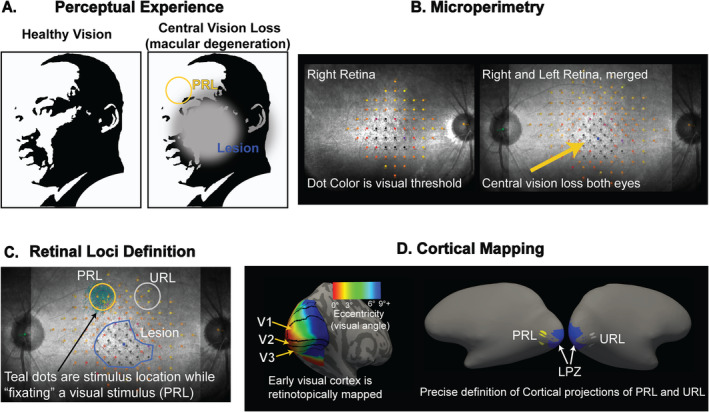
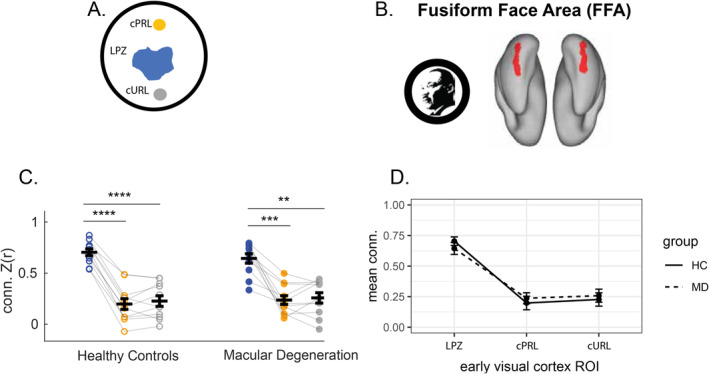
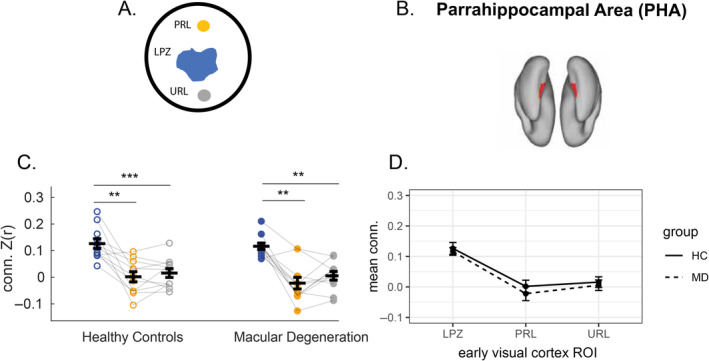
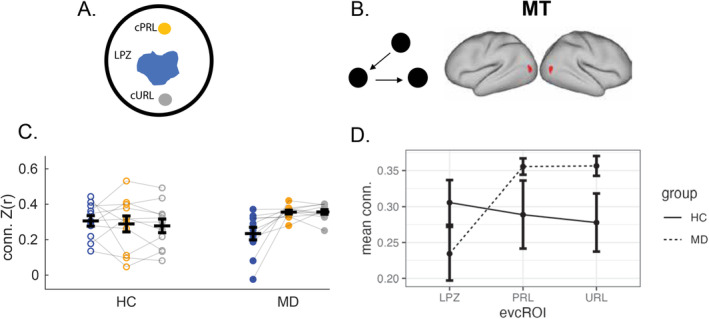
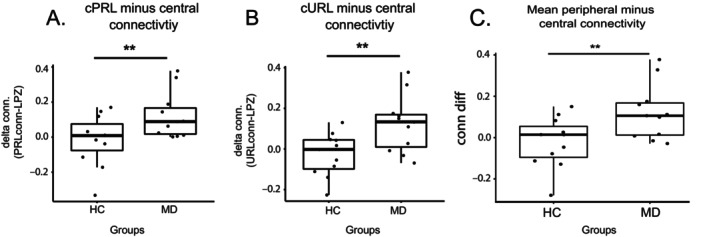
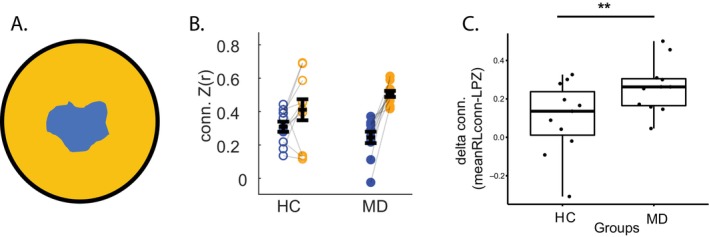
Human behavior can be remarkably shaped by experience, such as the removal of sensory input. Many studies of conditions such as stroke, limb amputation, and vision loss have examined how removal of input changes brain function. However, an important question yet to be answered is: when input is lost, does the brain change its connectivity to preferentially use some remaining inputs over others? In individuals with healthy vision, the central portion of the retina is preferentially used for everyday visual tasks, due to its ability to discriminate fine details. When central vision is lost in conditions like macular degeneration, peripheral vision must be relied upon for those everyday tasks, with some portions receiving "preferential" usage over others. Using resting-state fMRI collected during total darkness, we examined how deprivation and preferential usage influence the intrinsic functional connectivity of sensory cortex by studying individuals with selective vision loss due to late stages of macular degeneration. Specifically, we examined functional connectivity between category-selective visual areas and the cortical representation of three areas of the retina: the lesioned area, a preferentially used region of the intact retina, and a non-preferentially used region. We found that cortical regions representing spared portions of the peripheral retina, regardless of whether they are preferentially used, exhibit plasticity of intrinsic functional connectivity in macular degeneration. Cortical representations of spared peripheral retinal locations showed stronger connectivity to MT, a region involved in processing motion. These results suggest that the long-term loss of central vision can produce widespread effects throughout spared representations in early visual cortex, regardless of whether those representations are preferentially used. These findings support the idea that connections to visual cortex maintain the capacity for change well after critical periods of visual development.
Keywords: FFA; MT; V1; fMRI; functional connectivity; lesion projection zone; macular degeneration; plasticity; sensory deprivation; visual cortex.
© 2024 The Author(s). Human Brain Mapping published by Wiley Periodicals LLC.
Conflict of interest statement
The authors declare no conflicts of interest.
Figures
Update of
-
Impact of deprivation and preferential usage on functional connectivity between early visual cortex and category selective visual regions.bioRxiv [Preprint]. 2024 May 17:2024.05.17.593020. doi: 10.1101/2024.05.17.593020. bioRxiv. 2024. Update in: Hum Brain Mapp. 2024 Dec 1;45(17):e70064. doi: 10.1002/hbm.70064. PMID: 38798355 Free PMC article. Updated. Preprint.
Similar articles
-
Impact of deprivation and preferential usage on functional connectivity between early visual cortex and category selective visual regions.bioRxiv [Preprint]. 2024 May 17:2024.05.17.593020. doi: 10.1101/2024.05.17.593020. bioRxiv. 2024. Update in: Hum Brain Mapp. 2024 Dec 1;45(17):e70064. doi: 10.1002/hbm.70064. PMID: 38798355 Free PMC article. Updated. Preprint.
-
Frontal cortical regions associated with attention connect more strongly to central than peripheral V1.Neuroimage. 2021 Sep;238:118246. doi: 10.1016/j.neuroimage.2021.118246. Epub 2021 Jun 7. Neuroimage. 2021. PMID: 34111516 Free PMC article.
-
Preserved retinotopic brain connectivity in macular degeneration.Ophthalmic Physiol Opt. 2016 May;36(3):335-43. doi: 10.1111/opo.12279. Epub 2016 Feb 29. Ophthalmic Physiol Opt. 2016. PMID: 26923706
-
Human brain plasticity: evidence from sensory deprivation and altered language experience.Prog Brain Res. 2002;138:177-88. doi: 10.1016/S0079-6123(02)38078-6. Prog Brain Res. 2002. PMID: 12432770 Review.
-
Visual Cortex Plasticity Following Peripheral Damage To The Visual System: fMRI Evidence.Curr Neurol Neurosci Rep. 2016 Oct;16(10):89. doi: 10.1007/s11910-016-0691-0. Curr Neurol Neurosci Rep. 2016. PMID: 27542799 Review.
Cited by
-
Motion Processing in Visual Cortex of Maculopathy Patients.J Neurosci. 2025 Jul 23;45(30):e0283252025. doi: 10.1523/JNEUROSCI.0283-25.2025. J Neurosci. 2025. PMID: 40467303
-
Reduced functional connectivity between central representations of V1 and foveal-biased face-selective region in central vision loss.Brain Struct Funct. 2025 Jul 3;230(6):111. doi: 10.1007/s00429-025-02973-x. Brain Struct Funct. 2025. PMID: 40608114 Free PMC article.
References
-
- Baldassano, C. , Fei‐Fei L., and Beck D. M.. 2016. “Pinpointing the Peripheral Bias in Neural Scene‐Processing Networks During Natural Viewing.” Journal of Vision 16: 9. - PubMed
MeSH terms
Grants and funding
LinkOut - more resources
Full Text Sources
Medical
