Comparative Study
. 2024 Nov;532(11):e70001.
doi: 10.1002/cne.70001.

Comparative Physiology and Morphology of BLA-Projecting NBM/SI Cholinergic Neurons in Mouse and Macaque

Affiliations
Comparative Study

Comparative Physiology and Morphology of BLA-Projecting NBM/SI Cholinergic Neurons in Mouse and Macaque

Feng Luo et al. J Comp Neurol. 2024 Nov.

Abstract

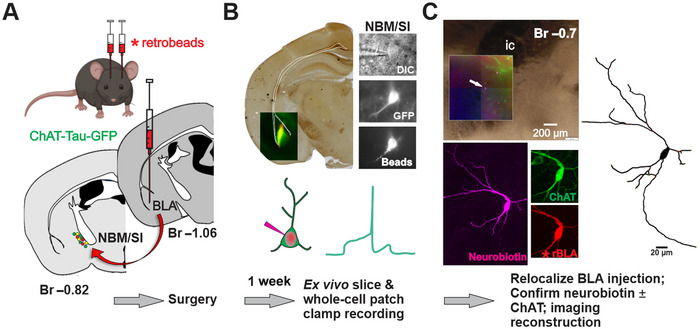
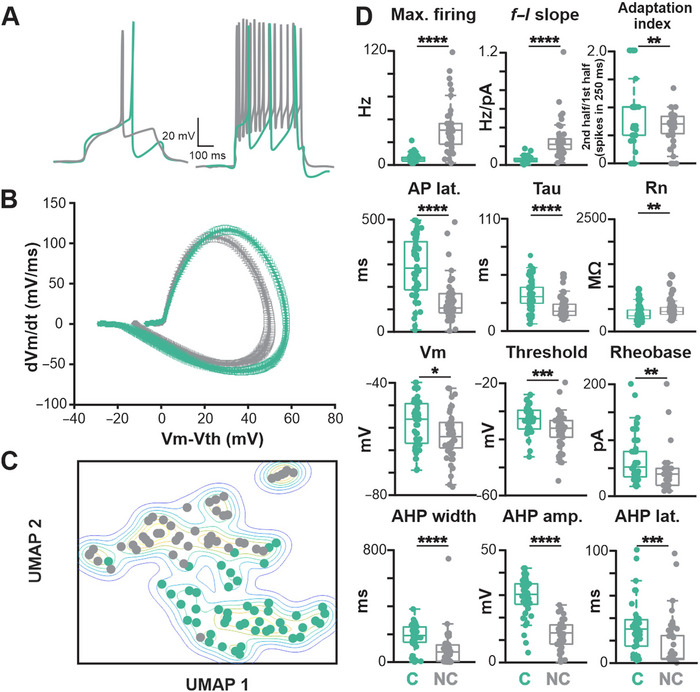
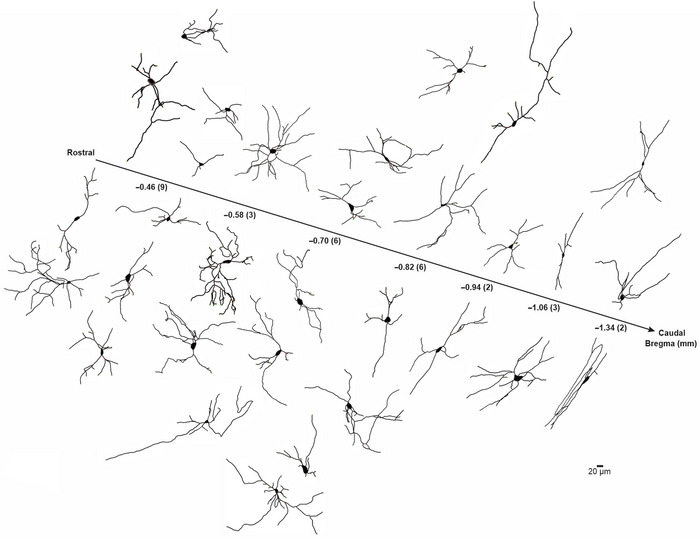
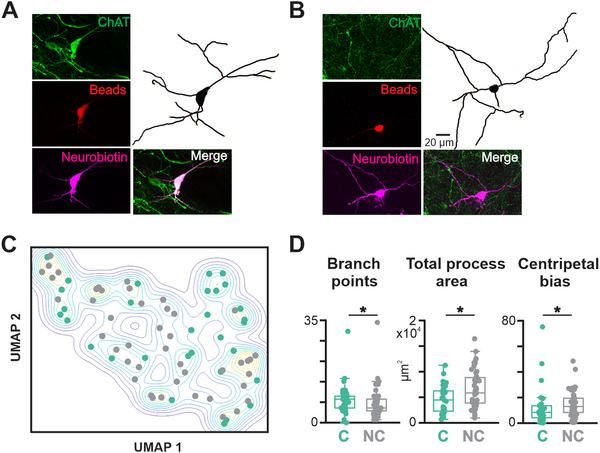
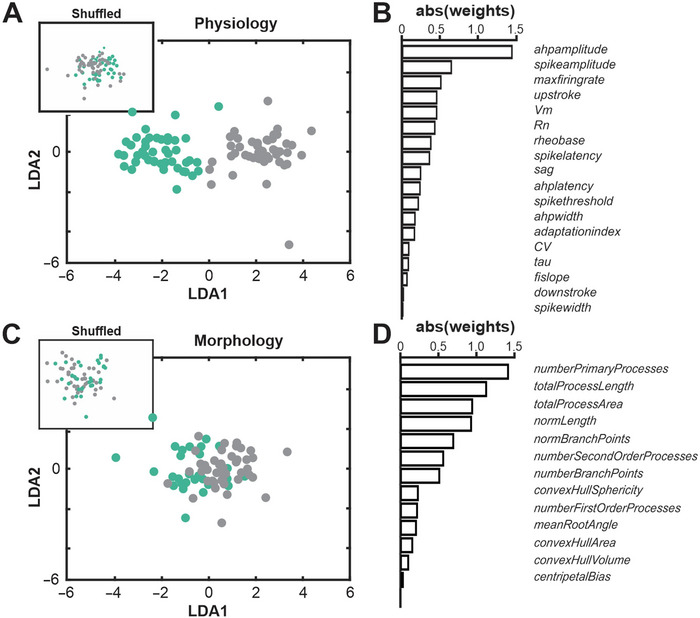
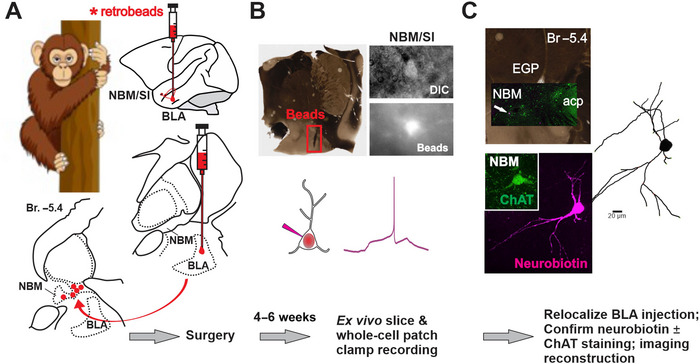
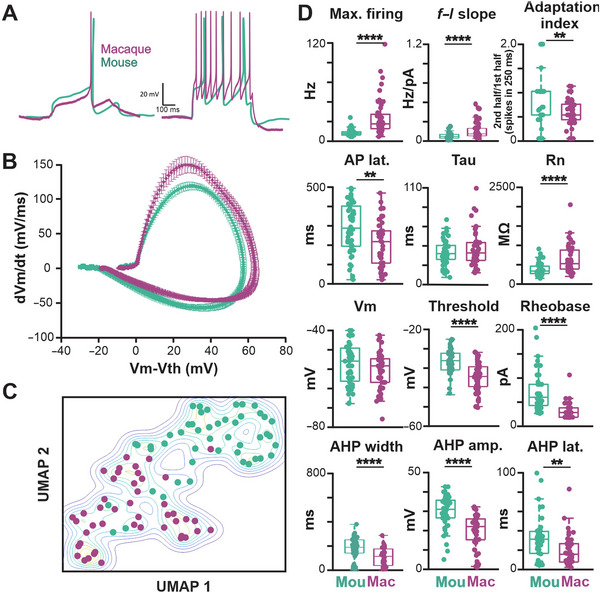
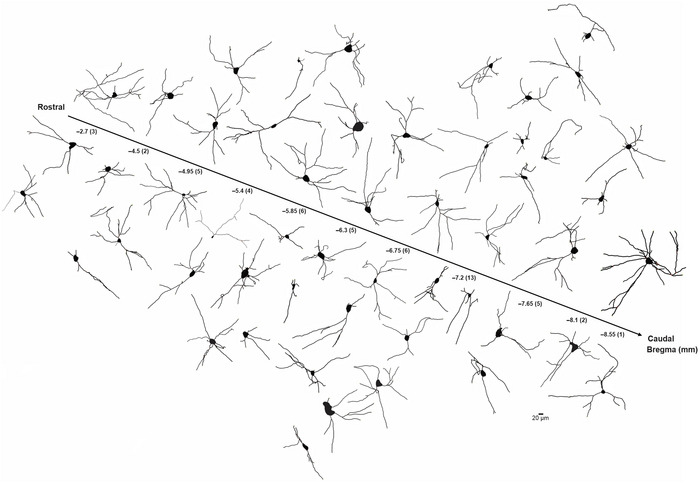
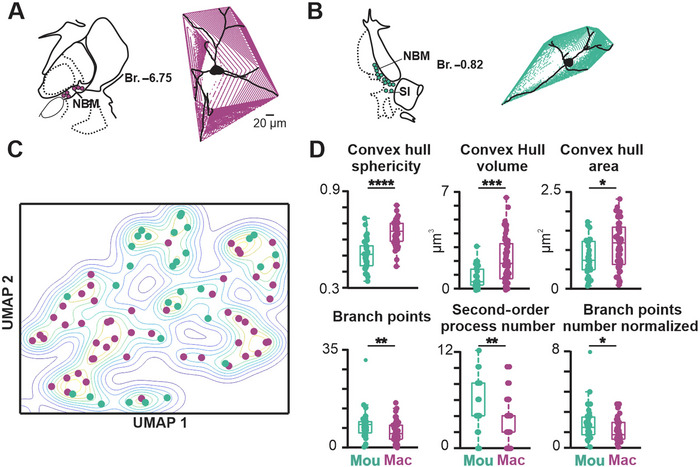
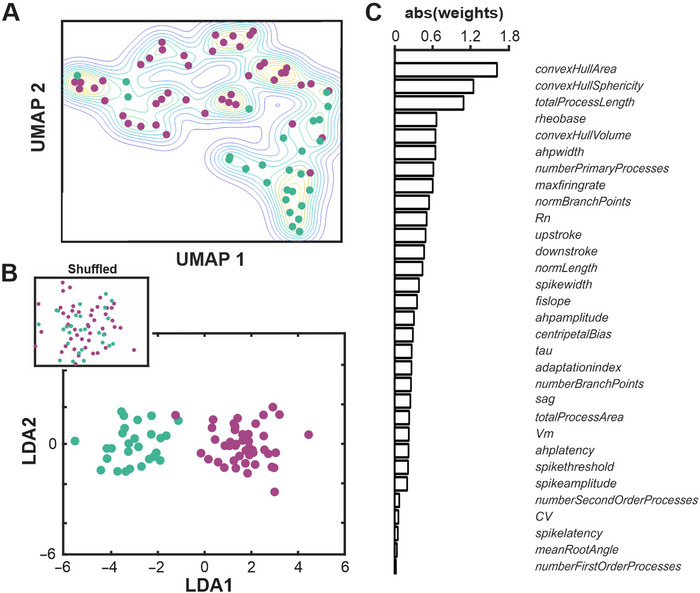
Cholinergic projection neurons of the nucleus basalis and substantia innominata (NBM/SI) densely innervate the basolateral amygdala (BLA) and have been shown to contribute to the encoding of fundamental and life-threatening experiences. Given the vital importance of these circuits in the acquisition and retention of memories that are essential for survival in a changing environment, it is not surprising that the basic anatomical organization of the NBM/SI is well conserved across animal classes as diverse as teleost and mammal. What is not known is the extent to which the physiology and morphology of NBM/SI neurons have also been conserved. To address this issue, we made patch-clamp recordings from NBM/SI neurons in ex vivo slices of two widely divergent mammalian species, mouse and rhesus macaque, focusing our efforts on cholinergic neurons that project to the BLA. We then reconstructed most of these recorded neurons post hoc to characterize neuronal morphology. We found that rhesus macaque BLA-projecting cholinergic neurons were both more intrinsically excitable and less morphologically compact than their mouse homologs. Combining measurements of 18 physiological features and 13 morphological features, we illustrate the extent of the separation. Although macaque and mouse neurons both exhibited considerable within-group diversity and overlapped with each other on multiple individual metrics, a combined morphoelectric analysis demonstrates that they form two distinct neuronal classes. Given the shared purpose of the circuits in which these neurons participate, this finding raises questions about (and offers constraints on) how these distinct classes result in similar behavior.

Keywords: basal forebrain; cholinergic; donkey anti‐goat Alexa‐Fluor 488; morphoelectric physiology; mouse; nonhuman primate.


Conflict of interest statement

The authors declare no conflicts of interest.

Figures

FIGURE 1
FIGURE 1
Workflow for morphoelectric profiling of NBM/SI BLA‐projecting cholinergic and noncholinergic neurons in mouse. See Figures S1‐1 and S1‐2. A. Surgical back labeling: Schematic for stereotactic injection of fluorescently tagged microbeads (“retrobeads”) bilaterally into BLA of ChAT‐tau‐GFP mice. The red‐labeled beads were taken up by axonal terminals and transported retrogradely to cell bodies in the NBM/SI. This resulted in yellow neurons (both cholinergic and BLA‐projecting), red neurons (BLA‐projecting but noncholinergic), and green neurons (cholinergic but non‐BLA‐projecting). B. Live imaging and recording: Roughly 1 week after the bead injection, mice were prepared for ex vivo slice recording. (Top left) Photomicrograph of sample injection site of red beads into the BLA of a ChAT‐tau‐GFP mouse. Yellow and green signals in BLA derive from the extensive (green fluorescent) cholinergic terminal fields within this area. (Top right) Photomicrographs taken during the recording session in the region of the NBM/SI. Cells were first identified in DIC (top). ChAT‐tau‐GFP labeling was readily detected in live imaging of NBM/SI cholinergic neurons. BLA‐projecting neurons were also easily detectable in live imaging due to red beads from the BLA injection. Neurons labeled with both GFP (ChAT) and red beads were classified as both BLA‐projecting and cholinergic. Red beads without an overlapping green label were identified as BLA‐projecting but noncholinergic. All neurons were filled with neurobiotin during electrophysiological recording. C. Relocalization: Neurons were relocalized based on coordinates and neurobiotin processing with streptavidin. Relocalized neurons were further processed for ChAT staining and microbeads labeling to confirm prior identification.
FIGURE 2
FIGURE 2
Electrophysiological features consistent with the lower excitability of mouse cholinergic BLA‐projecting NBM/SI neurons compared with neighboring noncholinergic BLA‐projecting NBM/SI neurons. See Figures S2‐1 and S2‐2. A. Sample traces at rheobase (left) and at maximum current injection (right; 200 pA) are shown for typical BLA‐projecting NBM/SI neurons (cholinergic: teal; noncholinergic: gray). B. Average phase plots illustrate differences in action potential kinetics comparing BLA‐projecting NBM/SI neurons (cholinergic: teal; noncholinergic: gray). C. Nondimensional (UMAP) plot of all 18 electrophysiological features comparing BLA‐projecting NBM/SI neurons (cholinergic: teal; noncholinergic: gray). D. Population scatter plus box plots of all data for the 12 features that most strongly distinguish BLA‐projecting NBM/SI cholinergic neurons (n = 48) from their neighboring BLA‐projecting, noncholinergic neurons (n = 46; cholinergic: teal; noncholinergic: gray). The p‐value symbols used in this and all subsequent figures are as follows: *p ≤ 0.05; **p ≤ 0.01; ***p ≤ 0.001; ****p ≤ 0.0001. C, cholinergic (n = 48); NC, noncholinergic (n = 46).
FIGURE 3
FIGURE 3
Skeletonized renditions of relocalized BLA‐projecting cholinergic neurons within NBM/SI along all bregma in mouse. See Figure S3‐1. The proximal 100+ µm of the processes emanating from cholinergic somata were morphologically diverse and independent of location along bregma. Most neurons were multipolar, although fairly simple in morphology (n = 31).
FIGURE 4
FIGURE 4
BLA‐projecting NBM/SI neurons in mouse, whether cholinergic or noncholinergic, differ in three of the 13 morphological parameters assessed. See Figure S4‐1. A. Confocal images of a representative BLA‐projecting cholinergic neuron in mouse. B. Confocal images of a representative BLA‐projecting noncholinergic neuron in mouse. C. Nondimensional (UMAP) plot of the morphological features of BLA‐projecting NBM/SI neurons (cholinergic: teal; noncholinergic: gray). D. Population scatter plus box plots of data for the three morphological features differed significantly between BLA‐projecting NBM/SI cholinergic neurons (n = 31) and their neighboring BLA‐projecting, noncholinergic neurons (n = 44; cholinergic: teal; noncholinergic: gray). “C” stands for cholinergic, and “NC” stands for noncholinergic.
FIGURE 5
FIGURE 5
Linear discriminant analysis (LDA) strongly distinguishes cholinergic from noncholinergic BLA‐projecting NBM/SI mouse neurons based on electrophysiological, but not on morphological, features. A. LDA was applied to all electrophysiological features for BLA‐projecting NBM/SI neurons (cholinergic: teal, n = 48; noncholinergic: gray, n = 46). There is clear separation in clustering of the two populations from one another but not from the distribution of shuffled data (shown in inset), consistent with the many electrophysiological features that distinguish between BLA‐projecting cholinergic versus noncholinergic neurons in mouse. B. Plot of the absolute values of the weighted differences in electrophysiological features between BLA‐projecting NBM/SI neurons (cholinergic: teal; noncholinergic: gray). C. LDA was applied to all morphological features for BLA‐projecting NBM/SI neurons (cholinergic: teal, n = 31; noncholinergic: gray, n = 44). The two populations do not separate from one another nor is the distribution of morphological features very different from the shuffled data (shown in inset). D. Plot of the absolute values of the weighted differences in morphological features between BLA‐projecting NBM/SI neurons (cholinergic: teal; noncholinergic: gray) of mouse.
FIGURE 6
FIGURE 6
Workflow for morphoelectric profiling of BLA‐projecting NBM/SI cholinergic neurons in macaque. See Figures S6‐1, S6‐2, and S6‐3. A. Surgical retrograde labeling (top): Schematic for injection of fluorescently tagged microbeads (“retrobeads”) into the BLA of rhesus macaque. Guided by MRI images and stereotaxic coordinates, red microbeads were injected into BLA of rhesus macaque monkeys. These were taken up by axonal terminals and transported retrogradely to the cell bodies of projection neurons in the NBM/SI. B. Live imaging and recording: Four to six weeks after microbead injection, sections were prepared for ex vivo slice recording. (Top right) Photomicrographs taken during the recording session in the region of the NBM/SI. Cells were identified in DIC (top) and BLA‐projecting neurons detected in live imaging by microbeads from the BLA injection. Bead‐positive neurons were filled with neurobiotin during electrophysiological recording. C. Relocalization: Neurons were relocalized based on coordinates and neurobiotin staining. ChAT labeling was confirmed by immunostaining and high‐power images of the cell body, and proximal dendrites were taken for subsequent import into Imaris for morphological parameter assessment.
FIGURE 7
FIGURE 7
Both passive and active membrane properties of macaque BLA‐projecting NBM/SI cholinergic neurons are consistent with higher excitability than those of mouse. See Figure S7‐1. A. Sample traces from BLA‐projecting cholinergic NBM/SI macaque neurons at rheobase (left) and at maximum current injection (right; 200 pA) are shown (macaque: purple; mouse: teal). Mouse data (from same database of BLA‐projecting cholinergic neurons as in Figure 2A) are shown here again for comparison purposes. B. Average phase plots illustrate differences in action potential kinetics between macaque, BLA‐projecting NBM/SI cholinergic neurons (purple) and mouse (teal); mouse data are the same as those in Figure 2B, presented here for comparison purpose. C. Nondimensional (UMAP) plot of all 18 electrophysiological features comparing BLA‐projecting NBM/SI cholinergic neurons from macaque (purple) with comparable samples from mouse (teal). Mouse data are the same as those in Figure 2C, presented here for ease of comparison. D. Population scatter plus box plots of data for 12 features that distinguish BLA‐projecting NBM/SI cholinergic neurons of the rhesus macaque (n = 46; purple) from BLA‐projecting NBM/SI cholinergic neurons from mouse (n = 48; teal). Mouse data are the same as those in Figure 2D presented here for ease of comparison.
FIGURE 8
FIGURE 8
Skeletonized renditions of relocalized BLA‐projecting cholinergic neurons within NBM/SI along bregma in macaque. The proximal 100+ µm of the processes emanating from cholinergic somata of macaque were morphologically diverse regardless of location along bregma. Most neurons were multipolar, yet fairly simple (n = 52).
FIGURE 9
FIGURE 9
BLA‐projecting NBM/SI cholinergic neurons in macaque differ from those in mouse in six of the 13 morphological parameters assessed. See Figures S9‐1, S9‐2, and S9‐3. A. (LHS) Approximate location in hemicoronal diagram of macaque basal forebrain region at approximately −6.75 Brega. (RHS) A volume rendering of proximal neuritic domain of a representative NBM/SI, BLA‐projecting, cholinergic neuron from macaque. B. Approximate location in hemicoronal section of mouse basal forebrain and volume rendering of proximal neurite domain of a representative NBM/SI, BLA‐projecting, cholinergic neuron from mouse. C. Nondimensional (UMAP) plot of all 13 morphological features of BLA‐projecting NBM/SI cholinergic neurons from macaque (purple, n = 52) versus mouse (teal, n = 31). Mouse data are from the same set of morphological parameters as presented in Figures 4 and 4–1. D. Population scatter plus box plots of data for the six set of morphological properties that differ between BLA‐projecting NBM/SI cholinergic macaque (n = 52; purple) compared with mouse (n = 31; teal) neurons. Mouse data are from the same set of morphological parameters as presented in Figures 4 and 4‐1.
FIGURE 10
FIGURE 10
Examination of combined morphoelectric features distinguishes macaque versus mouse basal forebrain neurons despite common projection target, anatomical location, and cholinergic phenotype. A. Nondimensional (UMAP) plot of all 18 electrophysiological and 13 morphological features of BLA‐projecting NBM/SI cholinergic neurons from macaque (purple, n = 46) versus mouse (teal, n = 27). B. Linear discriminant analysis was applied to all 18 electrophysiological and 13 morphological features of BLA‐projecting NBM/SI cholinergic neurons from macaque (purple, n = 46) versus mouse (teal, n = 27). Note the clear separation in clustering of the two populations from one another and its distinct nature from the distribution of shuffled data (shown in inset). C. Plot of the absolute values of the weighted differences for LDA in all 18 electrophysiological and 13 morphological features of BLA‐projecting NBM/SI cholinergic neurons from macaque (purple, n = 46) versus mouse (teal, n = 27).

Update of

Similar articles

References

    1. Alonso, A. , Khateb A., Fort P., Jones B. E., and Mühlethaler M.. 1996. “Differential Oscillatory Properties of Cholinergic and Non‐Cholinergic Nucleus Basalis Neurons in Guinea Pig Brain Slice.” European Journal of Neuroscience 8: 169–182. - PubMed
    1. Ananth, M. R. , Rajebhosale P., Kim R., Talmage D. A., and Role L. W.. 2023. “Basal Forebrain Cholinergic Signalling: Development, Connectivity and Roles in Cognition.” Nature Reviews Neuroscience 24: 233–251. - PMC - PubMed
    1. Ballinger, E. C. , Ananth M., Talmage D. A., and Role L. W.. 2016. “Basal Forebrain Cholinergic Circuits and Signaling in Cognition and Cognitive Decline.” Neuron 91: 1199–1218. - PMC - PubMed
    1. Bañuelos, C. , Kittleson J. R., LaNasa K. H., et al. 2023. “Cognitive Aging and the Primate Basal Forebrain Revisited: Disproportionate GABAergic Vulnerability Revealed.” Journal of Neuroscience 43: 8425–8441. - PMC - PubMed
    1. Bengtson, C. P. , and Osborne P. B.. 2000. “Electrophysiological Properties of Cholinergic and Noncholinergic Neurons in the Ventral Pallidal Region of the Nucleus Basalis in Rat Brain Slices.” Journal of Neurophysiology 83: 2649–2660. - PubMed

Publication types

LinkOut - more resources