. 2024 Nov 22;9(22):e172978.
doi: 10.1172/jci.insight.172978.

STARD7 maintains intestinal epithelial mitochondria architecture, barrier integrity, and protection from colitis

Affiliations

STARD7 maintains intestinal epithelial mitochondria architecture, barrier integrity, and protection from colitis

Jazib Uddin et al. JCI Insight. .

Abstract

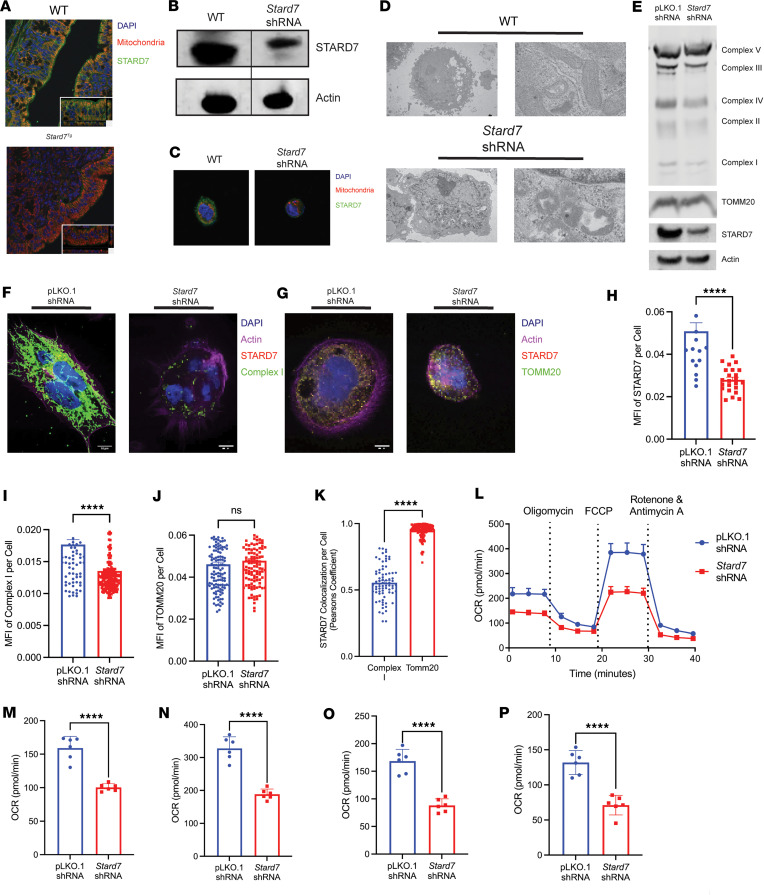
Susceptibility to inflammatory bowel diseases (IBDs), Crohn's disease (CD), and ulcerative colitis (UC) is linked with loss of intestinal epithelial barrier integrity and mitochondria dysfunction. Steroidogenic acute regulatory (StAR) protein-related lipid transfer (START) domain-containing protein 7 (STARD7) is a phosphatidylcholine-specific (PC-specific) lipid transfer protein that transports PC from the ER to the mitochondria, facilitating mitochondria membrane stabilization and respiration function. The aim of this study was to define the contribution of STARD7 in the regulation of the intestinal epithelial mitochondrial function and susceptibility to colitis. In silico analyses identified significantly reduced expression of STARD7 in patients with UC, which was associated with downregulation of metabolic function and a more severe disease phenotype. STARD7 was expressed in intestinal epithelial cells, and STARD7 knockdown resulted in deformed mitochondria and diminished aerobic respiration. Loss of mitochondria function was associated with reduced expression of tight junction proteins and loss of intestinal epithelial barrier integrity that could be recovered by AMPK activation. Stard7+/- mice were more susceptible to the development of DSS-induced and Il10-/- spontaneous models of colitis. STARD7 is critical for intestinal epithelial mitochondrial function and barrier integrity, and loss of STARD7 function increases susceptibility to IBD.

Keywords: Inflammation; Inflammatory bowel disease; Mitochondria.


Conflict of interest statement

Conflict of interest: The authors have declared that no conflict of interest exists.

Figures

Figure 1
Figure 1. STARD7 expression is downregulated in IBD.
(A) Venn diagram of DEGs between UC versus non-IBD and CD versus non-IBD. Select common DEGs are indicated (GSE57945). (B) Violin plot showing STARD7 expression (reads per kilobase per million mapped reads, RPKM) in ileal biopsies from patients with UC, patients with CD, or non-IBD patients (non-IBD n = 42; UC n = 206, CD n = 175). Lines are median and quartiles. (C) Violin plot showing STARD7 expression (RPKM) in rectal biopsies from patients with ileo-colonic CD (iCD), colon-only CD (cCD), or UC or non-IBD patients (non-IBD n = 55; UC n = 44; iCD n = 60; and cCD n = 32) (GSE117993). Lines are median and quartiles. (D) Stratification of non-IBD and UC cohort based upon STARD7 expression (quartiles, RPKM) (GSE109142). (E) Pie chart indicating the percentage of STARD7lo and STARD7hi UC patients with high levels of fecal calprotectin (≥250 μg/g) 4 weeks after their initial diagnosis. (F) Pearson’s coefficient correlation of STARD7 and (G) calprotectin (S100A8 and S100A9) mRNA expression in rectal biopsies from UC (GSE109142). (H) Heatmap of DEGs based on RNA-Seq data between non-IBD (n = 16) and quartile 1 Stard7 UC (n = 56) patients. (I) Bar graphs of pathway analysis of upregulated genes (bottom) and downregulated genes (top) in quartile 1 STARD7 UC patients relative to non-IBD patients, assessed via Gene Ontology (GO) Biological Process Pathways, ranked by P value. Data are presented as mean ± SEM. (B and C) Statistical analysis was performed using 1-way analysis of variance followed by Tukey’s multiple-comparison test or performed using an unpaired t test. (F and G) Correlation analyses were performed using Spearman’s rank correlation coefficient. *P < 0.05, **P < 0.01, ***P < 0.001, ****P < 0.0001.
Figure 2
Figure 2. Mitochondrial function is negatively altered in STARD7-deficient colonic epithelial cells.
(A) Immunofluorescence analysis of STARD7 localization in colonic tissue from WT and Stard7+/– mice. (B) Western blot analyses of STARD7 expression in WT and Stard7 shRNA–transduced CaCo-2BBe cells. (C) Immunofluorescence analysis of STARD7 expression in WT and Stard7 shRNA–transduced CaCo-2BBe cells. (D) Transmission electron microscopy analysis of mitochondrial structure in WT and Stard7 shRNA–transduced CaCo-2BBe cells. (E) Western blot analyses of oxidative phosphorylation proteins in pLKO.1 shRNA– and Stard7 shRNA–transduced CaCo-2BBe cells. Immunofluorescence analysis of STARD7 expression and either (F) complex I or (G) TOMM20 expression in pLKO.1 shRNA and Stard7 shRNA–transduced CaCo-2BBe cells. Quantification (mean fluorescence intensity) of (H) STARD7, (I) complex I, and (J) TOMM20 expression using CellProfiler image analysis software. (K) Colocalization analysis between STARD7 and complex I and TOMM20 in pLKO.1 shRNA–transduced CaCo-2BBe cells. (L) Seahorse Mito Stress Test was performed on pLKO.1 shRNA– and Stard7 shRNA–transduced CaCo-2BBe cells where oxygen consumption rate (OCR) was measured over time as cells were exposed at the indicated time points to oligomycin, carbonyl cyanide p-trifluoromethoxyphenylhydrazone (FCCP), and rotenone/antimycin A. Measurement of (M) basal respiration, (N) maximal respiration, (O) spare respiratory capacity, and (P) ATP production in pLKO.1 shRNA– and Stard7 shRNA–transduced CaCo-2BBe cells. Data are representative of at least 2 independent experiments with at least 5 replicates per group. Scale bars = 10 µm. Each symbol in IK represents an individual cell. Each symbol in MP represents an individual well containing 50,000 plated cells. Data are presented as mean ± SEM. Statistical analysis was performed using unpaired t test. ****P < 0.0001.
Figure 3
Figure 3. STARD7 deficiency alters homeostatic intestinal epithelial barrier function.
Western blot of (A) STARD7 and (B) tight junction proteins in WT and Stard7+/– epithelial cells. (C) Densitometry analyses of tight junction proteins in WT and Stard7+/– epithelial cells (WT n = 6; Stard7+/– n = 6). (D) In vivo ileal epithelial permeability to FITC-dextran in WT and Stard7+/– mice (n = 6 WT; n = 8 Stard7+/– mice). (E) Representative photomicrograph (left) and quantification (right) of wound repair in primary epithelial monolayers from WT and Stard7+/– mice. Scale bars = 100 μm. Dashed line, edges of wounds. (F) Transepithelial electric resistance in Shhcre Stard7fl/fl epithelial cells (Shhcre n = 3; Shhcre Stard7fl/fl n = 3). (G) Time course of FITC-dextran flux in Shhcre Stard7fl/fl epithelial cells (Shhcre n = 3; Shhcre Stard7fl/fl n = 3). (H) Western blot of tight junction proteins in WT and Shhcre Stard7fl/fl epithelial cells. (I) Transepithelial electric resistance in Villincre Stard7fl/fl epithelial cells (WT n = 3; Villincre Stard7fl/fl n = 8). (J) Time course of FITC-dextran flux in Villincre Stard7fl/fl epithelial cells (WT n = 3; Villincre Stard7fl/fl n = 3). (K) Transepithelial electric resistance in WT, pLKO.1 shRNA–transduced and Stard7 shRNA–transduced CaCo-2BBe cell monolayers (WT n = 4; pLKO.1 n = 8; Stard7 n = 8). (L) Time course of FITC-dextran flux in WT and Stard7 shRNA–transduced CaCo-2BBe cell monolayers (WT n = 4; pLKO.1 n = 4; Stard7 n = 4). (M) Western blot of tight junction proteins in WT and Stard7 shRNA–transduced CaCo-2BBe cells. Data are representative of at least 2 independent experiments with at least 3 replicates per group. Each symbol in F, G, I, and K represents an individual well containing 500,000 cells. Data are presented as mean ± SEM. Statistical analysis performed using 1-way analysis of variance followed by Tukey’s multiple-comparison test or performed using an unpaired t test. *P <0.05, **P <0.01, ***P <0.001, ****P <0.0001.
Figure 4
Figure 4. AMPK agonists reconstitute mitochondria ultrastructure, architecture, function, and barrier integrity in STARD7-transduced IECs.
(A) Electron microscopy of WT, Stard7 shRNA–transduced, and metformin-stimulated cells. (B) Transepithelial electric resistance in WT, Stard7 shRNA–transduced, and metformin-stimulated CaCo-2BBe cell monolayers (WT n = 4; Stard7 n = 4; metformin-stimulated Stard7 n = 4). (C) FITC-dextran flux analyses in WT, Stard7 shRNA–transduced and metformin-stimulated CaCo-2BBe cell monolayers (WT n = 4; Stard7 n = 4; metformin-stimulated Stard7 n = 4). (D) Western blot of tight junction proteins in WT, Stard7 shRNA–transduced, and metformin-stimulated Stard7 shRNA–transduced CaCo-2BBe cells. (E) Seahorse Mito Stress Test was performed on pLKO.1 shRNA–, Stard7 shRNA–, and metformin-pretreated Stard7 shRNA–transduced CaCo-2BBe cells where OCR was measured over time as cells were exposed at the indicated time points to oligomycin, FCCP, and rotenone/antimycin A. Measurement of (F) basal respiration, (G) maximal respiration, and (H) spare respiratory capacity in pLKO.1 shRNA–, Stard7 shRNA–, and metformin-pretreated Stard7 shRNA–transduced CaCo-2BBe cells. Representative Western blot (left panel) and quantification (right panel) of total AMPKα-1, phosphorylated AMPKα-1 (Thr172 and 183) and β-actin in (I) metformin-stimulated (100 μM) and (J) AICAR-stimulated (1 μM) WT CaCo-2BBe cells (48 hours). Lanes were run on the same gel but were noncontiguous. Transepithelial electric resistance (K) and time course of FITC-dextran flux (L) in WT and Stard7 shRNA–transduced CaCo-2BBe cell monolayers following vehicle or AICAR (1 μM) stimulation (n = 4 per group). Data are representative of at least 3 independent experiments with at least 3 replicates per group. Each symbol in B and K represent an individual well containing 500,000 plated cells. Each symbol in FH represent an individual well containing 50,000 plated cells. Data are presented as mean ± SEM. Statistical analysis was performed using 1-way analysis of variance followed by Tukey’s multiple-comparison test or performed using an unpaired t test. *P < 0.05, **P < 0.01, ***P < 0.001.
Figure 5
Figure 5. Loss of Stard7 exaggerates the development of colitis.
(A) Clinical score, (B) percentage weight change, and (C) representative image of colon histology from WT and Stard7+/– mice receiving 2.5% DSS (WT n = 17; Stard7+/– n = 15). (D) Histological scoring from WT and Stard7+/– mice at day 7 of DSS exposure (WT n = 10; Stard7+/– n = 9). (E) Colon lengths from WT and Stard7+/– mice (WT n = 10; Stard7+/– n = 10). (F) Clinical score, (G) percentage weight change, and (H) representative image of colon histology from Il10–/– and Stard7+/– Il10–/– mice (WT n = 4; Il10–/– n = 7; Stard7+/– Il10–/– n = 8). (I) Histological scoring from Il10–/– and Stard7+/– Il10–/– mice (Il10–/– n = 7; Stard7+/– Il10–/– n = 8). (J) Counts (#) of CD3+CD4+ T cells in the mLNs of mice (Il10–/– n = 7; Stard7+/– Il10–/– n = 8). (K) Counts (#) of CD11b+F4/80+ macrophages in the mLNs of mice (Il10–/– n = 7; Stard7+/– Il10–/– n = 8). Counts (#) of (L) CD4+IFN-γ+ and (M) CD4+IL-17a+ T cells in the mLNs of mice (Il10–/– n = 7; Stard7+/– Il10–/– n = 8). Systemic levels of (N) TNF-α, (O) IFN-γ, and (P) IL-17a in serum of colitis mice (Il10–/– n = 7; Stard7+/– Il10–/– n = 8). (Q) Clinical score (Stard7+/– n = 3, metformin-treated Stard7+/– n = 6) and (R) percentage weight change (Stard7+/– n = 3, metformin-treated Stard7+/– n = 6) of Stard7+/– mice receiving 2.5% DSS. Top row magnification = 4×, bottom row magnification 20×, 4× scale bar represents 200 μm, 20× scale bar represents 50 μm. Data encompass 3 independent experiments. Each symbol in D, E, and IP represent an individual mouse. Data are presented as mean ± SEM. Statistical analysis was performed using 1-way analysis of variance followed by Tukey’s multiple-comparison test or performed using an unpaired t test. *P < 0.05, **P < 0.01, ***P < 0.001, ****P < 0.0001.

References

    1. Roda G, et al. Crohn’s disease. Nat Rev Dis Primers. 2020;6(1):22. doi: 10.1038/s41572-020-0156-2. - DOI - PubMed
    1. Kobayashi T, et al. Ulcerative colitis. Nat Rev Dis Primers. 2020;6(1):74. doi: 10.1038/s41572-020-0205-x. - DOI - PubMed
    1. De Souza HSP, et al. The IBD interactome: an integrated view of aetiology, pathogenesis and therapy. Nat Rev Gastroenterol Hepatol. 2017;14(12):739–749. doi: 10.1038/nrgastro.2017.110. - DOI - PubMed
    1. Pavlidis P, et al. Cytokine responsive networks in human colonic epithelial organoids unveil a molecular classification of inflammatory bowel disease. Cell Rep. 2022;40(13):111439. doi: 10.1016/j.celrep.2022.111439. - DOI - PMC - PubMed
    1. Gerlach K, et al. TH9 cells that express the transcription factor PU.1 drive T cell-mediated colitis via IL-9 receptor signaling in intestinal epithelial cells. Nat Immunol. 2014;15(7):676–686. doi: 10.1038/ni.2920. - DOI - PubMed

MeSH terms

LinkOut - more resources