. 2024 Nov 22;9(22):e178977.
doi: 10.1172/jci.insight.178977.

Cellular signatures in human blood track bone mineral density in postmenopausal women

Affiliations

Cellular signatures in human blood track bone mineral density in postmenopausal women

Kaichi Kaneko et al. JCI Insight. .

Abstract

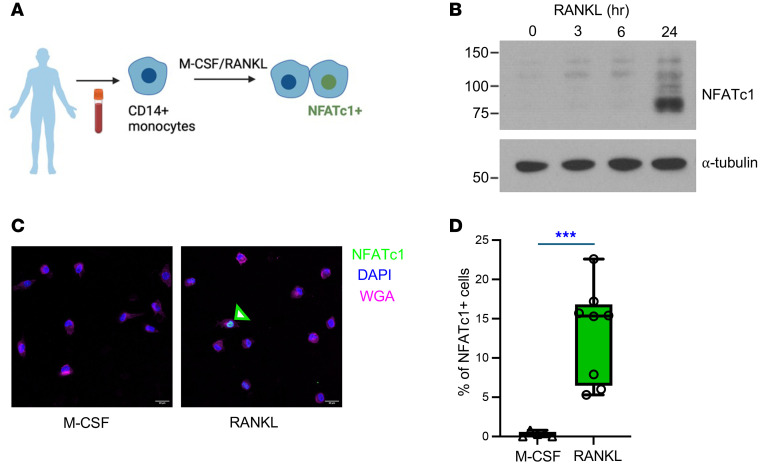
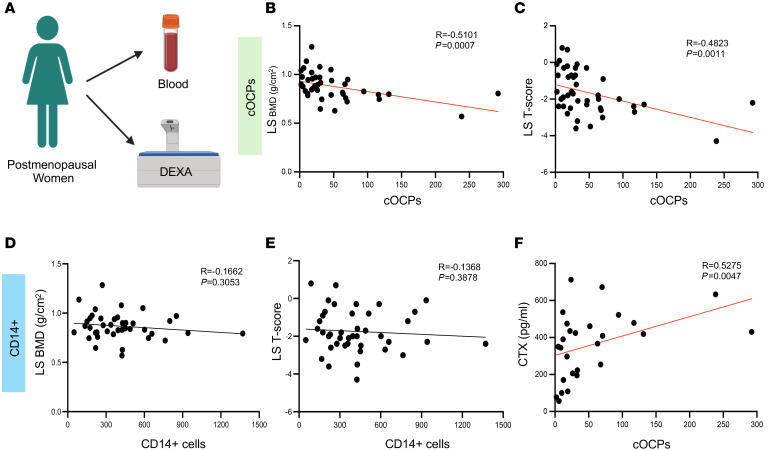
Osteoclasts are the sole bone-resorbing cells and are formed by the fusion of osteoclast precursor cells (OCPs) derived from myeloid lineage cells. Animal studies reveal that circulating OCPs (cOCPs) in blood travel to bone and fuse with bone-resident osteoclasts. However, the characteristics of human cOCPs and their association with bone diseases remain elusive. We have identified and characterized human cOCPs and found a positive association between cOCPs and osteoclast activity. Sorted cOCPs have a higher osteoclastogenic potential than other myeloid cells and effectively differentiate into osteoclasts. cOCPs exhibit distinct morphology and transcriptomic signatures. The frequency of cOCPs in the blood varies among treatment-naive postmenopausal women and has an inverse correlation with lumbar spine bone density and a positive correlation with serum CTX, a bone resorption marker. The increased cOCPs in treatment-naive patients with osteoporosis were significantly diminished by denosumab, a widely used antiresorptive therapy. Our study reveals the distinctive identity of human cOCPs and the potential link between the dynamic regulation of cOCPs and osteoporosis and its treatment. Taken together, our study enhances our understanding of human cOCPs and highlights a potential opportunity to measure cOCPs through a simple blood test, which could potentially identify high-risk individuals.

Keywords: Bone biology; Osteoclast/osteoblast biology; Osteoporosis.


Conflict of interest statement

Conflict of interest: The authors have declared that no conflict of interest exists.

Figures

Figure 1
Figure 1. A subset of CD14+ cells shows a distinct response to RANKL.
(A) Schematic for RANKL-induced NFATc1 activation. (BD) CD14+ cells were treated with M-CSF or M-CSF and RANKL for the indicated times. (B) Total lysates were analyzed by immunoblot using anti-NFATc1 antibodies and α-tubulin antibodies as a loading control (n = 3). Values are shown in kDa. (C and D) Cells were treated with RANKL for 24 hours and were stained with anti-NFATc1 antibodies, DAPI (blue) to visualize the nucleus, and wheat germ agglutinin (WGA, pink) to visualize intracellular vesicles and membranes. (C) Representative images of NFATc1-stained cells (n ≥ 5). Scale bar: 20 μm. (D) Quantification of NFATc1+ cells. All data are shown as median and interquartile range. ***P < 0.005 by 2-tailed Student’s t test.
Figure 2
Figure 2. Analysis of circulating osteoclast precursor cells.
(AD) UMAP analysis of human PBMCs. Human PBMCs from healthy donors were stained and analyzed with flow cytometry (n = 9). (A) UMAP plot showing the different cell populations of PBMCs. (B) UMAP plot, with color coding (red to blue) for the expression of CD14, a marker gene of human monocytes. (C and D) UMAP plot of CD14+ cells for the expression of RANK (C) and CD16 (D). (E) Osteoclastogenesis assay (n = 5). Osteoclast differentiation in CD14+ cells with or without OCPs. TRAP+ multinucleated cells (MNCs, ≥ 3 nuclei) were counted as osteoclasts in triplicate. The left panel shows representative images. The right panel shows the number of TRAP+ MNCs. All data are shown as median and interquartile range. **P < 0.01 by 2-tailed, unpaired t test. (F) Representative histograms of CCR2, C3AR1, CD51/CD61, and HLA-DR expression in cOCPs using cumulative data pooled from 3 independent donors.
Figure 3
Figure 3. Circulating osteoclast-precursor cells have distinct morphology and transcriptomic signatures.
(A) Representative images of Giemsa-stained monocytes (MOs) and osteoclast precursor cells (OCPs) that were sorted by FACS. Scale bar: 10 μm. (B) Volcano plot of RNA-Seq analysis of differentially expressed genes (DEGs) in OCPs and MOs. Significantly regulated genes (FDR < 0.01 and 2-fold change) are in red. (C and D) Gene set enrichment analysis (GSEA). (C) Top five canonical pathways by GSEA analysis. (D) The enrichment plot shows genes in the Hallmark oxidative phosphorylation gene set from the GSEA analysis. (E) Immunofluorescence staining with anti-NFTAc1 antibodies after culture for 1 day with RANKL. Cells were treated with 5 μM oligomycin or DMSO prior to RANKL stimulation. The left panel shows the representative images. The right panel shows quantification of NFATc1+ cells (n = 7). All data are shown as median and interquartile range. **P < 0.01 by 2-tailed Student’s t test.
Figure 4
Figure 4. Circulating osteoclast precursor cells increase in patients with osteoporosis.
(AE) Bone density was determined by a DXA test, and cOCPs were numerated by flow cytometry in postmenopausal women (n = 44). (A) Schematic for experimental design. (B and C) A correlation plot between cOCPs and lumbar spine (LS) BMD (B) and lumbar spine T score (C). (D and E) A correlation plot between CD14+ monocytes and lumbar spine BMD (D) and lumbar spine T score (E). (F) A correlation plot between cOCPs and CTX. Spearman’s correlation test was used in BE.
Figure 5
Figure 5. Circulating osteoclast precursor cells decrease in patients with osteoporosis treated with denosumab.
(A) Schematic for experimental design. (B and C) A plot of the number of cOCPs (B) and CD14+ cells (C) in denosumab-treated patients (Dmab group, n = 15) and treatment-native patients with osteoporosis (OP, n = 16). (D) Immunofluorescence staining of DAPI and NFATc1. CD14+ cells from patients with osteoporosis and Dmab-treated patients were cultured with M-CSF and RANKL for 1 day. Then, the cells were stained with anti-NFATc1 antibodies. The left panels show representative images of DAPI (nucleus stain) and NFATc1 staining (n ≥ 4). Scale bar: 200 μm. The right panel shows the percentages of NFATc1+ cells per total cells. All data are shown as median and interquartile range. *P < 0.05; ** P < 0.01 by 2-tailed, unpaired t test in BD.

References

    1. NIH Consensus Development Panel on Osteoporosis Prevention Diagnosis. and Therapy Osteoporosis prevention, diagnosis, and therapy. JAMA. 2001;285(6):785–795. doi: 10.1001/jama.285.6.785. - DOI - PubMed
    1. Roche JJ, et al. Effect of comorbidities and postoperative complications on mortality after hip fracture in elderly people: prospective observational cohort study. BMJ. 2005;331(7529):1374. doi: 10.1136/bmj.38643.663843.55. - DOI - PMC - PubMed
    1. Eastell R, et al. Postmenopausal osteoporosis. Nat Rev Dis Primers. 2016;2:16069. doi: 10.1038/nrdp.2016.69. - DOI - PubMed
    1. Johnell O, Kanis JA. An estimate of the worldwide prevalence and disability associated with osteoporotic fractures. Osteoporos Int. 2006;17(12):1726–1733. doi: 10.1007/s00198-006-0172-4. - DOI - PubMed
    1. Amarnath AL, et al. Underuse and overuse of osteoporosis screening in a regional health system: a retrospective cohort study. J Gen Intern Med. 2015;30(12):1733–1740. doi: 10.1007/s11606-015-3349-8. - DOI - PMC - PubMed