. 2024 Dec 2;221(12):e20240699.
doi: 10.1084/jem.20240699. Epub 2024 Nov 22.

Heterozygous BTNL8 variants in individuals with multisystem inflammatory syndrome in children (MIS-C)

Evangelos Bellos #  1   2 Dilys Santillo #  1   2   3 Pierre Vantourout  4   5 Heather R Jackson  1 Amedine Duret  1 Henry Hearn  1   2 Yoann Seeleuthner  6   7 Estelle Talouarn  6   7 Stephanie Hodeib  1   2   3 Harsita Patel  1 Oliver Powell  1 Sophya Yeoh  1 Sobia Mustafa  1 Dominic Habgood-Coote  1 Samuel Nichols  1 Leire Estramiana Elorrieta  1 Giselle D'Souza  1 Victoria J Wright  1 Diego Estrada-Rivadeneyra  1 Adriana H Tremoulet  8   9 Kirsten B Dummer  8   9 Stejara A Netea  10 Antonio Condino-Neto  11 Yu Lung Lau  12 Esmeralda Núñez Cuadros  13 Julie Toubiana  14 Marisol Holanda Pena  15 Frédéric Rieux-Laucat  16   17 Charles-Edouard Luyt  18 Filomeen Haerynck  19 Jean Louis Mège  20 Samya Chakravorty  21   22   23 Elie Haddad  24   25   26 Marie-Paule Morin  26 Özge Metin Akcan  27 Sevgi Keles  28 Melike Emiroglu  29 Gulsum Alkan  29 Sadiye Kübra Tüter Öz  29 Sefika Elmas Bozdemir  28 Guillaume Morelle  30 Alla Volokha  31 Yasemin Kendir-Demirkol  32 Betul Sözeri  33 Taner Coskuner  33 Aysun Yahsi  34 Belgin Gulhan  34 Saliha Kanik-Yuksek  34 Gulsum Iclal Bayhan  35 Aslinur Ozkaya-Parlakay  35 Osman Yesilbas  36 Nevin Hatipoglu  37 Tayfun Ozcelik  38 Alexandre Belot  39 Emilie Chopin  40 Vincent Barlogis  41 Esra Sevketoglu  42 Emin Menentoglu  42 Zeynep Gokce Gayretli Aydin  43 Marketa Bloomfield  44   45 Suzan A AlKhater  46   47 Cyril Cyrus  48 Yuriy Stepanovskiy  49 Anastasiia Bondarenko  49 Fatma Nur Öz  50 Meltem Polat  51 Jiří Fremuth  52 Jan Lebl  53 Amyrath Geraldo  6   7   54   55   56   57 Emmanuelle Jouanguy  6   7   54   55   56   57 COVID-19 Human Genetic EffortDIAMONDSEUCLIDSMichael J Carter  58   59 Paul Wellman  58 Mark Peters  60   61 Rebeca Pérez de Diego  62 Lindsey Ann Edwards  63 Christopher Chiu  64 Mahdad Noursadeghi  65 Alexandre Bolze  66 Chisato Shimizu  8   9 Myrsini Kaforou  1 Melissa Shea Hamilton  1   2 Jethro A Herberg  1 Erica G Schmitt  67 Agusti Rodriguez-Palmero  54   68   69 Aurora Pujol  68   69   70 Jihoon Kim  71   72 Aurélie Cobat  6   7   55 Laurent Abel  6   7   55 Shen-Ying Zhang  6   7   55 Jean-Laurent Casanova  6   7   55   56   57 Taco W Kuijpers  10   73 Jane C Burns  8   9 Michael Levin  1 Adrian C Hayday  4   5 Vanessa Sancho-Shimizu  1   2   3
Collaborators, Affiliations

Heterozygous BTNL8 variants in individuals with multisystem inflammatory syndrome in children (MIS-C)

Evangelos Bellos et al. J Exp Med. .

Abstract

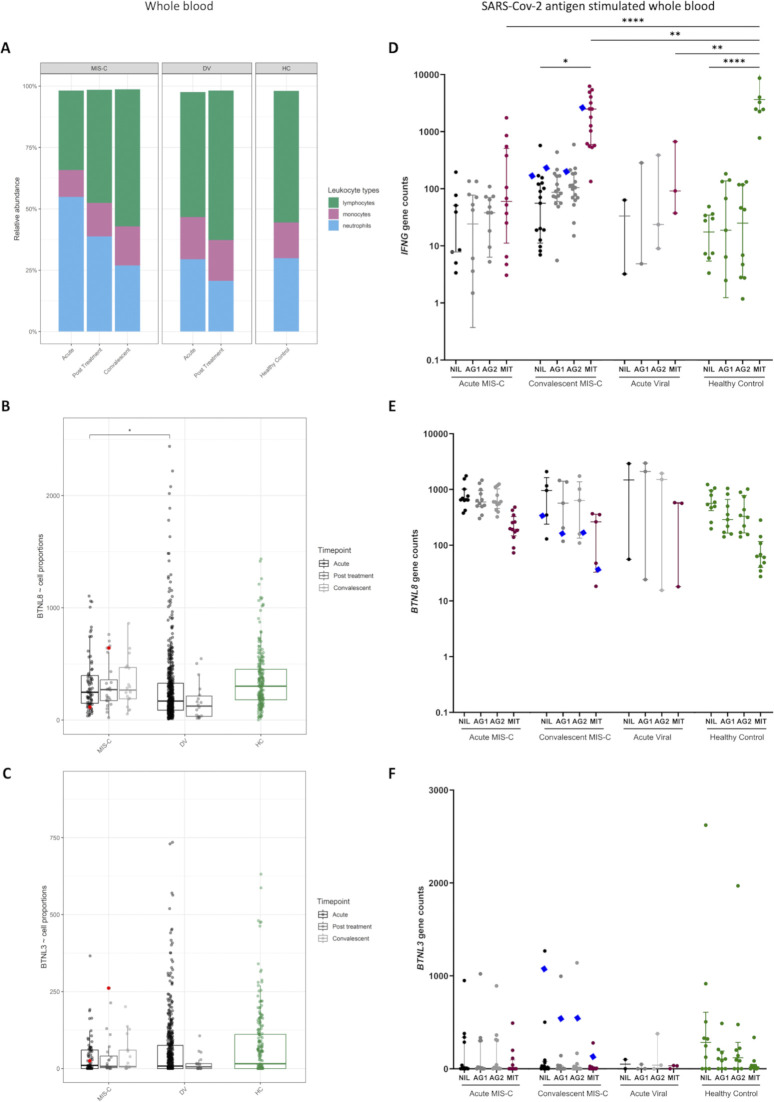
Multisystem inflammatory syndrome in children (MIS-C) is a rare condition following SARS-CoV-2 infection associated with intestinal manifestations. Genetic predisposition, including inborn errors of the OAS-RNAseL pathway, has been reported. We sequenced 154 MIS-C patients and utilized a novel statistical framework of gene burden analysis, "burdenMC," which identified an enrichment for rare predicted-deleterious variants in BTNL8 (OR = 4.2, 95% CI: 3.5-5.3, P < 10-6). BTNL8 encodes an intestinal epithelial regulator of Vγ4+γδ T cells implicated in regulating gut homeostasis. Enrichment was exclusive to MIS-C, being absent in patients with COVID-19 or bacterial disease. Using an available functional test for BTNL8, rare variants from a larger cohort of MIS-C patients (n = 835) were tested which identified eight variants in 18 patients (2.2%) with impaired engagement of Vγ4+γδ T cells. Most of these variants were in the B30.2 domain of BTNL8 implicated in sensing epithelial cell status. These findings were associated with altered intestinal permeability, suggesting a possible link between disrupted gut homeostasis and MIS-C-associated enteropathy triggered by SARS-CoV-2.


Conflict of interest statement

Disclosures: A.H. Tremoulet reported non-financial support from Janssen Pharmaceuticals outside the submitted work. C.-E. Luyt reported personal fees from Advanzpharma, grants from Merck, and non-financial support from Pfizer outside the submitted work. A.C. Hayday reported grants from Takeda Pharmaceuticals, and personal fees from ImmunoQure AG, Prokarium, and TransImmune AG outside the submitted work; in addition, A.C. Hayday had a patent to US20210246187A1 pending (Takeda). No other disclosures were reported.

Figures

Figure S1.
Figure S1.
Schematic of novel genetic burden testing method. (A) The top part of the flowchart represents the cohort-specific analysis steps, including ancestry assignment and variant aggregation. (B) The bottom part of the flowchart represents the Monte Carlo simulations of control datasets using population-level AFs from public databases. Stringent quality control and variant filtering is performed both at the cohort and the database level. Variants that don’t pass the criteria in either dataset are automatically excluded from all downstream analyses. (C) The cohort-specific results are compared to the empirical burden distribution to estimate statistical significance. (D) PCA plot that depicts the inferred ancestry of all samples in the MIS-C burden analysis.
Figure 1.
Figure 1.
Burden testing for rare deleterious variants in all genes across the MIS-C cohort. (A) Circularized Manhattan plot for the combined MIS-C cohort (n = 144; nEUR = 4-; nAFR = 41, nAMR = 45, nSAS = 18). The radial axis depicts the −log10(P value) of the observed burden in MIS-C, while the angular axis is arranged by genomic coordinate clock-wise. Each point in the graph represents a gene, with its radius corresponding to the empirical burden P value and its angle corresponding to the gene’s chromosomal position. The exome-wide significance threshold is denoted by the dashed inner circle. 12 genes carry a statistically significant burden of rare deleterious variants, but 11 of them are only significant in one ancestral group. (B) Circularized Manhattan plot for all the constituent ancestral groups in our MIS-C cohort. Each ancestry is represented in concentric plots of increasing radius to facilitate comparisons. As denoted in red, the only gene that is independently significant in multiple ancestries is BTNL8. (C) Breakdown of findings by ancestry, demonstrating the empirical P value estimation for BTNL8. Control burden distributions are simulated for each population based on ancestry-specific AFs and the actual sample size of the corresponding ancestral group in the MIS-C cohort. The aggregated BTNL8 variants that are observed in MIS-C are then compared with the simulated burden distributions to determine the probability of observing a more extreme outcome. A combined P value for the entire cohort is obtained from the joint burden distribution across ancestries. BTNL8 is statistically significant in the EUR and AMR ancestral groups (as denoted by the blue tail of the distribution) and nominally significant (AF < 0.05) in AFR and SAS (as denoted by the red tail of the distribution). As a result, BTNL8 is also exome-wide significant in the combined analysis. (D) Effect size of BTNL8 association across three cohorts. ORs for each cohort are broken down by ancestry and also include a combined effect denoted by diamonds. The ORs are depicted in log scale, with values of 0 corresponding to no difference between cases and controls. In our MIS-C cohort, rare deleterious variants in BTNL8 appear to have a large effect, with a 4.2-fold increase in odds. This signal is largely driven by the EUR and AMR subpopulations, but all MIS-C ancestral groups have an OR > 2. In the comparator cohorts of COVID-HGE and EUCLIDS, BTNL8 appears to have no effect with ORs around 1 across ancestries. All variants considered have an allele frequency of <1% and CADD score >20.
Figure S2.
Figure S2.
Variation in BTNL8. (A) MTR across ancestral groups calculated using gnomAD 2.1.1 data. An MTR of 1 corresponds to selective neutrality, with lower values indicating intolerance to missense variation. (B) Schematic of BTNL8 protein domains aligned to the coordinates of the MTR plot. (C) Theoretical power calculation for the BTNL8*3 CNV. Assuming a CNV AF of 26%, a large control group derived from gnomAD (100,000 individuals) and an exome-wide significance threshold of 2.5 × 10⁻⁶, the plot depicts the required sample size at different effect size levels. At least 1,380 MIS-C cases would be required to achieve 80% power of detecting a 2.5 OR.
Figure 2.
Figure 2.
Molecular characterization of BTNL8 variants in MIS-C. (A) Schematic representation of BTNL8 depicting location of identified variants. Variants with impairment indicated in red on schematic diagram. (B) CADD score (GRch17-v1.6) versus AF of all BTNL8 variants (<1% AF) identified. (C) Lolliplot of BTNL8 variants identified within the MIS-C and COVID-19 cohorts depicting global AF and location within the protein. p.P299L included as the variant meets the 1% cut off for several relevant ancestral groups. Images created with https://BioRender.com.
Figure 3.
Figure 3.
Structural modeling of the BTNL8/BTNL3 complex. (A) Schematic representation of the BTNL8/BTNL3 heterodimer. The intracellular B30.2 domain facilitates the stabilization of the complex. (B) AlphaFold-generated 3D structure prediction of the complex, visualized with Mol*. The B30.2 domain is highlighted in the green box and the location of all the variants detected in the cohort is highlighted in yellow. (C) RIN analysis of the B30.2 domains. Nodes in the graph correspond to residues and edges correspond to residue-residue interactions. The network is derived from the 3D structure and takes into account geometric parameters and known physico-chemical properties. The resulting graph is a 2D projection of the underlying structure, with yellow nodes indicating the positions of MIS-C variants and edge colors representing different types of interaction. (D) Structural modeling of B30.2 variants. AlphaFold-predicted structures for each variant (i–vi) are superimposed on the reference structure. Reference residues and corresponding 3D planes are depicted in orange, while variants are in magenta.
Figure 4.
Figure 4.
Functional validation of BTNL8 variants. Summary flow cytometry data of the surface expression BTNL3 (first column) and BTNL8 (second column) 48 h after transfection in 293T cells, and of TCR downregulation (third column, normalized to co-culture with cells transfected with EV control) and CD69 upregulation (fourth column, normalized to co-culture with cells transfected with EV control) by J76 cells expressing a Vg4Vg1 TCR (clone hu17) following a 5 h co-culture with transfected 293T cells. Grey symbols with dashed lines indicate WT Reference (Ref) BTNL8 sequence; red symbols with solid lines, indicate BTNL8 variants. Data points are the median of three transfections and co-cultures for each plasmid quantity. Confidence intervals (defined by the range of the replicate measurements) are represented in shaded grey and red areas. ns, not significant; *P < 0.05, **P < 0.01; ***P < 0.001 (unpaired two-tailed t test, comparing each BTNL8 variant to the WT Ref sequence).
Figure S3.
Figure S3.
Flow cytometry data for the functional validation of BTNL8 variants. (A and B) Example flow cytometry plots for (A) the surface expression of BTNL3 and BTNL8 48 h posttransfection of 293T cells transfected with the indicated plasmid quantities and (B) CD3 and CD69 expression on JRT3 cells expressing a Vγ4Vδ1 TCR (clone hu17) following a 5 h co-culture with transfected 293T cells. (C) FLAG-BTNL3–specific gMFI, HA-BTNL8 specific gMFI, TCR downregulation (as % of control) and CD69 upregulation (fold relative to control) for all BTNL8 variants tested.
Figure 5.
Figure 5.
BTNL8 and BTNL3 expression in patient whole blood. (A and B) BTNL8 (A) and BTNL3 (B) RNA expression (normalized counts) throughout disease time course. BTNL8 expression in whole blood during acute illness (TP1), posttreatment (TP2), and convalescence (TP3) of MIS-C and DV (febrile control) phenotypes compared to healthy controls (HC). Patient carrying BTNL8 p.P456S indicated by red dot. (C–E) BTNL8 (C) and BTNL3 (D) and zonulin (E) protein abundance in plasma of acute MIS-C, KD (Kawasaki Disease), and DV phenotypes compared to healthy controls. Statistical significance determined by Mann–Whitney U test (*P < 0.05; **P < 0.01; ****P < 0.0001).
Figure S4.
Figure S4.
BTNL8 expression in whole blood. (A) Relative cellular abundances were estimated from whole blood RNA-seq data (whole blood transcriptomics cohort) using CibersortX. In the acute phase, MIS-C patients exhibit neutrophilia and lymphocytopenia, which gradually resolves. (B) BTNL8 expression (normalized counts) corrected for cell proportions. In the acute phase, the difference between MIS-C and viral cases survives correction. The small differences between MIS-C and healthy controls are further attenuated by the correction. (C) BTNL3 expression (normalized counts) corrected for cell proportions. (D–F) Gene expression of IFNG (D), BTNL8 (E), and BTNL3 (F) in whole blood in response to SARS-CoV-2 antigen (QuantiFERON RNA-seq cohort). Whole blood from acute and convalescent MIS-C patients and DV phenotypes compared with healthy controls following QuantiFERON assay. Individual with BTNL8 p.L101Q variant indicated by blue diamond. Statistical significance determined by one-way ANOVA (*P < 0.05; **P < 0.01; ****P < 0.0001).
Figure S5.
Figure S5.
Abundance of serum proteins used as markers for intestinal integrity. (A) Stratified zonulin abundance comparison between individuals with reported GI symptoms and those without. Colors correspond to the underlying phenotypic group (MIS-C: patients with MIS-C; HC: healthy controls; DV: viral controls). Patients with GI symptoms exhibit higher levels of zonulin than patients without (P = 3 × 10⁻¹⁰), Mann–Whitney. (B–D) Calprotectin (B), lipopolysaccharide binding protein (LPB) (C), and fatty acid binding protein 2 (FABP2) (D). Abundance assessed using SomaScan in plasma of acute MIS-C, KD, and DV phenotypes compared with healthy controls. Statistical significance assessed with Mann–Whitney U test (four significance thresholds: *P < 0.05; **P < 0.01; ***P < 0.001; ****P < 0.0001).
Figure 6.
Figure 6.
Proposed role of BTNL8 in MIS-C. Schematic diagram of proposed mechanism of BTNL8 contribution to MIS-C. Upon infection with SARS-CoV-2, BTNL8 variants are unable to effectively engage with Vγ4+γδ T cells contributing to underlying intestinal inflammation subsequently leading to a hyperinflammatory state. Image created with https://BioRender.com.

References

    1. Abolhassani, H., Delavari S., Landegren N., Shokri S., Bastard P., Du L., Zuo F., Hajebi R., Abolnezhadian F., Iranparast S., et al. . 2022. Genetic and immunologic evaluation of children with inborn errors of immunity and severe or critical COVID-19. J. Allergy Clin. Immunol. 150:1059–1073. 10.1016/j.jaci.2022.09.005 - DOI - PMC - PubMed
    1. Aigner, J., Villatoro S., Rabionet R., Roquer J., Jiménez-Conde J., Martí E., and Estivill X.. 2013. A common 56-kilobase deletion in a primate-specific segmental duplication creates a novel butyrophilin-like protein. BMC Genet. 14:61. 10.1186/1471-2156-14-61 - DOI - PMC - PubMed
    1. Assante, G., Tourna A., Carpani R., Ferrari F., Prati D., Peyvandi F., Blasi F., Bandera A., Le Guennec A., Chokshi S., et al. . 2022. Reduced circulating FABP2 in patients with moderate to severe COVID-19 may indicate enterocyte functional change rather than cell death. Sci. Rep. 12:18792. 10.1038/s41598-022-23282-x - DOI - PMC - PubMed
    1. Asuni, N., and Wilder S.. 2019. VariantKey: A reversible numerical representation of human genetic variants. bioRxiv. 10.1101/473744 (Preprint posted February 15, 2019). - DOI
    1. Backman, J.D., Li A.H., Marcketta A., Sun D., Mbatchou J., Kessler M.D., Benner C., Liu D., Locke A.E., Balasubramanian S., et al. . 2021. Exome sequencing and analysis of 454,787 UK Biobank participants. Nature. 599:628–634. 10.1038/s41586-021-04103-z - DOI - PMC - PubMed

Supplementary concepts

Grants and funding