ProtPipe: A Multifunctional Data Analysis Pipeline for Proteomics and Peptidomics
- PMID: 39576693
- PMCID: PMC11842048
- DOI: 10.1093/gpbjnl/qzae083
ProtPipe: A Multifunctional Data Analysis Pipeline for Proteomics and Peptidomics
Erratum in
-
Correction to: ProtPipe: A Multifunctional Data Analysis Pipeline for Proteomics and Peptidomics.Genomics Proteomics Bioinformatics. 2025 May 10;23(1):qzaf051. doi: 10.1093/gpbjnl/qzaf051. Genomics Proteomics Bioinformatics. 2025. PMID: 40582372 Free PMC article. No abstract available.
Abstract
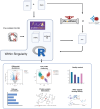
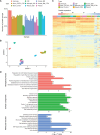
Mass spectrometry (MS) is a technique widely employed for the identification and characterization of proteins, with personalized medicine, systems biology, and biomedical applications. The application of MS-based proteomics advances our understanding of protein function, cellular signaling, and complex biological systems. MS data analysis is a critical process that includes identifying and quantifying proteins and peptides and then exploring their biological functions in downstream analyses. To address the complexities associated with MS data analysis, we developed ProtPipe to streamline and automate the processing and analysis of high-throughput proteomics and peptidomics datasets with DIA-NN preinstalled. The pipeline facilitates data quality control, sample filtering, and normalization, ensuring robust and reliable downstream analyses. ProtPipe provides downstream analyses, including protein and peptide differential abundance identification, pathway enrichment analysis, protein-protein interaction analysis, and major histocompatibility complex (MHC)-peptide binding affinity analysis. ProtPipe generates annotated tables and visualizations by performing statistical post-processing and calculating fold changes between predefined pairwise conditions in an experimental design. It is an open-source, well-documented tool available at https://github.com/NIH-CARD/ProtPipe, with a user-friendly web interface.
Keywords: Data analysis pipeline; Immunopeptidomics; Mass spectrometry; ProtPipe; Proteomics.
Published by Oxford University Press and Science Press on behalf of the Beijing Institute of Genomics, Chinese Academy of Sciences / China National Center for Bioinformation and Genetics Society of China 2024.
Conflict of interest statement
Mike A. Nalls, Cory A. Weller, Nicholas L. Johnson, Syed Shah, and Ziyi Li’s participation in this project was part of a competitive contract awarded to DataTecnica LLC by the National Institutes of Health (NIH) to support open science research. Mike A. Nalls also currently serves on the scientific advisory board for Character Bio Inc., and is a scientific founder at Neuron23 Inc. Björn Oskarsson serves as a consultant for Columbia University/Tsumura Inc., MediciNova, Biogen, uniQure, Amylyx, and Mitsubishi, and has research grants from Columbia University/Tsumura Inc., Biogen, MediciNova, Cytokinetics, Mitsubishi, Calico, Novartis, Sanofi, Ashvattha, and TARGET ALS. Other authors have declared no competing interests.
Figures


Update of
-
ProtPipe: A Multifunctional Data Analysis Pipeline for Proteomics and Peptidomics.bioRxiv [Preprint]. 2023 Dec 13:2023.12.12.571327. doi: 10.1101/2023.12.12.571327. bioRxiv. 2023. Update in: Genomics Proteomics Bioinformatics. 2025 Jan 15;22(6):qzae083. doi: 10.1093/gpbjnl/qzae083. PMID: 38168437 Free PMC article. Updated. Preprint.
References
-
- Aebersold R, Mann M. Mass spectrometry-based proteomics. Nature 2003;422:198–207. - PubMed
-
- Wu CC, Yates JR 3rd. The application of mass spectrometry to membrane proteomics. Nat Biotechnol 2003;21:262–7. - PubMed
-
- Wepf A, Glatter T, Schmidt A, Aebersold R, Gstaiger M. Quantitative interaction proteomics using mass spectrometry. Nat Methods 2009;6:203–5. - PubMed
-
- Bantscheff M, Lemeer S, Savitski MM, Kuster B. Quantitative mass spectrometry in proteomics: critical review update from 2007 to the present. Anal Bioanal Chem 2012;404:939–65. - PubMed
-
- Rozanova S, Barkovits K, Nikolov M, Schmidt C, Urlaub H, Marcus K. Quantitative mass spectrometry-based proteomics: an overview. Methods Mol Biol 2021;2228:85–116. - PubMed
MeSH terms
Substances
Grants and funding
LinkOut - more resources
Full Text Sources
Research Materials

