. 2024 Nov 22;19(11):e0311345.
doi: 10.1371/journal.pone.0311345. eCollection 2024.

Glycemic load impacts the response of acquired resistance in breast cancer cells to chemotherapeutic drugs in vitro

Affiliations

Glycemic load impacts the response of acquired resistance in breast cancer cells to chemotherapeutic drugs in vitro

Sirin A Adham et al. PLoS One. .

Abstract

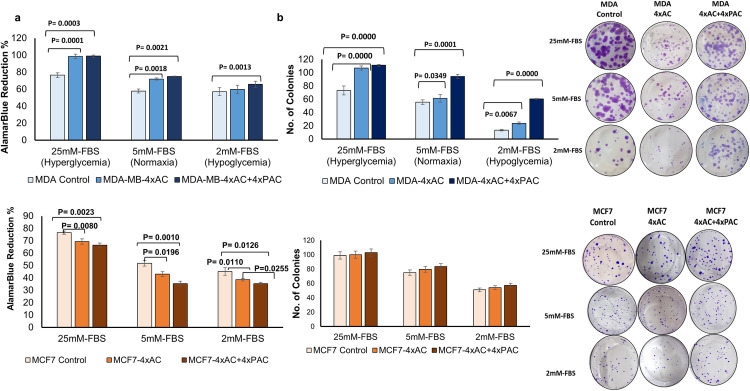
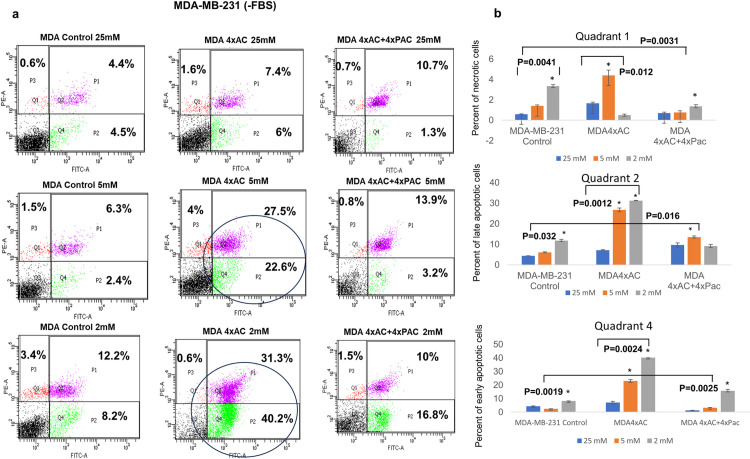
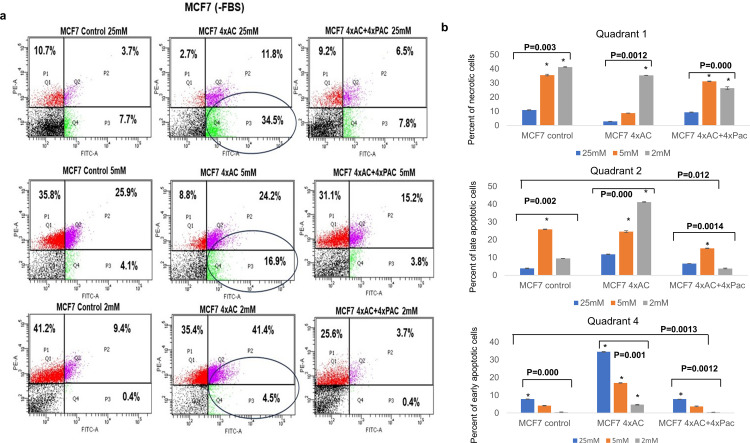
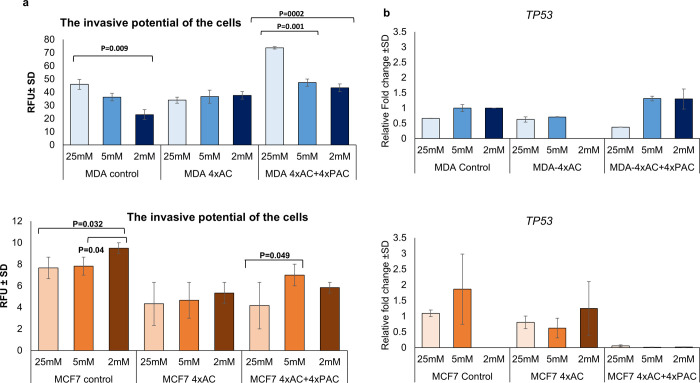
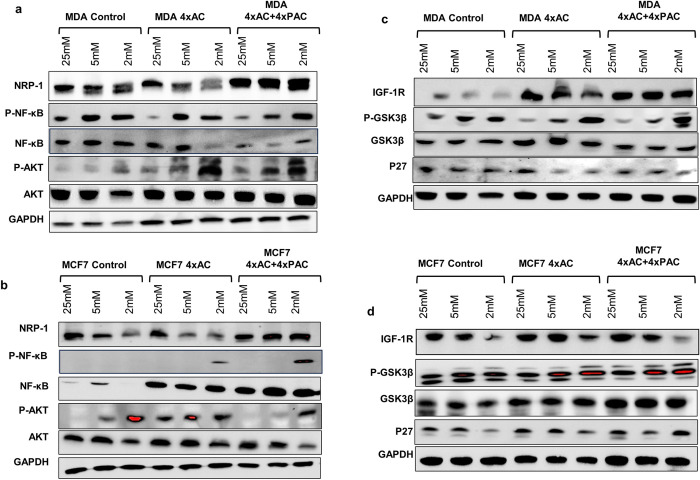
Resisting chemotherapy is a significant hurdle in treating breast cancer. Locally advanced breast cancer patients undergo four cycles of Adriamycin and Cyclophosphamide, followed by four cycles of Paclitaxel before surgery. Some patients resist this regimen, and their cancer recurred. Our study aimed to understand the underlying mechanisms of acquired resistance during these specific treatment phases. We explored how breast cancer cells, resistant to chemotherapy, respond to different glucose levels, shedding light on the intricate relationship between diabetes, breast cancer subtype, and resistance to preoperative chemotherapy. We examined two groups of cell lines: the standard MDA-MB-231 and MCF7 cells and their resistant counterparts after exposure to four cycles of Adriamycin and cyclophosphamide (4xAC) or four cycles of 4xAC and Paclitaxel (4xAC+4xPAC), aiming to unravel the mechanisms and cellular responses at these critical treatment stages. Notably, under normal and low glucose conditions, the resistant MDA-MB-231 cells showed accelerated growth compared to the control cells, while the resistant MCF7 cells proliferated more slowly than their original counterparts. Resistance to 4xAC resulted in significant cell death in both cell lines, especially under low glucose conditions, in contrast to control or 4xAC+4xPAC-resistant cells. The similarity between the MCF7 4xAC+4xPAC resistant cells and the control might be due to the P-AKT expression pattern in response to glucose levels since the levels were constant in MCF7 4xAC in all glucose concentrations. Molecular analysis revealed specific protein accumulations explaining the heightened proliferation and invasion in resistant MDA-MB-231 cells and their ability to withstand low glucose levels compared to MCF7. In conclusion, increased drug involvement corresponds to increased cell resistance, and changes in glucose levels differentially impact resistant variant cells to different drugs. The findings can be translated clinically to explain patients' differential responses to preoperative chemotherapy cycles considering their breast cancer subtype and diabetic status.


Conflict of interest statement

The authors have declared that no competing interests exist.

Figures

Fig 1
Fig 1. Glucose levels govern cell proliferation.
(a&b Top panel) Resistant MDA-4xAC and MDA-4xAC+4xPAC proliferated and produced more colonies compared to control cells under hyperglycemia (25 mM) and normal glucose level (5 mM). Resistant MCF7-4xAC and MCF7-4xAC+4xPAC proliferated and had fewer and smaller colonies than control MCF7 cells (bottom panel).
Fig 2
Fig 2. MDA 4xAC highly glucose sensitive.
(a) Representative flow cytometry plots of MDA-MB-231 control and resistant variant cells under 25 mM, 5 mM, and 2 mM glucose levels. Numbers in quadrants show the average percentages of necrotic (.I.PI stained), early (FITC stained), and late apoptotic cells population (double stained PI&FITC). (b) Graphs summarizes the results of three independent flow cytometry experiments quantifing the mean ±SD of MDA control, MDA 4xAC, and MDA 4xAC+4xPac of necrotic cells in quadrants #1 late apoptotic cells in quadrants #2, and early apoptotic cells in quadrants #4. * represents p value less than 0.05.
Fig 3
Fig 3. MCF7 4xAC highly glucose-sensitive.
(a) Representative flow cytometry plots of MCF7 control and resistant variant cells under 25 mM, 5 mM, and 2 mM glucose levels. Numbers in quadrants show the mean percentages of necrotic (PI stained), early (FITC stained), and late apoptotic cells population (double stained PI&FITC). (b) Graphs summarizes the results of three independent flow cytometry experiments quantifying the mean ±SD of MDA control, MDA 4xAC, and MDA 4xAC+4xPac of necrotic cells in quadrants #1 late apoptotic cells in quadrants #2, and early apoptotic cells in quadrants #4. * represents p value less than 0.05.
Fig 4
Fig 4. Constant invasion in 4xAC resistance.
(a) The Top graph displays MDA-MB-231 control and resistant cell invasion under three glucose levels (25 mM, 5 mM, and 2 mM). The bottom graph illustrates MCF7 control and resistant cell invasion. (b) Real-time PCR results for TP53 transcripts in MDA-MB-231 and MCF7 control and resistant cells under 25 mM, 5 mM, and 2 mM glucose. The experiments were replicated three times independently; significance was considered at P<0.05.
Fig 5
Fig 5. Signaling pathway analysis using immunoblots.
Panel (a), western blot analysis shows the blots of NRP-1, P-NF-kB, NF-kB, P-AKT-473, AKT, and GAPDH of MDA-MB-231 control and resistant variants under 25 mM, 5 mM, and 2 mM of glucose. Panel (b) shows the same proteins but in MCF7 control and resistant variants. Panel (c), western blot analysis shows the blots of IGF1R,P-GSK3β, GSK3β, P27 and GAPDH of MDA-MB-231 control and resistant variants under 25 mM, 5 mM, and 2 mM of glucose. Panel (d) shows the same proteins but in MCF7 control and resistant variants. The graphs of the figures show the protein bands’ mean relative intensity.

Similar articles

Cited by

References

    1. Sung H, Ferlay J, Siegel RL, Laversanne M, Soerjomataram I, Jemal A, et al.. Global cancer statistics 2020: GLOBOCAN estimates of incidence and mortality worldwide for 36 cancers in 185 countries. CA: a cancer journal for clinicians. 2021;71(3):209–49. doi: 10.3322/caac.21660 - DOI - PubMed
    1. Lyssiotis CA, Kimmelman AC. Metabolic interactions in the tumor microenvironment. Trends in cell biology. 2017;27(11):863–75. doi: 10.1016/j.tcb.2017.06.003 - DOI - PMC - PubMed
    1. Eketunde AO. Diabetes as a risk factor for breast cancer. Cureus. 2020;12(5). doi: 10.7759/cureus.8010 - DOI - PMC - PubMed
    1. D’Esposito V, Ambrosio MR, Giuliano M, Cabaro S, Miele C, Beguinot F, et al.. Mammary adipose tissue control of breast cancer progression: Impact of obesity and diabetes. Frontiers in oncology. 2020:1554. doi: 10.3389/fonc.2020.01554 - DOI - PMC - PubMed
    1. Wahdan-Alaswad RS, Thor AD. Metformin activity against breast cancer: mechanistic differences by molecular subtype and metabolic conditions. Metformin: IntechOpen London, UK; 2020.