. 2024 Nov 22;10(47):eadr9891.
doi: 10.1126/sciadv.adr9891. Epub 2024 Nov 22.

Functional anatomy of the subthalamic nucleus and the pathophysiology of cardinal features of Parkinson's disease unraveled by focused ultrasound ablation

Affiliations

Functional anatomy of the subthalamic nucleus and the pathophysiology of cardinal features of Parkinson's disease unraveled by focused ultrasound ablation

Rafael Rodriguez-Rojas et al. Sci Adv. .

Abstract

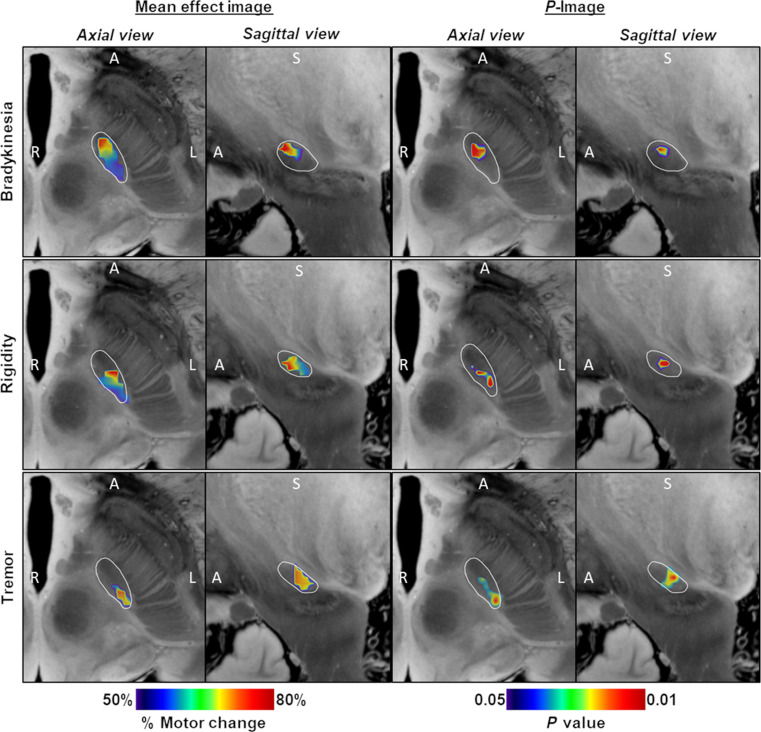
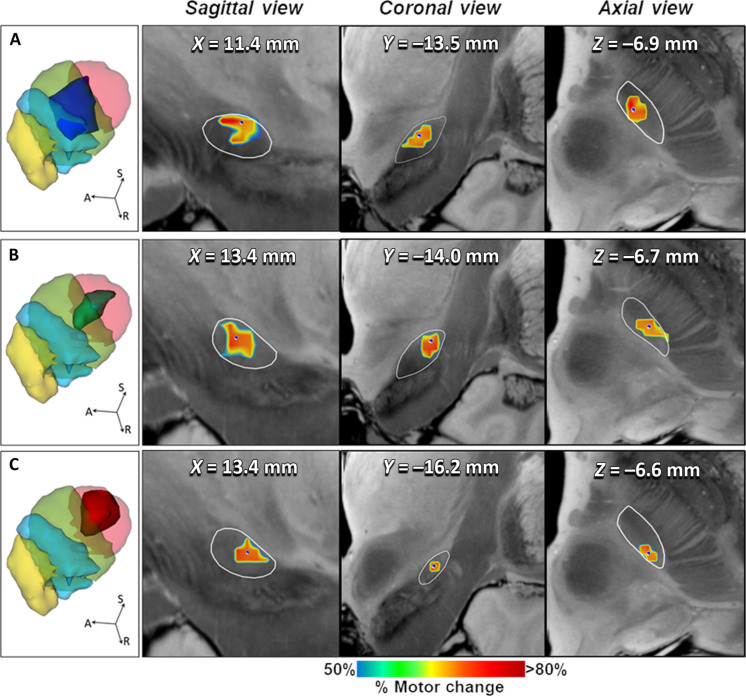
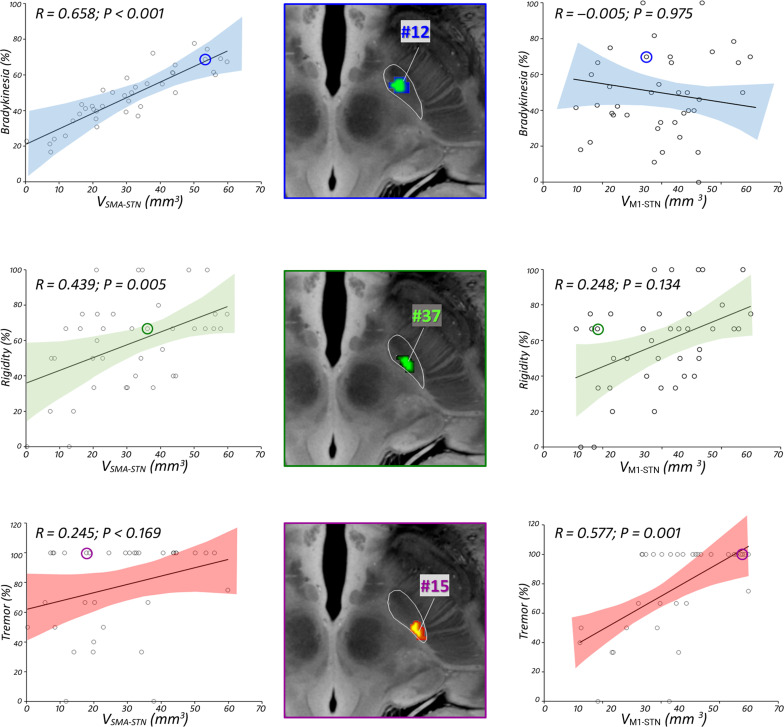
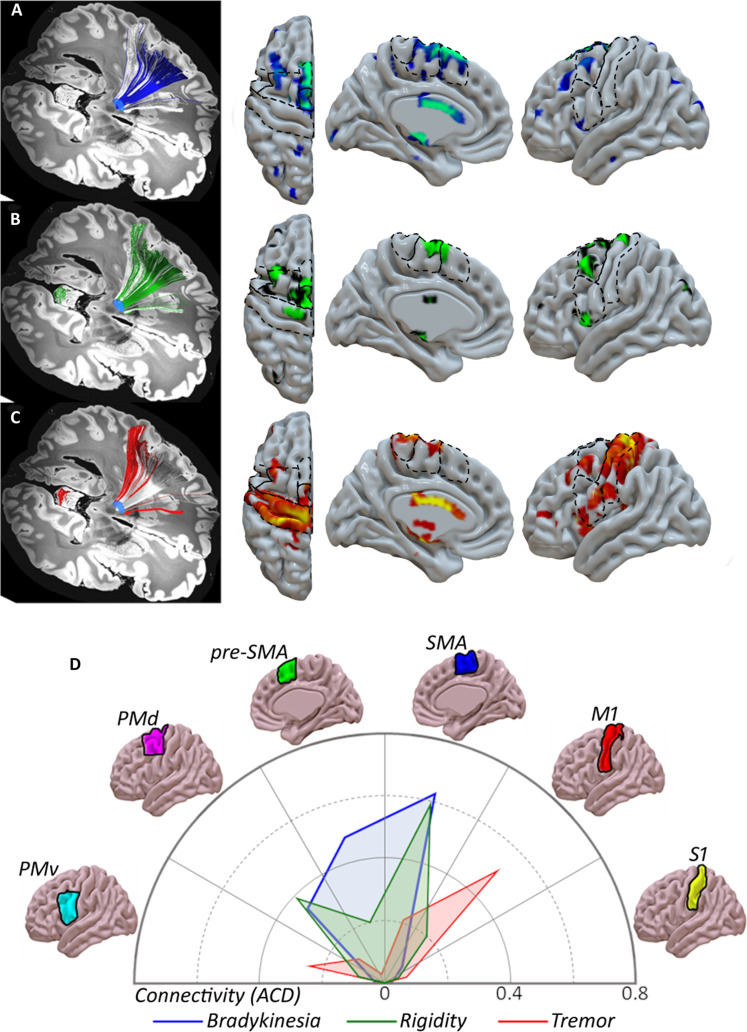
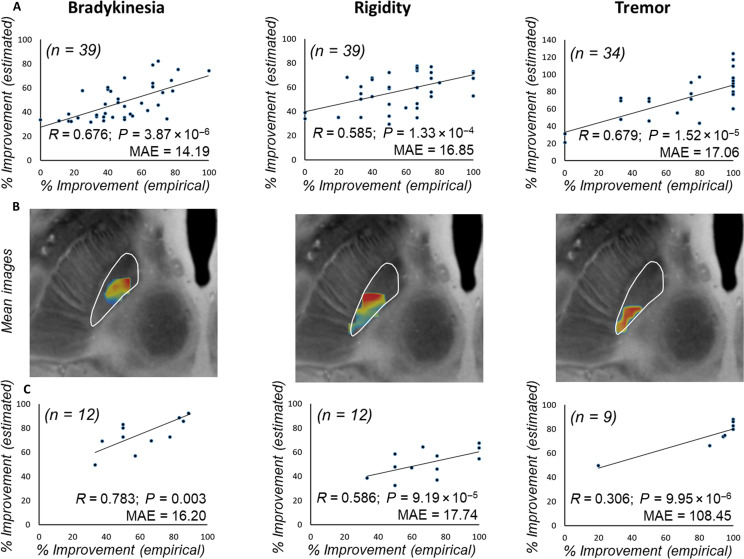
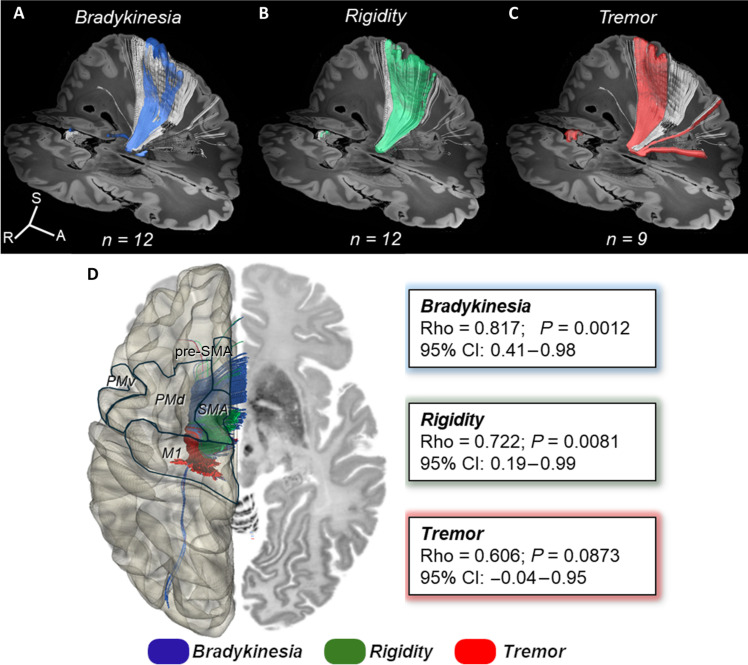
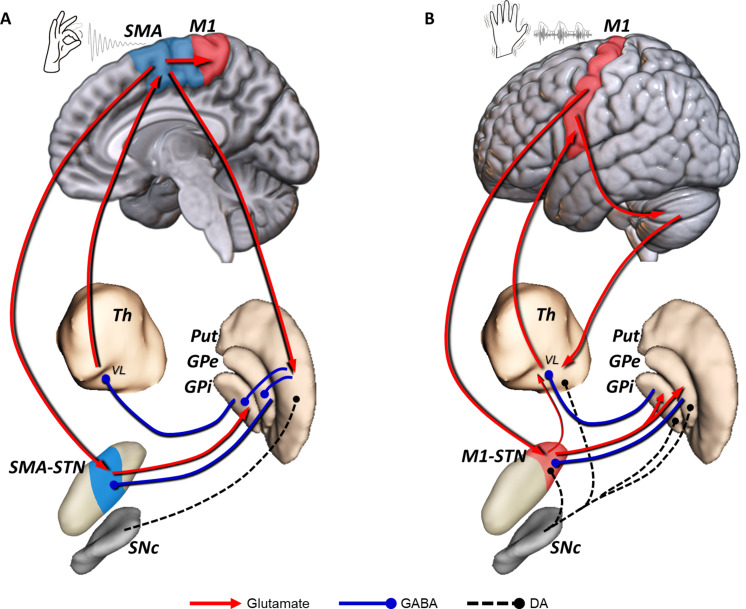
The subthalamic nucleus (STN) modulates basal ganglia output and plays a fundamental role in the pathophysiology of Parkinson's disease (PD). Blockade/ablation of the STN improves motor signs in PD. We assessed the topography of focused ultrasound subthalamotomy (n = 39) by voxel-based lesion-symptom mapping to identify statistically validated brain voxels with the optimal effect against each cardinal feature and their respective cortical connectivity patterns by diffusion-weighted tractography. Bradykinesia and rigidity amelioration were associated with ablation of the rostral motor STN subregion connected to the supplementary motor and premotor cortices, whereas antitremor effect was explained by lesioning the posterolateral STN projection to the primary motor cortex. These findings were corroborated prospectively in another PD cohort (n = 12). This work concurs with recent deep brain stimulation findings that suggest different corticosubthalamic circuits underlying each PD cardinal feature. Our results provide sound evidence in humans of segregated anatomy of subthalamic-cortical connections and their distinct role in PD pathophysiology and normal motor control.


Figures

Fig. 1.
Fig. 1.. Probabilistic FUS-STN lesion location maps associated with improvement in cardinal motor features.
(Left) Axial and sagittal slices of the mean effect image for each motor feature, color coded by the degree of improvement. (Right) Corresponding P-images. Color coding depicts the results of Brunner-Munzel test on a voxel-by-voxel basis. Only voxels that survived a P < 0.05 permutation threshold are included. The STN, outlined in white, is superimposed on slices of a 100-μm, 7-T brain scan in the MNI152 space (76). The image orientation is indicated for each slice: A, anterior; S, superior; and R/L, right/left.
Fig. 2.
Fig. 2.. Topography of FUS-STN lesions for best clinical effect on cardinal motor features.
Left column illustrates three-dimensional (3D) rendering of significant mean effect image (i.e., sweet spot) for (A) bradykinesia (dark blue surface), (B) rigidity (green surface), and (C) tremor (red surface), superimposed to a 3D representation of the quadripartite STN atlas (7). Functional subregions of the STN are highlighted (primary sensorimotor in red, supplementary motor in green, associative in blue, and limbic in yellow). The following columns show the sagittal, coronal, and axial views of significant mean effect image, color coded by the degree of improvement for each clinical feature relative to STN anatomy (white outlines) and overlaid with an ultrahigh-resolution (100-μm) template of the human brain (76). Colored voxels survived a P threshold of 0.05 (Brunner-Munzel rank test), after permutation-based FDR correction for multiple comparisons. The MNI coordinates in the sagittal, coronal, and axial planes of the center of mass (blue dot) of each sweet spot are also represented. A, anterior; S, superior; R, right.
Fig. 3.
Fig. 3.. Relationship between clinical outcome and lesion overlap with STN subregions.
Scatterplot and 95% confidence interval (shaded area) between motor improvement and volume of the SMA-STN (left) and M1-STN (right) covered by the respective lesion. Standardized regression coefficients R reflect the effect of the impact on motor subregions contributing to prediction of efficacy for each motor feature (blue for bradykinesia, green for rigidity, and red for tremor). (Middle) Lesion reconstruction of illustrative example subjects, overlaid with an ultrahigh-resolution (100-μm) template of the human brain (76). Selected examples include three different patients who exhibited sign-selective response per clinical feature: bradykinesia (blue), rigidity (green), tremor (red-yellow). See table S2 for clinical details for every subject. Adjusted clinical outcomes were regressed against the other predictor variable and controlled per total lesion volume.
Fig. 4.
Fig. 4.. Corticosubthalamic connectivity patterns of FUS-STN lesions.
Sign-response tractography for bradykinesia (A), rigidity (B), and tremor (C). From left to right: efficacy clusters, color-coded fiber distribution from each sweet spot, and track density maps (number of tracts per vertex), overlaid on the MNI surface template (28). The streamline distribution seeding from lesion volumes across patients is reconstructed in white. (D) ACD values based on FUS-STN connectivity with cortical regions of interest: M1, primary motor cortex; PMd, dorsal premotor cortex; PMv, ventral premotor cortex; SMA, supplementary motor area; pre-SMA, pre-supplementary motor area; and S1, primary somatosensory cortex. Color codes are consistently related to improvement in motor features: bradykinesia (blue), rigidity (green), and tremor (red).
Fig. 5.
Fig. 5.. Predicting FUS subthalamotomy outcome based on lesion topography.
(A) Actual versus predicted improvement in Test Cohorts using a leave-one-out procedure. (B) Lesion distribution of the independent validation dataset (n = 12), weighted by their corresponding relative improvement for each motor sign. (C) Estimation of motor improvements in the Validation Cohort based on the original model from the Test Cohort, using the Spearman correlation analysis. MAE, median absolute error.
Fig. 6.
Fig. 6.. Predictive fiber tracts in Validation Cohort.
(Top) All fibers connected to the sum of lesions in the Validation Cohort are shown in white. Predictive fibers associated with improvement in bradykinesia (A), rigidity (B), and tremor (C) are color coded. (D) (Left) Cortical projections of color-coded streamlines associated with motor improvements. Motor cortical regions from a human motor area template (28) are delineated in a semitransparent brain surface in the MNI space. (Right) Streamlines were transformed to tract density images, and degrees of effective fibers affected by single lesions were rank correlated in a voxel-wise manner with motor improvement across the Validation Cohort. P values are based on Spearman correlations with bootstrapping resampling (1000 replications). See fig. S5 for associated tract density images. Rho, Spearman R; 95% CI, 95% confidence interval.
Fig. 7.
Fig. 7.. Segregated circuits for bradykinesia and resting tremor in PD.
(A) Loss of nigrostriatal DA changes the regulation of direct/indirect pathways and leads to an abnormal firing pattern in the rostral motor STN (SMA-STN), which is connected with the motor cortex through the SMA-STN hyperdirect pathway. This altered neuronal activity is also present in the rostral area of the motor GPi, which, in turn, projects to the VL thalamus and leads to excessive inhibition of the thalamo-cortical excitatory projection to the motor cortex, particularly SMA. (B) Dopaminergic extrastriatal loss modifies the balance of the STN-GPe microcircuitry (i.e., excitation/inhibition), giving rise to abnormal oscillatory activity at 4 to 6 Hz. This resting tremor activity is found within the most caudal area of the motor STN (M1-STN). Tremor activity probably reaches the cortex through the thalamo-cortical projection to the M1. The cerebello-thalamo-cortical network contributes to the maintenance and amplification of resting tremor triggered by peripheral feedback, and possibly the M1-STN hyperdirect pathway reinforces the oscillatory activity within the STN. A putative direct subthalamo-thalamic connection (77), which might facilitate tremor propagation from the STN-GPe pacemaker to the motor cortex through the thalamus, has not been described in humans. DA, dopaminergic; GPe, globus pallidus pars externa; GPi, globus pallidus pars interna; M1, primary motor cortex; Put, putamen; SNc, substantia nigra pars compacta; STN, subthalamic nucleus; Th, thalamus; SMA, supplementary motor area; VL, ventrolateral thalamus; GABA, γ-aminobutyric acid.

References

    1. DeLong M. R., Wichmann T., Basal ganglia circuits as targets for neuromodulation in Parkinson disease. JAMA Neurol. 72, 1354–1360 (2015). - PubMed
    1. Krack P., Volkmann J., Tinkhauser G., Deuschl G., Deep brain stimulation in movement disorders: From experimental surgery to evidence-based therapy. Mov. Disord. 34, 1795–1810 (2019). - PubMed
    1. Haynes W. I., Haber S. N., The organization of prefrontal-subthalamic inputs in primates provides an anatomical substrate for both functional specificity and integration: Implications for Basal Ganglia models and deep brain stimulation. J. Neurosci. 33, 4804–4814 (2013). - PMC - PubMed
    1. Keuken M. C., Uylings H. B. M., Geyer S., Schäfer A., Turner R., Forstmann B. U., Are there three subdivisions in the primate subthalamic nucleus? Front Neuroanat. 6, 14 (2012). - PMC - PubMed
    1. Nambu A., Takada M., Inase M., Tokuno H., Dual somatotopical representations in the primate subthalamic nucleus: Evidence for ordered but reversed body-map transformations from the primary motor cortex and the supplementary motor area. J. Neurosci. 16, 2671–2683 (1996). - PMC - PubMed