. 2024 Nov 22;10(47):eadn4306.
doi: 10.1126/sciadv.adn4306. Epub 2024 Nov 22.

Single-cell multi-omics sequencing uncovers region-specific plasticity of glioblastoma for complementary therapeutic targeting

Affiliations

Single-cell multi-omics sequencing uncovers region-specific plasticity of glioblastoma for complementary therapeutic targeting

Xin Wang et al. Sci Adv. .

Abstract

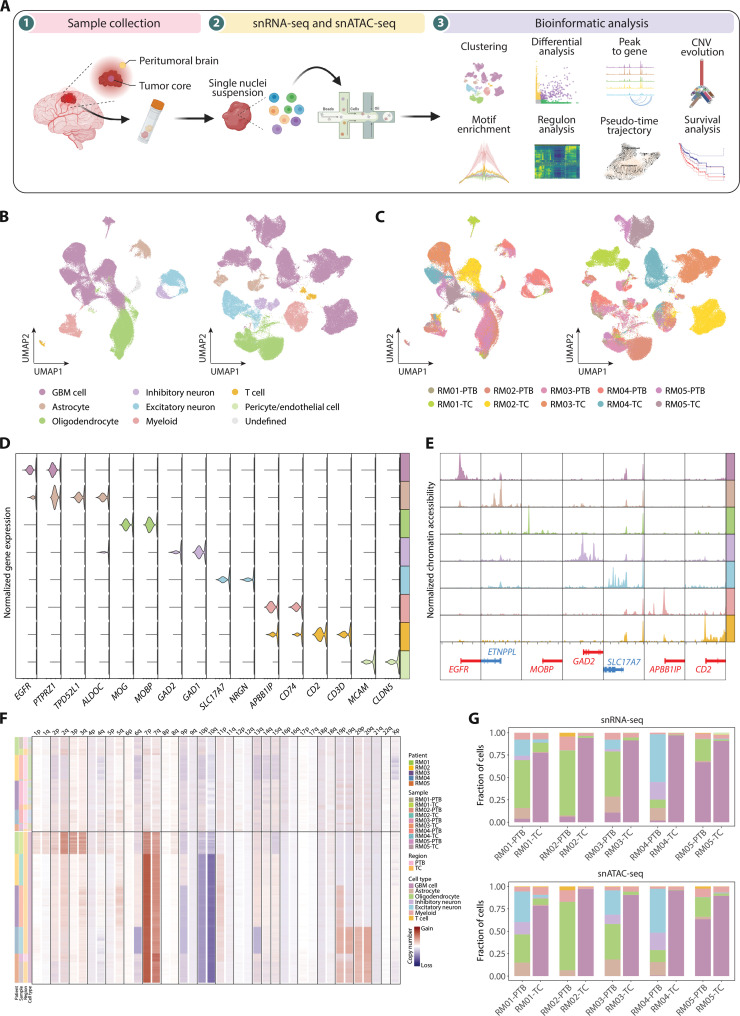
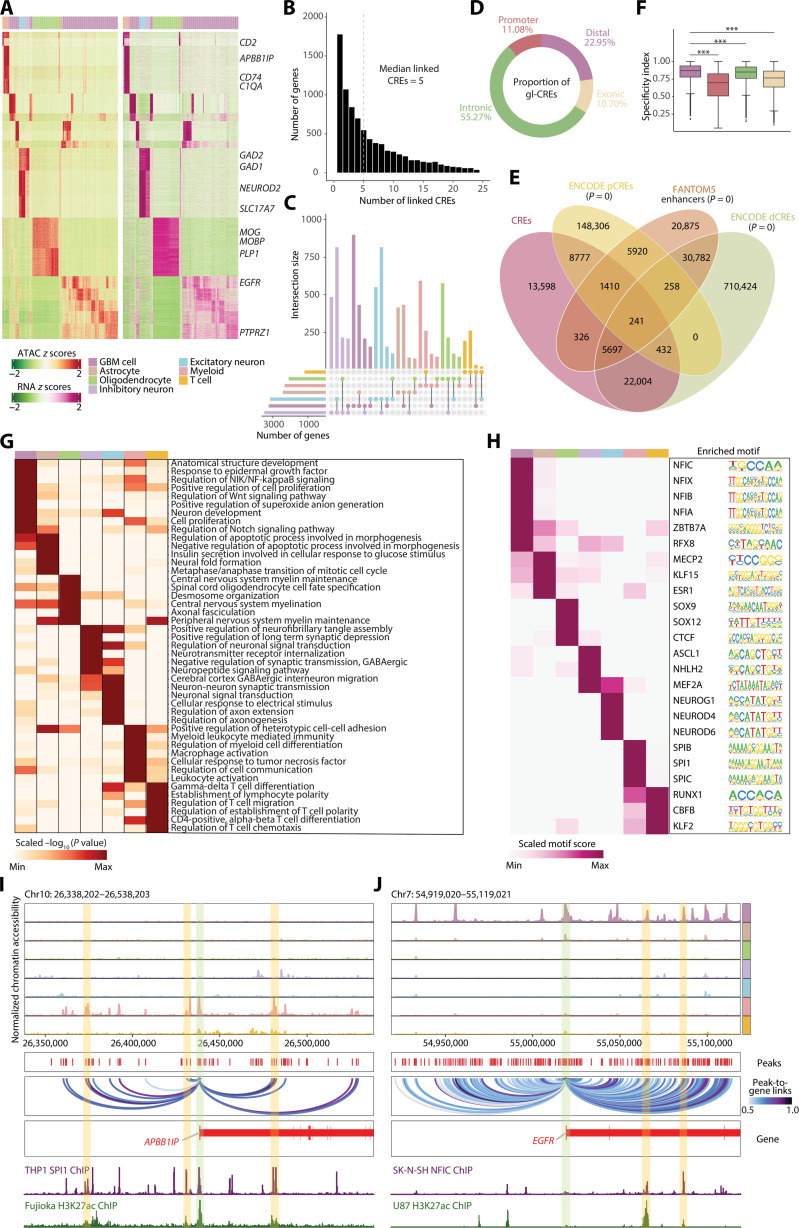
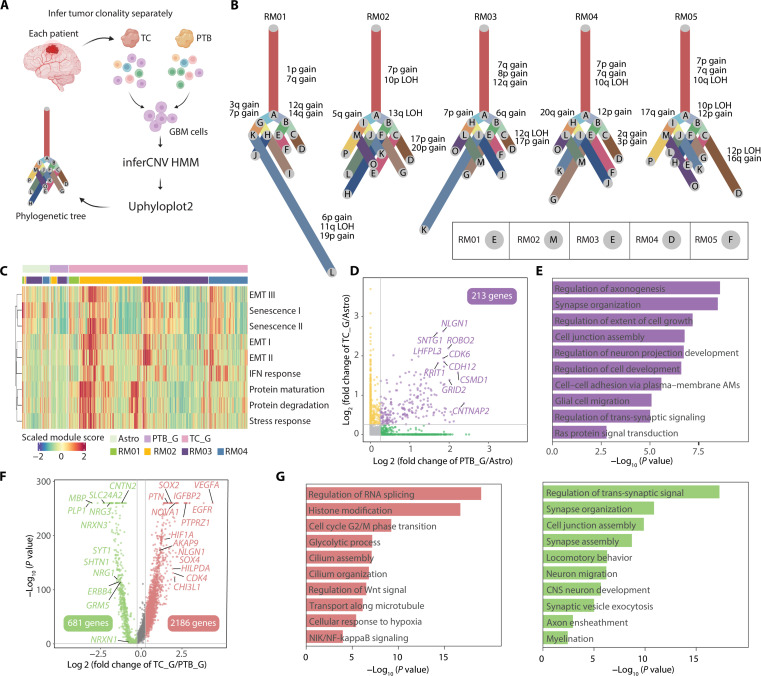
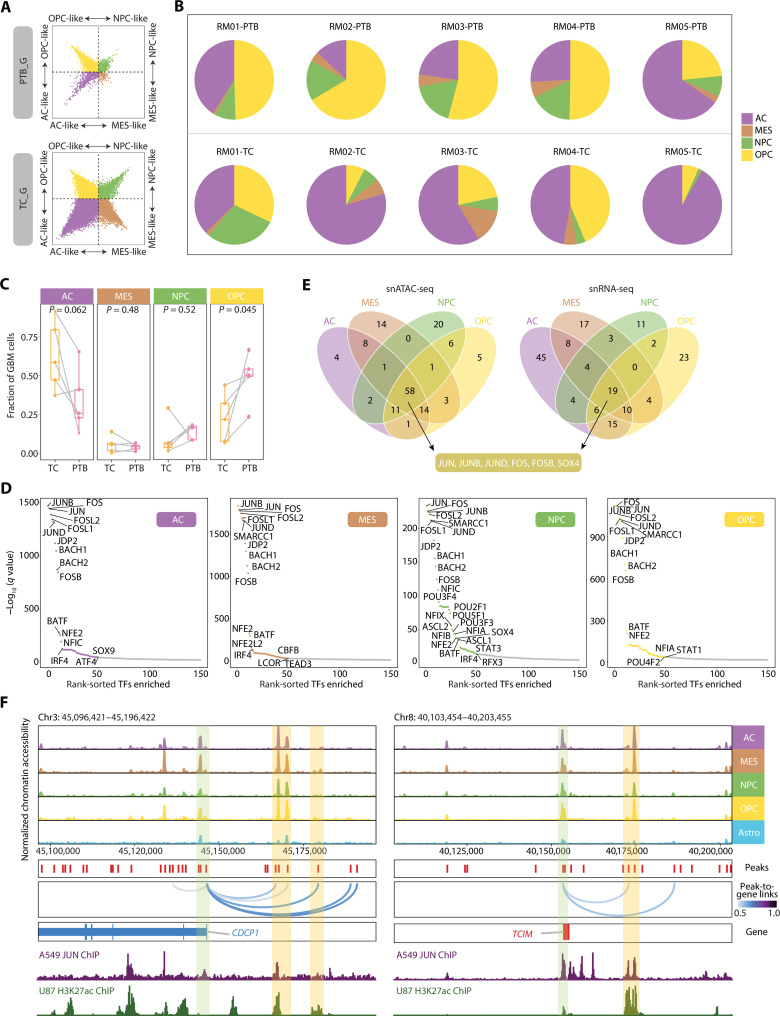
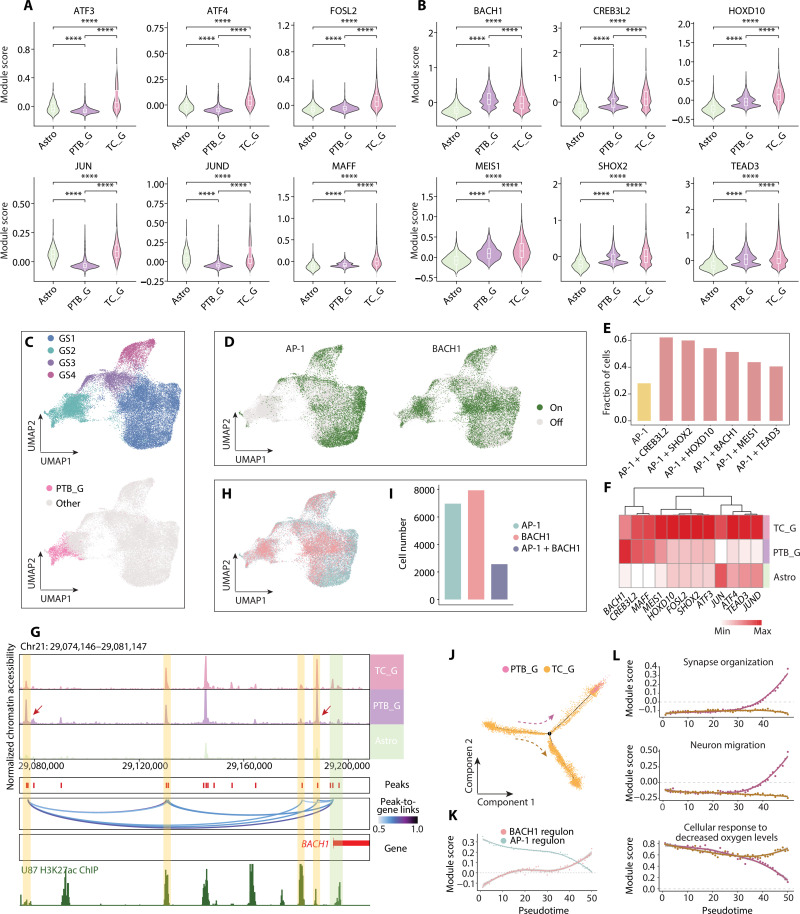
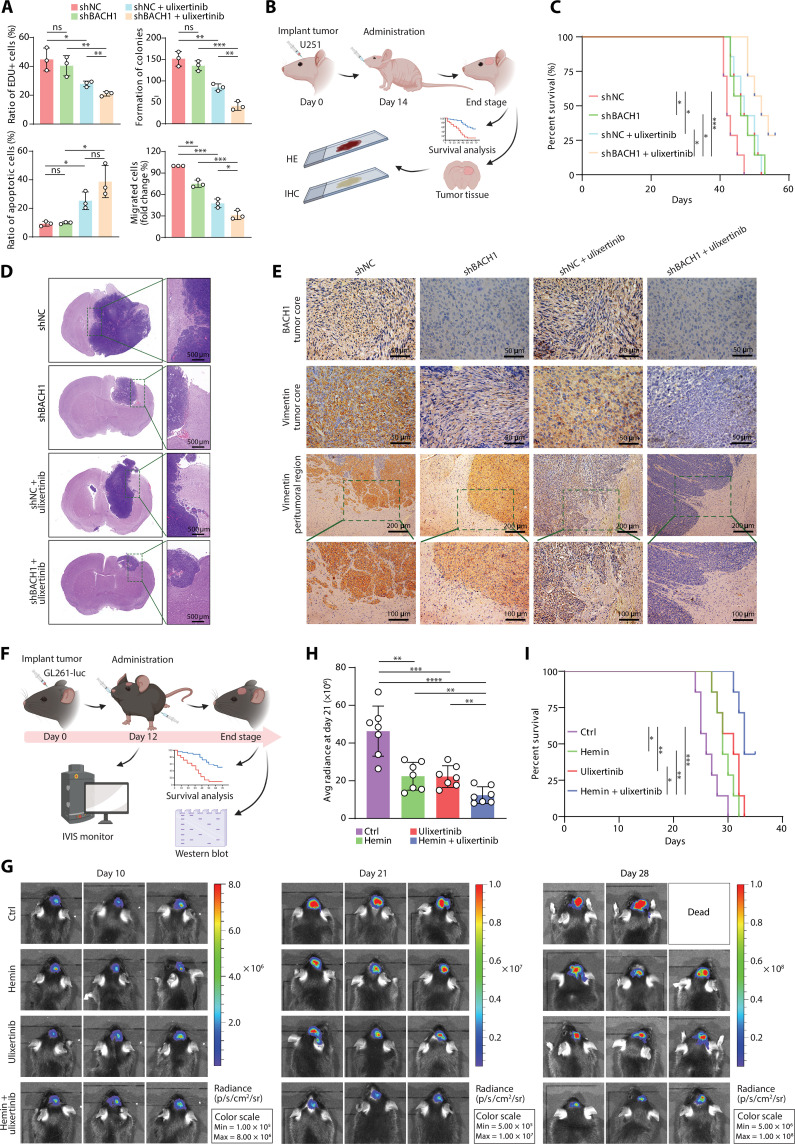
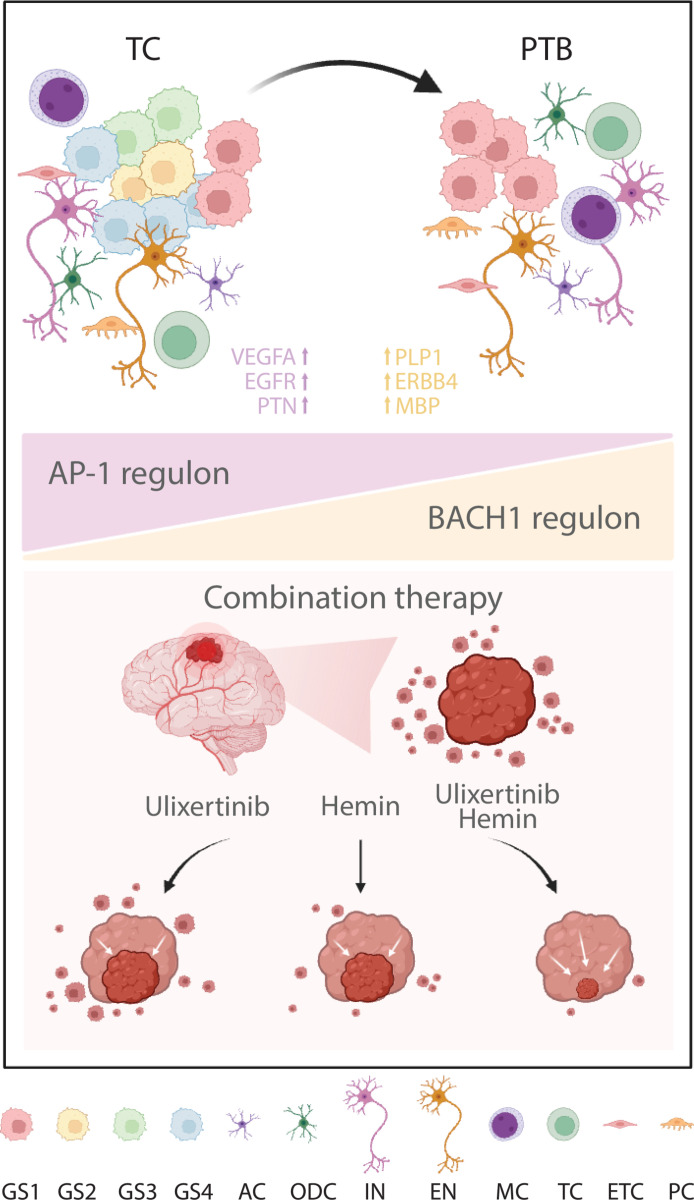
Glioblastoma (GBM) cells are highly heterogeneous and invasive, leading to treatment resistance and relapse. However, the molecular regulation in and distal to tumors remains elusive. Here, we collected paired tissues from the tumor core (TC) and peritumoral brain (PTB) for integrated snRNA-seq and snATAC-seq analyses. Tumor cells infiltrating PTB from TC behave more like oligodendrocyte progenitor cells than astrocytes at the transcriptome level. Dual-omics analyses further suggest that the distal regulatory regions in the tumor genome and specific transcription factors are potential determinants of regional heterogeneity. Notably, while activator protein 1 (AP-1) is active in all GBM states, its activity declines from TC to PTB, with another transcription factor, BACH1, showing the opposite trend. Combined inhibition of AP-1 and BACH1 more efficiently attenuates the tumor progression in mice and prolongs survival than either single-target treatment. Together, our work reveals marked molecular alterations of infiltrated GBM cells and a synergy of combination therapy targeting intratumor heterogeneity in and distal to GBM.


Figures

Fig. 1.
Fig. 1.. Single-cell atlas of gene expression and chromatin accessibility in glioblastoma.
(A) Schematic representation of the experimental workflow. Primary surgical samples were obtained and then dissociated for single-cell sequencing. Clustering and other downstream bioinformatic analyses were performed. (B) Uniform manifold approximation and projection (UMAP) visualization colored by cell types for snRNA-seq (left) and snATAC-seq (right). (C) UMAP plot colored by samples for snRNA-seq (left) and snATAC-seq (right). (D) Violin plot for expression of canonical cell-type markers in snRNA-seq. (E) Pseudo-bulk chromatin accessibility profiles for canonical marker genes. Chromosome positions are shown below, with genes on the plus strand colored in red and minus strand in blue. Chromosome coordinates are: EGFR (chr7: 55009020–55029021), ETNPPL (chr4: 108753053–108773054), MOBP (chr3: 39457197–39477198), GAD2 (chr10: 26206306–26226307), SLC17A7 (chr19: 49432359–49452360), APBB1IP (chr10: 26428202–26448203), and CD2 (chr1: 116744384–116764385). (F) CNV profile inferred from snATAC-seq. Rows correspond to cells and columns represent the chromosomal locations. (G) Stacked bar charts showing the proportional composition of cell types across samples in snRNA-seq (top) and snATAC-seq (bottom).
Fig. 2.
Fig. 2.. Distal peaks confer cell type specificality and reveal the underlying cell type–specific TF regulation.
(A) Heatmaps showing chromatin accessibility (left) and gene expression (right) of significantly linked CRE-gene pairs. (B) Histogram showing the number of genes that with 1 to 25 linked CREs. (C) Upset visualization of the overlaps between CRE-linked genes identified in each cell type. The size of CRE-linked genes of each cell type is shown on the left bar plot, and the number of overlapping genes between two cell types or unique genes in one cell type is shown on the top bar plot. (D) Donut diagram showing the genomic distribution of gl-CREs. (E) Venn diagram showing the overlaps of CREs with proximal and distal enhancer-like elements (pCREs and dCREs) revealed by ENCODE (37) or enhancers by FANTOM5 (38). (F) Boxplot showing cell-type specificity of differentially accessible peaks across distal, promoter, intronic, and exonic regions. The cell-type specificity index was measured on scaled, log2 transformed averaged peak accessibility. Wilcoxon statistical test was used. For boxplot, the line and box boundaries correspond to the median and the interquartile range (IDR), respectively. Whiskers extend to 1.5 times the IDR. (G) Heatmap showing the GREAT terms enriched in differential distal peaks. The value corresponds to row normalized −log10 corrected P values (Benjamini-Hochberg) from binomial test on the enriched list of GREAT terms. (H) Heatmap of regulators per cell type determined by the motif enrichment analysis for differential distal peaks. The binding motif logos are shown right. (I and J) Genome track visualization of loci for the selected markers. Inferred peak-to-gene links across the GBM dataset are shown in the middle, and chromatin immunoprecipitation sequencing (ChIP-seq) tracks for identified TFs (SPI1 for myeloid and NFIC for GBM cell) and H3K27ac are shown bottom. ***P < 0.001.
Fig. 3.
Fig. 3.. Infiltrated GBM cells harbor different characteristics compared with GBM cells in the TC.
(A) Schematic diagram depicting the process of tumor evolution analysis. (B) Phylogenetic trees of GBM cells for each patient. Branch lengths are proportional to the number of cells in the subclone harboring the corresponding CNVs. The canonical CNV events of each branch were labeled on the side. The lower right panel shows the branch, which GBM cells in PTB first emerged. (C) Heatmap showing the expression scores for pan-cancer signatures. Cells are categorized into three broad groups: astrocyte in PTB (Astro), PTB_G, and TC_G. (D) Scatter diagram of the differential genes up-regulated in PTB_G and TC_G compared with Astro. (E) Bar plot of the GO terms (biological processes) enriched by genes that were both up-regulated in PTB_G and TC_G. Color of the bar plot corresponds to (D). (F) Scatter plot of differential genes between PTB_G and TC_G. (G) Bar plot of the GO terms (biological processes) separately enriched in TC_G (left) and PTB_G (right). Color of the bar plot denotes the cluster assignment, corresponding to (F).
Fig. 4.
Fig. 4.. GBM cells in four cellular states share the regulator AP-1.
(A) Two-dimensional representation of cellular states for PTB_G (top) and TC_G (bottom). The exact position of dots (GBM cells) reflects their relative scores for each cellular state signatures, and dots are colored by corresponding states. (B) Pie charts showing the proportions of GBM cells in four cellular states in each sample. The color corresponds to that in (A). (C) Percentages of AC, MES, NPC, and OPC GBM cells in patient-matched TC and PTB. P value from paired t test. (D) Scatter plots of overrepresented TF motifs in four cellular states inferred from snATAC-seq. The top 50 TFs are colored by corresponding states, same as (A). (E) Venn plots showing the intersection of motifs enriched in each cellular state based on snATAC-seq (left) and the intersection of regulons in each cellular state based on snRNA-seq (right). (F) Genome track visualization of loci for CDCP1 and TCIM. GBM cells with four cellular states and astrocytes from PTB are included. Inferred peak-to-gene links across the GBM dataset are shown in the middle, and ChIP-seq tracks for JUN and H3K27ac are shown bottom.
Fig. 5.
Fig. 5.. The altered regulation of GBM cells in the PTB.
(A) Violin plots of AP-1 regulons scoring in three groups, including Astro, PTB_G, and TC_G. (B) Violin diagrams showing the regulons with higher activity in PTB_G compared with Astro. (C) UMAP plots showing GBM cell populations (i.e., GS1, GS2, GS3, and GS4). The top panel shows the subclusters of GBM cells, and the bottom panel highlights the GBM cells from PTB in pink. (D) UMAP diagrams of the activation of AP-1 (left) and BACH1 (right) regulons in GBM cells. (E) Bar plot showing the fraction of cells with activated regulon for AP-1 or combination with other candidate regulons. (F) Heatmap showing the expression of candidate TFs in three groups. (G) Genome track visualization of locus for BACH1 in three groups. Inferred peak-to-gene links across the three groups are shown in the middle, and ChIP-seq track for H3K27ac is shown bottom. (H) UMAP showing the activation status for AP-1 and BACH1 regulons in GBM cells. (I) Bar plot showing the number of GBM cells with different activation status. (J) Monocle trajectory for GBM cells from the two regions in RM04, colored by the origin tissues. (K) Scatter plot for selected regulon scores along the PTB_G branch. The scores were averaged for cells in each of the 50 trajectory bins. Solid lines represent loess regressions for the regulon. (L) Scatter plots showing module scores of selected GO terms along the two branches. ****P < 0.0001.
Fig. 6.
Fig. 6.. Combination therapy suppresses tumor growth and improves survival in GBM mouse models.
(A) Quantification of BrdU incorporation, colony-formation, flow cytometry, and transwell migration assays of the indicated groups of U251 cells. Cells with or without BACH1 depletion were treated with or without ulixertinib (1 μM). Data represent the means ± SD from three independent assays. (B) Illustration depicting the therapy schedule. U251 cells (with or without BACH1 depletion) were intracranially injected into nude mice on day 0. Treatment started on day 14, with or without ulixertinib (80 mg/kg) orally twice daily (every 12 hours) for 5 days (n = 7 for each group). (C) Kaplan-Meier survival curves of the indicated groups of mice in (B). [(D) and (E)] Representative hematoxylin and eosin staining (D) and immunohistochemistry (E) images of U251-derived tumors of mice in (B). Scale bars were indicated in the plots. (F) Schematic representation of the treatment strategy. Luciferase-expressing GL261 cells were intracranially implanted in C57BL/6 mice on day 0. Treatment started on day 12 with hemin (50 mg/kg, every 12 hours) or (80 mg/kg, every 24 hours) or in combination for 5 days (n = 7 for each group). (G) Luminescence intensity showing tumors in representative mice over time. (H) Quantitative radiance in the experimental group on day 21. (I) The survival time of the indicated groups of mice in (F). *P < 0.05, **P < 0.01, ***P < 0.001, and ****P < 0.0001.
Fig. 7.
Fig. 7.. Scheme explaining the altered characteristics of infiltrated GBM cells lurked in PTB.
AC, astrocyte; ODC, oligodendrocyte; IN, inhibitory neuron; EN, excitatory neuron; MC, myeloid; TC, T cell; ETC, endothelial cell; PC, pericyte.

References

    1. Price M., Neff C., Nagarajan N., Kruchko C., Waite K. A., Cioffi G., Cordeiro B. B., Willmarth N., Penas-Prado M., Gilbert M. R., Armstrong T. S., Barnholtz-Sloan J. S., Ostrom Q. T., CBTRUS statistical report: Primary brain and other central nervous system tumors diagnosed in the United States in 2016-2020. Neuro Oncol. 26, iii1–iii53 (2024). - PMC - PubMed
    1. Stupp R., Mason W. P., Van Den Bent M. J., Weller M., Fisher B., Taphoorn M. J. B., Belanger K., Brandes A. A., Marosi C., Bogdahn U., Curschmann J., Janzer R. C., Ludwin S. K., Gorlia T., Allgeier A., Lacombe D., Cairncross J. G., Eisenhauer E., Mirimanoff R. O.; European Organisation for Research and Treatment of Cancer Brain Tumor and Radiotherapy Groups; National Cancer Institute of Canada Clinical Trials Group , Radiotherapy plus concomitant and adjuvant temozolomide for glioblastoma. N. Engl. J. Med. 352, 987–996 (2005). - PubMed
    1. van Solinge T. S., Nieland L., Chiocca E. A., Broekman M. L. D., Advances in local therapy for glioblastoma - taking the fight to the tumour. Nat. Rev. Neurol. 18, 221–236 (2022). - PMC - PubMed
    1. Milano M. T., Okunieff P., Donatello R. S., Mohile N. A., Sul J., Walter K. A., Korones D. N., Patterns and timing of recurrence after temozolomide-based chemoradiation for glioblastoma. Int. J. Radiat. Oncol. Biol. Phys. 78, 1147–1155 (2010). - PubMed
    1. Kallenberg K., Goldmann T., Menke J., Strik H., Bock H. C., Stockhammer F., Buhk J. H., Frahm J., Dechent P., Knauth M., Glioma infiltration of the corpus callosum: early signs detected by DTI. J. Neurooncol. 112, 217–222 (2013). - PMC - PubMed

Publication types

MeSH terms

Substances