. 2024 Nov 22;10(47):eadq6150.
doi: 10.1126/sciadv.adq6150. Epub 2024 Nov 22.

Structural characterization and AlphaFold modeling of human T cell receptor recognition of NRAS cancer neoantigens

Affiliations

Structural characterization and AlphaFold modeling of human T cell receptor recognition of NRAS cancer neoantigens

Daichao Wu et al. Sci Adv. .

Abstract

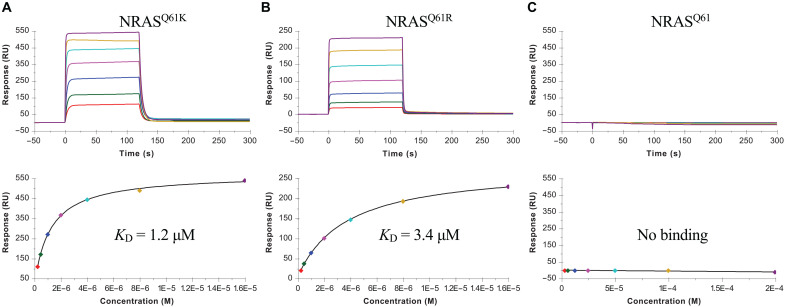
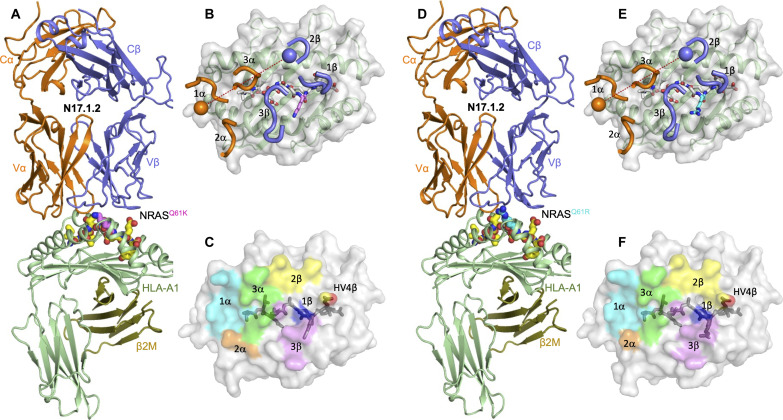
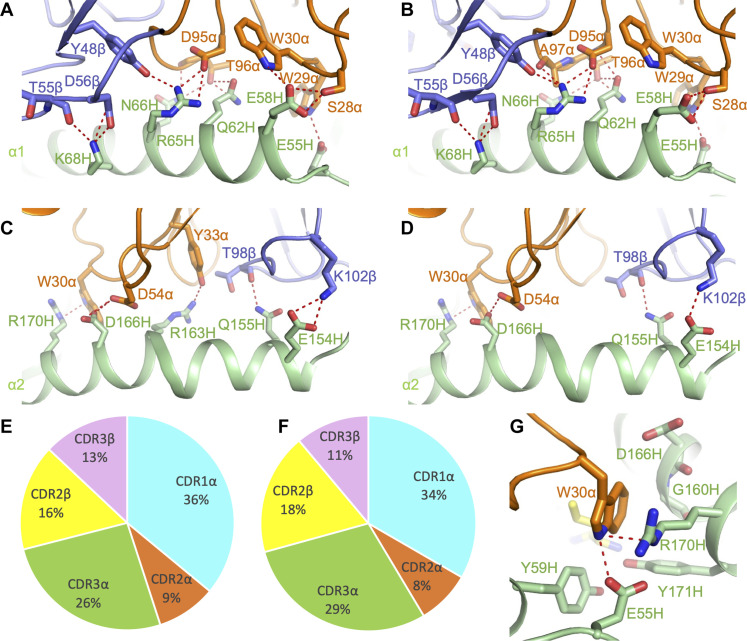
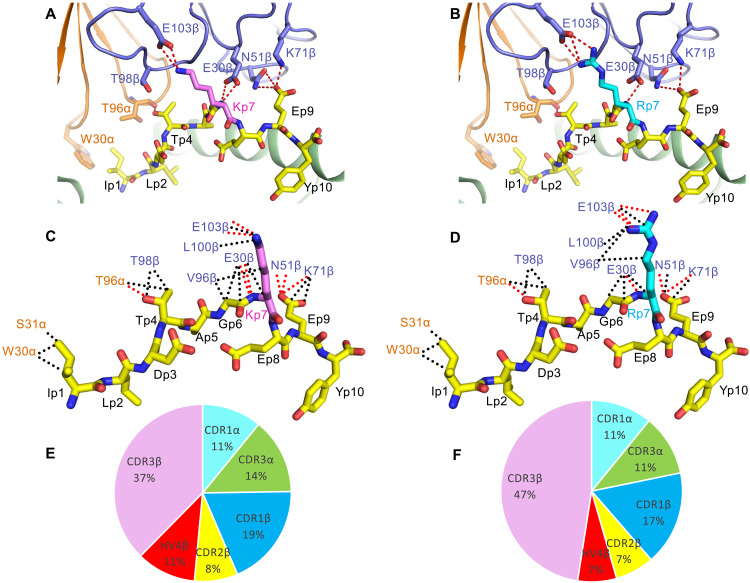
T cell receptors (TCRs) that recognize cancer neoantigens are important for anticancer immune responses and immunotherapy. Understanding the structural basis of TCR recognition of neoantigens provides insights into their exquisite specificity and can enable design of optimized TCRs. We determined crystal structures of a human TCR in complex with NRAS Q61K and Q61R neoantigen peptides and HLA-A1 major histocompatibility complex (MHC), revealing the molecular underpinnings for dual recognition and specificity versus wild-type NRAS peptide. We then used multiple versions of AlphaFold to model the corresponding complex structures, given the challenge of immune recognition for such methods. One implementation of AlphaFold2 (TCRmodel2) with additional sampling was able to generate accurate models of the complexes, while AlphaFold3 also showed strong performance, although success was lower for other complexes. This study provides insights into TCR recognition of a shared cancer neoantigen as well as the utility and practical considerations for using AlphaFold to model TCR-peptide-MHC complexes.


Figures

Fig. 1.
Fig. 1.. SPR analysis of TCR N17.1.2 binding to NRASQ61K–HLA-A1, NRASQ61R–HLA-A1, and NRAS–HLA-A1.
(A) (Top) TCR N17.1.2 at concentrations of 0.25, 0.5, 1, 2, 4, 8, and 16 μM was injected over immobilized NRASQ61K–HLA-A1 (1000 RU). (Bottom) Fitting curve for equilibrium binding that resulted in a KD of 1.2 ± 0.1 μM. (B) (Top) TCR N17.1.2 at concentrations of 0.25, 0.5, 1, 2, 4, 8, and 16 μM was injected over immobilized NRASQ61R–HLA-A1. (Bottom) Fitting curve for equilibrium binding that resulted in a KD of 3.4 ± 0.2 μM. (C) (Top) TCR N17.1.2 at concentrations of 3.12, 6.25, 12.5, 25.5, 50, 100, and 200 μM was injected over immobilized NRASQ61–HLA-A1. (Bottom) Fitting curve for equilibrium binding that showed no interaction.
Fig. 2.
Fig. 2.. Structure of TCR N17.1.2 in complex with NRAS neoantigens.
(A) Side view of the TCR N17.1.2–NRASQ61K–HLA-A1 complex. (B) Positions of CDR loops of TCR N17.1.2 on NRASQ61K–HLA-A1 (top view). CDRs of N17.1.2 are shown as numbered brown (CDR1α, CDR2α, and CDR3α) or blue (CDR1β, CDR2β, and CDR3β) loops. HLA-A1 is depicted as a gray surface and green cartoon. The NRASQ61K peptide is drawn in yellow in stick representation with the mutated P7 Lys residue in violet. The brown and blue spheres mark the positions of the conserved intrachain disulfide of the Vα and Vβ domains, respectively. The red dashed line indicates the crossing angle of TCR to pMHC. (C) Footprint of TCR N17.1.2 on NRASQ61K–HLA-A1. The top of the MHC molecule is depicted as a gray surface. The areas contacted by individual CDR loops are color coded: CDR1α, cyan; CDR2α, brown; CDR3α, green; CDR1β, blue; CDR2β, yellow; HV4β, red; CDR3β, violet. (D) Side view of the TCR N17.1.2–NRASQ61R–HLA-A1 complex. (E) Positions of CDR loops of TCR N17.1.2 on NRASQ61R–HLA-A1 (top view). The NRASQ61R peptide is drawn in yellow in stick representation with the mutated P7 Arg residue in cyan. (F) Footprint of TCR N17.1.2 on NRASQ61R–HLA-A1.
Fig. 3.
Fig. 3.. Interactions of TCR N17.1.2 with HLA-A1.
(A) Interactions between N17.1.2 and the HLA-A1 α1 helix in the N17.1.2–NRASQ61K–HLA-A1 complex. The side chains of contacting residues are drawn in stick representation with carbon atoms in brown (TCR α chain), blue (TCR β chain), or green (HLA-A1). Hydrogen bonds are indicated by red dashed lines. (B) Interactions between N17.1.2 and the HLA-A1 α1 helix in the N17.1.2–NRASQ61R–HLA-A1 complex. (C) Interactions between N17.1.2 and the HLA-A1 α2 helix in the N17.1.2–NRASQ61K–HLA-A1 complex. (D) Interactions between N17.1.2 and the HLA-A1 α2 helix in the N17.1.2–NRASQ61R–HLA-A1 complex. (E) Pie chart showing the percentage distribution of TCR N17.1.2 contacts to HLA-A1 according to CDR in the N17.1.2–NRASQ61K–HLA-A1 complex. (F) Pie chart showing the percentage distribution of TCR N17.1.2 contacts to HLA-A1 according to CDR in the N17.1.2–NRASQ61R–HLA-A1 complex. (G) Close up view of interactions between Trp30α of N17.1.2 and Arg170H of HLA-A1.
Fig. 4.
Fig. 4.. Interactions of TCR N17.1.2 with NRAS neoantigens.
(A) Interactions between N17.1.2 and the NRASQ61K peptide. The side chains of contacting residues are shown in stick representation with carbon atoms in brown (TCR α chain), blue (TCR β chain), yellow (NRASQ61K), or violet (mutated P7 Lys). Peptide residues are identified by one-letter amino acid designation followed by position (p) number. Hydrogen bonds are indicated by red dashed lines. (B) Interactions between N17.1.2 and the NRASQ61R peptide. The mutated P7 Arg residue is shown in cyan. (C) Schematic representation of N17.1.2–NRASQ61K interactions. Hydrogen bonds are red dotted lines, and van der Waals contacts are black dotted lines. For clarity, not all van der Waals contacts are shown. (D) Schematic representation of N17.1.2–NRASQ61R interactions. (E) Pie chart showing the percentage distribution of TCR N17.1.2 contacts to NRASQ61K according to CDR. (F) Pie chart showing the percentage distribution of TCR N17.1.2 contacts to NRASQ61R according to CDR.
Fig. 5.
Fig. 5.. Comparison of AlphaFold prediction of the TCR N17.1.2–NRASQ61K–HLA-A1 complex generated by TCRmodel2 with crystallographic density map and structures.
(A) AlphaFold prediction of the N17.1.2–NRASQ61K–HLA-A1 complex compared with the experimental electron density map in the region of CDR3α (Vα, orange; Vβ, blue; NRASQ61K peptide, yellow; HLA-A1, green). (B) AlphaFold prediction of the N17.1.2–NRASQ61K–HLA-A1 complex compared with the electron density map in the region of CDR3β. (C) Model of the N17.1.2–NRASQ61K–HLA-A1 complex built into the electron density map in the region of CDR3α (Vα, orange; Vβ, blue; NRASQ61K peptide, yellow; HLA-A1, green). (D) Model of the N17.1.2–NRASQ61K–HLA-A1 complex built into the electron density map in the region of CDR3β.

Update of

References

    1. Rosenberg S. A., Restifo N. P., Adoptive cell transfer as personalized immunotherapy for human cancer. Science 348, 62–68 (2015). - PMC - PubMed
    1. Tran E., Robbins P. F., Lu Y. C., Prickett T. D., Gartner J. J., Jia L., Pasetto A., Zheng Z., Ray S., Groh E. M., Kriley I. R., Rosenberg S. A., T-cell transfer therapy targeting mutant KRAS in cancer. N. Engl. J. Med. 375, 2255–2262 (2016). - PMC - PubMed
    1. Zacharakis N., Chinnasamy H., Black M., Xu H., Lu Y. C., Zheng Z., Pasetto A., Langhan M., Shelton T., Prickett T., Gartner J., Jia L., Trebska-McGowan K., Somerville R. P., Robbins P. F., Rosenberg S. A., Goff S. L., Feldman S. A., Immune recognition of somatic mutations leading to complete durable regression in metastatic breast cancer. Nat. Med. 24, 724–730 (2018). - PMC - PubMed
    1. Stevanovic S., Pasetto A., Helman S. R., Gartner J. J., Prickett T. D., Howie B., Robins H. S., Robbins P. F., Klebanoff C. A., Rosenberg S. A., Hinrichs C. S., Landscape of immunogenic tumor antigens in successful immunotherapy of virally induced epithelial cancer. Science 356, 200–205 (2017). - PMC - PubMed
    1. Tran E., Turcotte S., Gros A., Robbins P. F., Lu Y. C., Dudley M. E., Wunderlich J. R., Somerville R. P., Hogan K., Hinrichs C. S., Parkhurst M. R., Yang J. C., Rosenberg S. A., Cancer immunotherapy based on mutation-specific CD4+ T cells in a patient with epithelial cancer. Science 344, 641–645 (2014). - PMC - PubMed

MeSH terms