. 2024 Nov 22;10(47):eadq9793.
doi: 10.1126/sciadv.adq9793. Epub 2024 Nov 22.

Monoamine transporter ubiquitination and inward-open conformation synergistically maximize transporter endocytosis

Affiliations

Monoamine transporter ubiquitination and inward-open conformation synergistically maximize transporter endocytosis

Tatiana Sorkina et al. Sci Adv. .

Abstract

Monoamine transporters function in neuronal membranes to control extracellular concentrations of their substrates. Cell-surface expression of transporters is regulated by substrates and intracellular signaling, but the underlying mechanisms remain unclear. Here, we found that substrates of the dopamine transporter (DAT), amphetamine and dopamine, synergize with protein kinase C (PKC)-dependent DAT ubiquitination to markedly elevate clathrin-mediated endocytosis of DAT, which is accompanied by DAT movement out of plasma membrane protrusions with a negative curvature. Disruption of the outward-open (OO) DAT conformation or its stabilization in the inward-open (IO) conformation recapitulates substrate effects on DAT endocytosis. Amphetamine strongly increases PKC-dependent endocytosis of norepinephrine transporter (NET) but not of serotonin transporter (SERT), correlating with a substantially weaker ubiquitination of SERT compared to NET. We propose a "shape-transition" model whereby shifting from convex-shaped OO conformers to IO conformers minimizes retention of transporters in negatively curved membranes, which facilitates their PKC-dependent ubiquitination and recruitment to positively invaginated clathrin-coated membranes, driving robust transporter endocytosis.


Figures

Fig. 1.
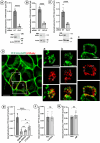
Fig. 1.. PMA and Amph synergize in promoting strong YFP-HA-DAT endocytosis in HEK293a cells.
(A) Cells preincubated with HA11 antibodies were incubated with vehicle [dimethyl sulfoxide (DMSO)], PMA (1 μM), Amph (50 μM), or PMA and Amph together (same concentrations) for 1 hour at 37°C. After fixation, cultures were stained with Cy5- and Cy3-conjugated anti-mouse antibodies before (surface YFP-HA-DAT, green) and after permeabilization (internalized YFP-HA-DAT, red), respectively. Nuclei were stained with 4′,6-diamidino-2-phenylindole (DAPI, blue). Maximum intensity projections (MIPs) of z stacks of x-y planes are presented. Scale bars, 10 μm. (B) Cells preincubated with HA11 antibodies were incubated with vehicle, PMA, Amph, or PMA and Amph together as in (A) for indicated times. Cy3/Cy5 ratios were calculated from 3D images exemplified in (A). Mean values of the ratio (SEM, n = 3 to 4) are presented. **P < 0.01; ****P < 0.0001 (t tests for “PMA” versus “PMA/Amph” at each time point). Open circles (PMA + Amph) represent the sum of mean values of the Cy3/Cy5 ratio in cells treated with PMA and Amph alone. (C) Cells preincubated with HA11 antibodies were incubated with vehicle, PMA, Amph, or PMA and Amph together for 40 min as in (A). Mean values of the Cy3/Cy5 ratio normalized to the mean ratio value in cells treated with PMA alone (SD, n = 5 to 10) are presented. ****P < 0.0001; **P < 0.01; *P < 0.05 [analysis of variance (ANOVA)]. (D) Cells were incubated with vehicle, PMA, Amph, or PMA and Amph together for 40 min at 37°C, and the cell-surface biotinylation assay was performed. Aliquots of lysates and Neutroavidin (NeuAv) pulldowns were electrophoresed and probed by immunoblotting with DAT antibodies. m-YFP-HA-DAT and im-YFP-HA-DAT are mature and immature YFP-HA-DAT, respectively. (E) The ratios of biotinylated (NeuAv pulldown) to total YFP-HA-DAT (lysates) from three experiments exemplified in (D) were normalized to the values of the ratio in vehicle-treated cells in each experiment. **P < 0.01 and ***P < 0.001 are against PMA (ANOVA).
Fig. 2.
Fig. 2.. Redistribution within the plasma membrane and endocytosis of YFP-HA-DAT induced by PMA and Amph observed by live-cell imaging of HEK293a cells.
(A) Cells were incubated with vehicle (DMSO and water), PMA (1 μM), Amph (50 μM), or with PMA plus Amph at the same concentrations for 30 min at 37°C. Z-stacks of 60 x-y confocal images (150-nm steps) were acquired through the 515-nm channel at room temperature. MIP images of the three xy confocal planes from the bottom (ventral) membranes of the cell (“Bottom”), middle of the cell (“Middle”, eight planes from the bottom plane), and MIP images of top 10 x-y planes (“Top”) are presented. Intensity scales are identical for all treatment variants. Arrows show examples of filopodia. Arrowheads show examples of lamellipodia. Scale bars, 10 μm. Insets on the right are enlarged high-contrast images of regions indicated by white rectangles on bottom (B) and top (T) images. (B) YFP-HA-DAT concentrations in ventral filopodia in vehicle- and Amph-treated cells were calculated in Bottom images exemplified in (A). Bar graphs represent mean intensities of YFP fluorescence of individual filopodia. A.l.u.f.i., arbitrary linear units of fluorescence intensity. T test, ****P < 0.0001. (C) Cells were treated with PMA or PMA plus Amph as in (A) for 30 min at 37°C and then incubated with CellMask DeepRed followed by immediate live-cell 3D imaging through 488-nm (YFP-HA-DAT, green) and 640-nm (red, CellMask DeepRed) channels at room temperature. Examples of images are presented in fig. S5. The fraction of YFP-HA-DAT enriched in membrane protrusions and cell edges of the total plasma membrane YFP-HA-DAT was quantitated in 3D images as described in Materials and Methods. Mean values with SDs are presented in the bar graph. T test, ****P < 0.0001.
Fig. 3.
Fig. 3.. Internalization of YFP-HA-DAT in HEK293a cells stimulated by the PMA/Amph combination is through CME and requires the activity of conventional PKCs.
(A to C) The cells were transfected with nontargeting siRNA or siRNAs targeting CHC, μ2 subunit of AP2 (AP2μ2) or dynamin-2 (Dyn2). The cells preincubated with HA11 were incubated with PMA plus Amph for 40 (A), 30 (B), and 60 min (C), and the HA11 antibody uptake assay was performed as in Fig. 1. ****P < 0.0001 (T tests). The knockdown efficiency is shown by immunoblotting with CHC, α subunit of AP-2 (AP2α2) and Dyn2 antibodies. (D) Cells transiently expressing β2-Ruby were incubated with 1 μM PMA/50 μM Amph for 10 min at 37°C, and 3D imaging was performed at room temperature. Large image represents a merge of the fluorescence through 515 nm (YFP) and 561 nm (Ruby) channels and is the MIP of two confocal planes through the middle of the z stack before deconvolution. Scale bar, 10 μm. Insets correspond to regions indicated by white rectangles after image deconvolution using Microvolution. a, plane from the top of the cell; c, plane 11; and b, plane 8 (closer to the top of the cell) from the dorsal membrane of the cells. Examples of YFP-HA-DAT localization in coated pits are shown by white circles. Scale bars (insets), 5 μm. (E to G) The cells preincubated with HA11 antibodies were incubated with vehicles (15 to 30 min), 1 μM Gö6976 [(E) 15 min], 1 μM Ro-3200432 [(E) 15 min], 1 μM LY333531 [(E) 15 min], 3 μM Y-27632 [(F) 30 min], or 0.5 μM AIP [(G) 15 min], followed by incubation with second vehicles (DMSO/H2O) or the PMA/Amph combination for 30 min in the presence of the first vehicle or inhibitors. Bar graphs represent mean values of the Cy3/Cy5 ratios with SDs (ANOVA). ****P < 0.0001, *P < 0.05. ns, not significant.
Fig. 4.
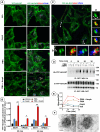
Fig. 4.. YFP-HA-DAT internalized after PMA/Amph stimulation is ubiquitinated and traffics through the endosomal pathway characteristic of an ubiquitinated cargo.
(A) Cells were incubated with vehicle, PMA, Amph, or PMA and Amph for 20 and 40 min at 37°C; fixed; and immunostained with antibodies to EEA1 and VPS35. 3D imaging was performed through 488-nm (YFP-HA-DAT, green), 561-nm (EEA1, red), and 640-nm (VPS35, blue) channels. MIPs of three x-y confocal planes (40-min time point) through the middle of the z stack are shown. Scale bars, 10 μm. (B) The fraction of YFP-HA-DAT colocalized with EEA1 or VPS35 was quantitated in experiments exemplified in (A) after YFP images were deconvolved using iterative constrain algorithm. Mean values with SDs are presented. P values for PMA/Amph against PMA were calculated using ANOVA (n = 3). *P < 0.05; **P < 0.01. (C) Cells treated with the PMA/Amph combination for 40 min [experiment presented in (A)] were imaged in super-resolution SoRa mode followed by deconvolution using Microvolution. Full merge-channel image is an MIP of the z stack of 15 x-y planes. Insets below and on the right show examples of the split-channel 3D volume views (6× z interpolation and rotation for better visualization) of two endosomes marked by arrows on the full image. (D) Cells were incubated with vehicle, PMA, Amph, or the PMA/Amph combination for indicated times at 37°C, lysed, and YFP-HA-DAT was immunoprecipitated using green fluorescent protein (GFP) antibodies. Immunoprecipitates were electrophoresed, and ubiquitin and YFP-HA-DAT were detected by immunoblotting. mYFP-HA-YFP, mature transporter. (E) Quantification of the ratio of ubiquitinated to total YFP-HA-DAT (arbitrary units). (F) Examples of YFP-HA-DAT accumulation in intralumental vesicles of MVEs. Cells were incubated with PMA and Amph for 2 hours at 37°C in the presence of leupeptin, fixed, and processed for cryoEM immunogold staining with GFP antibodies. Scale bars, 500 nm.
Fig. 5.
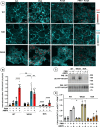
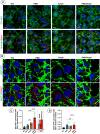
Fig. 5.. DA synergizes with PMA in stimulating strong YFP-HA-DAT endocytosis.
(A) Cells preincubated with the HA11 antibody were incubated with vehicle, PMA (1 μM), DA (50 μM), or PMA and DA together (same concentrations) for 40 min at 37°C. After fixation, cultures were stained with secondary Cy5- and Cy3-conjugated anti-mouse antibody before (surface YFP-HA-DAT, cyan) and after permeabilization (internalized YFP-HA-DAT, red), respectively. MIPs of 3D images are presented. Scale bar, 10 μm. Intensity scales are identical for all images. (B) Cells preincubated with HA11 antibody were incubated with vehicle, PMA, Amph (50 μM), DA (1 to 50 μM), PMA/Amph, or PMA/DA combinations for 40 min and imaged as in (A). Cy3/Cy5 ratios were calculated from images exemplified in (A) and plotted as the fraction of the mean value of the ratio in cells treated with PMA alone in each experiment. Results are presented as mean values of the normalized ratio (SD, n = 5 to 15). ****P < 0.0001, *P < 0.05 (ANOVA). (C) Cells were incubated with PMA and DA (50 μM) together for 0 to 40 min at 37°C. Z stacks of 40 x-y confocal images were acquired from live cells through the 515-nm channel. Individual confocal sections from the bottom of the cell (bottom, ventral membrane) and middle section (Middle, maximum number of endosomes) of the z stack of images are presented. Scale bars, 10 μm. Intensity scales are identical within the same section type. Arrows show examples of filopodia. Arrowheads show examples of lamellipodia. (D) Cells were 3D-imaged before and during incubation with 50 μM DA. MIPs of two consecutive x-y ventral membrane planes before and 20-min after the start of DA treatment are shown in quantitative pseudocolor. Intensity scales are identical. Arrows show examples of filopodia.
Fig. 6.
Fig. 6.. Mutational disruption of the OO conformation of DAT recapitulates Amph-induced acceleration of PMA-induced, ubiquitination-dependent DAT endocytosis.
(A) Cells expressing wild-type (WT), N3K and W63A YFP-HA-DAT mutants were incubated with the HA11 antibody, and then incubated with vehicle (DMSO), PMA (1 μM), Amph (50 μM), or with PMA-Amph together (same concentrations) for 40 min at 37°C. After fixation, cultures were stained with secondary Cy5-conjugated anti-mouse antibodies (surface YFP-HA-DAT), permeabilized with Triton X-100 and stained with secondary Cy3-conjugated anti-mouse antibody (internalized YFP-HA-DAT). 3D images were acquired through 561-nm (Cy3, red) and 640-nm (Cy5, cyan) channels. Maximum intensity projections of 3D images are presented. Scale bar, 10 μm. Intensity scales are shown on the right. (B) Quantification of the Cy3/C5 ratio from images exemplified in (A). The ratio value for each FOV was normalized by the mean value of the ratio in wild-type–expressing cells treated with the PMA/Amph combination in each of three independent experiments. ****P < 0.0001; ns, not significant (one-way ANOVA). (C) Cells expressing wild-type, N3K, or W63A YFP-HA-DAT mutants were incubated with vehicle, PMA, Amph, or PMA and Amph for 40 min at 37°C and lysed, and YFP-HA-DAT was immunoprecipitated using GFP antibody. Immunoprecipitates were resolved by SDS–polyacrylamide gel electrophoresis (SDS-PAGE) and probed for ubiquitin and YFP-HA-DAT by immunoblotting. m-YFP-HA-YFP, mature transporter. (D) Quantification of the ratio of ubiquitinated to total YFP-HA-DAT (arbitrary units). Graph bar represents mean values of ubiquitin/DAT ratio (arbitrary units) normalized to the value of this ratio in wild-type–expressing cells treated with PMA in each of three independent experiments. *P < 0.05 (one-way ANOVA).
Fig. 7.
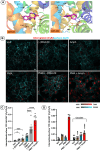
Fig. 7.. (−)DG4-69 enhances PMA-induced DAT endocytosis, whereas cocaine inhibits endocytosis accelerating effect of Amph.
(A) Docking-predicted (−)DG4-69 binding to DAT inward-facing open (IO) conformer and DAT outward-facing open (OO) conformer. The computed binding affinity of (−)DG4-69 (purple sticks) to the DAT-IO and DAT-OO are −10.0 ± 0.3 and −8.7 ± 0.3 kcal/mol. The higher affinity binding of (−)DG4-69 to the IO conformer is mainly due to its close interactions with F320 and F326. (B) YFP-HA-DAT expressing cells preincubated with HA11 antibodies were incubated with vehicle, PMA (1 μM), Amph (50 μM), (−)DG4-69 (20 μM), or with the combination of PMA and Amph or PMA and (−)DG4-69 (same concentrations) for 60 min at 37°C. After fixation, cultures were stained with secondary Cy5- and Cy3-conjugated anti-mouse antibodies before (surface YFP-HA-DAT, cyan) and after permeabilization (internalized YFP-HA-DAT, red), respectively. MIPs of 3D images are presented. Scale bar, 10 μm. Intensity scales are shown below images. (C) Quantification of the Cy3/C5 ratio from images exemplified in (A). Mean values with SDs are presented. ****P < 0.0001, ***P < 0.001; *P < 0.05 (ANOVA). (D) YFP-HA-DAT–expressing cells were incubated with HA11 antibodies for 30 min at 37°C and then preincubated with vehicle (H2O) or cocaine (100 μM) for 15 min followed incubation with vehicle (DMSO), PMA (1 μM), Amph (50 μM), or combination of PMA-Amph (same concentrations) for 60 min at 37°C. Cocaine was present during the incubation of cells preincubated with cocaine. After fixation, cultures were stained with secondary Cy5- and Cy3-conjugated anti-mouse antibodies before (surface YFP-HA-DAT) and after permeabilization (internalized YFP-HA-DAT), respectively. 3D images were acquired as in (A), and Cy3/Cy5 ratios were calculated as in (C). Mean values with SDs are presented. P values are “cocaine-treated” against “not treated with cocaine” of the same vehicle/PMA/Amph treatment variants. ****P < 0.0001, ***P < 0.001 (ANOVA).
Fig. 8.
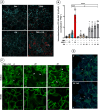
Fig. 8.. Amph synergizes with PKC activation in promoting strong endocytosis of GFP-NET but not of SERT-YFP.
(A) HEK293a/GFP-NET cells were incubated with vehicle, PMA, Amph, or PMA plus Amph (concentrations as in Fig. 1A) for 30 min at 37°C; fixed; and immunostained with EEA1 antibodies. 3D imaging was performed through 488-nm (GFP, green), 561-nm (EEA1, red), and 405-nm (DAPI, blue) channels. GFP images were deconvolved using iterative constrain algorithm. MIPs of z stack of images are presented. Scale bars, 10 μm. (B) HEK293a/SERT-YFP cells were incubated with vehicle, PMA, Amph, or PMA plus Amph for 40 min at 37°C as in (A); fixed; and immunostained with EEA1 antibodies. 3D imaging was performed through 488-nm (YFP, green), 561-nm (EEA1, red), and 405-nm (DAPI, blue) channels. YFP images (488 nm) were deconvolved using iterative constrain algorithm. Single confocal planes through the middle of z stack are presented. Intensity scales are identical. Arrows show examples of SERT-YFP localization in EEA1-labeled endosomes. SERT-YFP images are overexposed to enable visualization of the weak endosomal fluorescence of SERT-YFP in cells treated with PMA/Amph. Scale bars, 10 μm. (C) The fraction of GFP-NET colocalized with EEA1 was quantitated in experiments exemplified in (A). Mean values with SDs are presented. ****P < 0.0001 (ANOVA). “−Veh” bars on the right indicated by the rectangle represent the sum of the mean values of the fraction of GFP-NET colocalized with EEA1 in cells treated with PMA alone and Amph alone (PMA + Amph) versus in cells treated with the PMA/Amph combination (PMA/Amph, red) after subtraction of the mean value of the colocalization fraction in vehicle-treated cells. (D) The fraction of SERT-YFP colocalized with EEA1 was quantitated in experiments exemplified in (B). Mean values with SDs are presented. The data are representative of three independent experiments. ****P < 0.0001; *P < 0.05 (ANOVA).
Fig. 9.
Fig. 9.. Amph synergizes with PKC activation in promoting strong endocytosis and ubiquitination of GFP-NET but not of SERT-YFP.
(A) HEK293a cells expressing indicated monoamine transporters (MaT) were incubated with vehicle, PMA, Amph, or PMA and Amph for 40 min at 37°C, and subjected to surface biotinylation. Neutroavidin (NeuAv) pulldowns and aliquots of lysates were electrophoresed and probed by Western blotting with GFP antibodies. M-MaT and im-MaT, mature and immature transporters, respectively. Parental HEK293a cells were lysed and processed in the same manner as MaT-expressing cells. (B) Quantification of the ratio of biotinylated to total MaT detected in lysates. Ratio values are normalized to the value of the ratio in cells treated with vehicle (“−” PMA/“−”Amph). Mean ratio values from four independent experiments are presented. ***P < 0.001, **P < 0.01 (one-way ANOVA). (C) HEK293a cells were incubated with vehicle, PMA, Amph, or PMA plus Amph for 30 min at 37°C and lysed, and YFP-HA-DAT, GFP-NET, and SERT-GFP were immunoprecipitated using GFP antibody. Immunoprecipitates were resolved by SDS-PAGE, and ubiquitin and GFP/YFP were detected by immunoblotting. m-MaT, mature transporter; im-MaT, immature transporter. (D) Quantification of the ratio of ubiquitinated to total m-MaT in three independent experiments shown in (C) (arbitrary units). Ratios were normalized to the ratio value in the PMA variant in each experiment. *P < 0.05 (one-way ANOVA).
Fig. 10.
Fig. 10.. Hypothetic model of Amph action on PMA-induced endocytosis of DAT and NET.
A large pool of transporters is present in the OO conformation (convex shape of the molecule) in the absence of Amph (or DA) and concentrated in membranes with negative curvature, especially in filopodia. Filopodia lack clathrin-coated pits. PMA activates PKC and induces NEDD4L-mediated ubiquitination of a fraction of transporters within the entire plasma membrane, but a large pool of ubiquitinated transporters in OO fold is incapable of entering clathrin-coated pits. Amph (and DA) increase the probability of the IO conformation, which leads to redistribution of IO-folded ubiquitinated and non-ubiquitinated transporters throughout the plasma membrane, thus increasing a pool of ubiquitinated transporters capable of recruitment into clathrin-coated pits. Transition from OO to IO conformations also increases a pool of ubiquitinated transporters. Cocaine binds to OO conformers of DAT and NET, blocks transport of substrates, and stabilizes the OO conformation, maintaining accumulation of transporters in filopodia and other negatively curved membrane subdomains. Endocytosed transporters are sorted to MVEs where they are deubiquitinated before incorporation into intraluminal vesicles.

References

    1. Kristensen A. S., Andersen J., Jorgensen T. N., Sorensen L., Eriksen J., Loland C. J., Stromgaard K., Gether U., SLC6 neurotransmitter transporters: Structure, function, and regulation. Pharm. Rev. 63, 585–640 (2011). - PubMed
    1. Ng J., Papandreou A., Heales S. J., Kurian M. A., Monoamine neurotransmitter disorders—clinical advances and future perspectives. Nat. Rev. Neurol. 11, 567–584 (2015). - PubMed
    1. Pertovaara A., Noradrenergic pain modulation. Prog. Neurobiol. 80, 53–83 (2006). - PubMed
    1. Pignatelli M., Bonci A., Role of dopamine neurons in reward and aversion: A synaptic plasticity perspective. Neuron 86, 1145–1157 (2015). - PubMed
    1. Yildiz O., Smith J. R., Purdy R. E., Serotonin and vasoconstrictor synergism. Life Sci. 62, 1723–1732 (1998). - PubMed

MeSH terms

Substances

LinkOut - more resources