. 2024:44:103708.
doi: 10.1016/j.nicl.2024.103708. Epub 2024 Nov 14.

Brain magnetic resonance imaging of patients with spinal muscular atrophy type 2 and 3

Affiliations

Brain magnetic resonance imaging of patients with spinal muscular atrophy type 2 and 3

Marloes Stam et al. Neuroimage Clin. 2024.

Abstract

Background and objective: Proximal spinal muscular atrophy (SMA) is caused by deficiency of the ubiquitously expressed survival motor neuron protein. Although primarily a hereditary lower motor neuron disease, it is probably also characterized by abnormalities in other organs. Brain abnormalities and cognitive impairment have been reported in severe SMA. We aimed to systematically investigate brain structure in SMA using MRI.

Methods: We acquired high-resolution T1-weighted images of treatment-naive patients with SMA, age- and sex-matched healthy and disease controls with other neuromuscular diseases, on a 3 T MRI scanner. We performed vertex-wise whole brain analysis and region of interest analysis of cortical thickness (CT), and volumetric analysis of the thalamus and compared findings in patients and controls using multiple linear regression models and Wald test. We correlated structural abnormalities with motor function as assessed by the Hammersmith Functional Motor Scale Expanded (HFMSE) and SMA Functional Rating Scale (SMA-FRS).

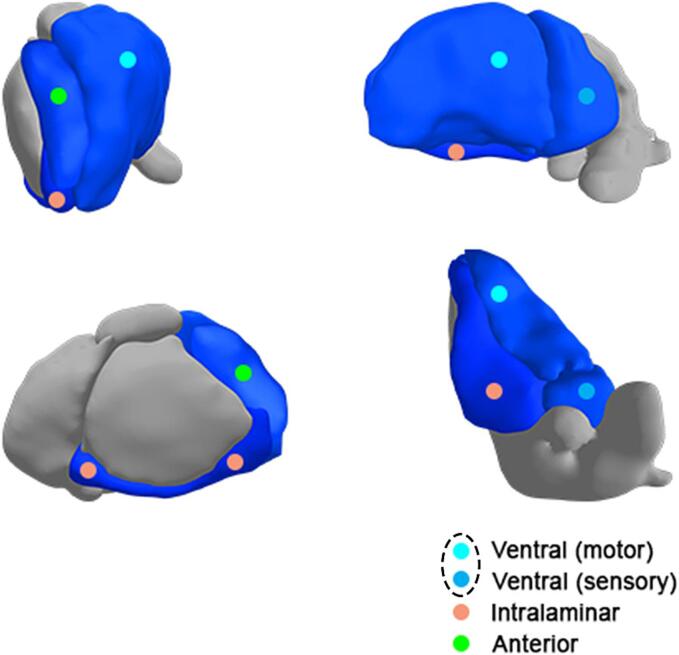
Results: We included 30 patients, 12-70 years old, with SMA type 2 and 3, 30 age- and sex-matched healthy controls and 17 disease controls (with distal SMA, hereditary motor and sensory neuropathy, multifocal motor neuropathy, progressive muscular atrophy and segmental SMA). We found a reduced CT in patients with SMA compared to healthy controls at the precentral, postcentral and medial orbitofrontal gyri and at the temporal pole (mean differences -0.059(p = 0.04); -0.055(p = 0.04), -0.06(p = 0.04); -0.17 mm(p = 0.001)). Differences at the precentral gyrus and temporal pole were most pronounced in SMA type 2 (mean differences -0.07(p = 0.045); -0.26 mm(p < 0.001)) and were also present compared to disease controls (mean differences -0.08(p = 0.048); -0.19 mm(p = 0.003)). There was a positive correlation between CT at the temporal pole with motor function. Compared to healthy controls, we found a reduced volume of the whole thalamus (mean difference -325 mm3(p = 0.03)) and of the anterior, ventral and intralaminar thalamic nuclei (mean differences -9.9(p = 0.02); -157(p = 0.01); -24.2 mm3(p = 0.02) in patients with SMA and a positive correlation between these volumes and motor function.

Conclusion: MRI shows structural changes in motor and non-motor regions of the cortex and the thalamus of patients with SMA type 2 and 3, indicating that SMA pathology is not confined to motor neurons.

Keywords: Brain; Cortical thickness; MRI; SMA; Spinal muscular atrophy; Thalamus.


Conflict of interest statement

Declaration of Competing Interest The authors declare the following financial interests/personal relationships which may be considered as potential competing interests: [Martijn P. van den Heuvel works as a consultant for ROCHE and is part of the editorial board of Human Brain Mapping. Leonard H. van den Berg serves on scientific advisory boards for the Prinses Beatrix Spierfonds and receives research support from the Prinses Beatrix Fonds. W. Ludo van der Pol served as an ad hoc member of scientific advisory boards (fee for service to employer) for Biogen, Biohaven, NMD Pharma, Scholar Rock, Roche and Novartis Genetherapies and receives research support from the Prinses Beatrix Spierfonds, EU Horizon 2020, Vriendenloterij and Stichting Spieren voor Spieren. Marloes Stam, Harold H. G. Tan, Ruben Schmidt and Renske I. Wadman report no competing interests].

Figures

Fig. 1
Fig. 1
Regions with reduced mean cortical thickness in patients with SMA compared to healthy controls Results of whole brain, region-wise analysis of mean cortical thickness in patients with SMA compared to healthy controls. A blue value indicates that the cortex is significantly thinner in SMA patients compared to healthy controls: i.e. at the precentral, postcentral, medial orbitofrontal gyrus and temporal pole. The color bar shows the corresponding p-value.
Fig. 2
Fig. 2
Regions with reduced mean cortical thickness in SMA patients compared to healthy controls, including subtype analyses. Results of participant subgroup analyses of mean cortical thickness. These were performed in brain regions that were found to be significantly different between patients with SMA and healthy controls in the whole-brain, region-wise analysis. Estimated marginal means with 95 % confidence intervals; *p < 0.05.
Fig. 3
Fig. 3
Correlation between cortical thickness at the temporal pole and clinical scores in SMA patients. Results of correlation analysis by multivariable linear regression model. There is a positive correlation between cortical thickness at the temporal pole and SMA-FRS score (β: 0.005; 95 %CI: 0.002–0.009; FDR corrected: p = 0,006) and HFMSE (β: 0.004; 95 %CI: 0.002–0.007; FDR corrected p-value = 0.006). Note that the individual data points are raw values, whereas the correlation lines are the result of the multivariable linear model. SMA-FRS = SMA Functional Rating Scale; HFMSE = Hammersmith Functional Motor Scale Expanded.
Fig. 4
Fig. 4
Reduced thalamic volumes in SMA patients compared to healthy controls, including subtype analyses. Results of participant subgroup analyses of thalamic volumes. These were performed for volumes/thalamic nuclei that were found to be significantly different between patients with SMA and healthy controls in the initial analysis: i.e. the whole thalamus and anterior, ventral and intralaminar thalamic nuclei. Estimated marginal means with 95 % confidence intervals; *p < 0.05.
Fig. 5
Fig. 5
Correlation between thalamic volume and clinical scores in SMA patients. Results of correlation analysis by multivariable linear regression model. There is a positive correlation between mean thalamus volume and SMA-FRS score (β: 13.83; 95 %CI: 5.12–22.54; FDR corrected p-value = 0.007) and HFMSE score (β: 10.15; 95 %CI: 3.00–17.30; FDR corrected p-value = 0.012. Note that the individual data points are raw values, whereas the correlation lines are the result of the multivariable linear model. SMA-FRS = SMA Functional Rating Scale; HFMSE = Hammersmith Functional Motor Scale Expanded.
Fig. 6
Fig. 6
Thalamic nuclei with reduced volume in patients with SMA compared to healthy controls. Results of the analysis of volumes of thalamic nuclei in patients with SMA compared to healthy controls. Blue value indicates that the volume is significantly smaller in SMA patients compared to healthy controls (p-values ≤ 0.02), i.e. the anterior, ventral and intralaminar thalamic nuclei. Dashed circle: We analyzed the motor and sensory part of the ventral nucleus combined.
Fig. 7
Fig. 7
Correlation between volumes of thalamic nuclei and clinical scores in SMA patients. Results of correlation analysis by multivariable linear regression model. There is a positive correlation between ventral nuclei group volume and SMA-FRS score (β: 7.63; 95 %CI: 4.41–10.84; FDR corrected p-value < 0.001) and HFMSE score (β: 5.66; 95 %CI: 2.94–8.37; FDR corrected p-value = 0.001). There is a positive correlation between intralaminar nuclei group volume and SMA-FRS score (β:1.14; 95 %CI: 0.46–1.91; FDR corrected p-value = 0.006) and HFMSE score (β:0.84; 95 %CI: 0.28–1.39; FDR corrected p-value = 0.009) Note that the individual data points are raw values, whereas the correlation lines are the result of the multivariable linear model. SMA-FRS = SMA Functional Rating Scale; HFMSE = Hammersmith Functional Motor Scale Expanded.

References

    1. The ALS CNTF treatment study (ACTS) phase I-II Study Group. The Amyotrophic Lateral Sclerosis Functional Rating Scale. Assessment of activities of daily living in patients with amyotrophic lateral sclerosis. Arch Neurol. 1996; 53:141–147. - PubMed
    1. Angelini C and Pinzan E. Advances in imaging of brain abnormalities in neuromuscular disease. Ther. Adv. Neurol. Disord. 2019; 12: 1756286419845567. Epub 2019 May 6. doi:10.1177/1756286419845567. - PMC - PubMed
    1. Araki S., Hayashi M., Tamagawa K., et al. Neuropathological analysis in spinal muscular atrophy type II. Acta Neuropathol. 2003;106:441–448. - PubMed
    1. Barnes J., Ridgway G.R., Bartlett J., et al. Head size, age and gender adjustment in MRI studies: a necessary nuisance? Neuroimage. 2010;53(4):1244–1255. doi: 10.1016/j.neuroimage.2010.06.025. - DOI - PubMed
    1. Bos D.J., Oranje B., Achterberg M., et al. Structural and functional connectivity in children and adolescents with and without attention deficit/hyperactivity disorder. J Child Psychol. Psychiatry. 2017;58(7):810–818. doi: 10.1111/jcpp.12712. - DOI - PubMed