. 2024 Nov 22;8(2):e202402791.
doi: 10.26508/lsa.202402791. Print 2025 Feb.

Vascular dysfunction is at the onset of oxaliplatin-induced peripheral neuropathy symptoms in mice

Affiliations

Vascular dysfunction is at the onset of oxaliplatin-induced peripheral neuropathy symptoms in mice

Sonia Taïb et al. Life Sci Alliance. .

Abstract

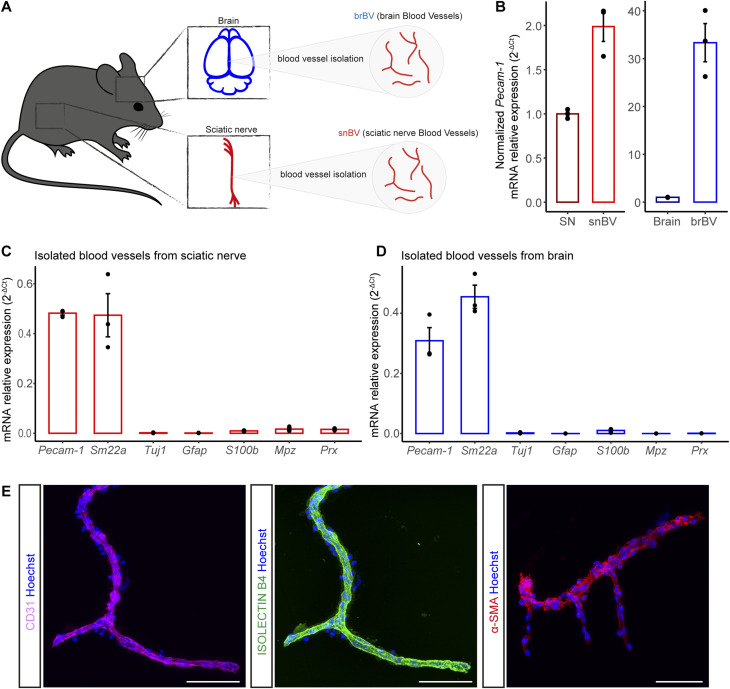
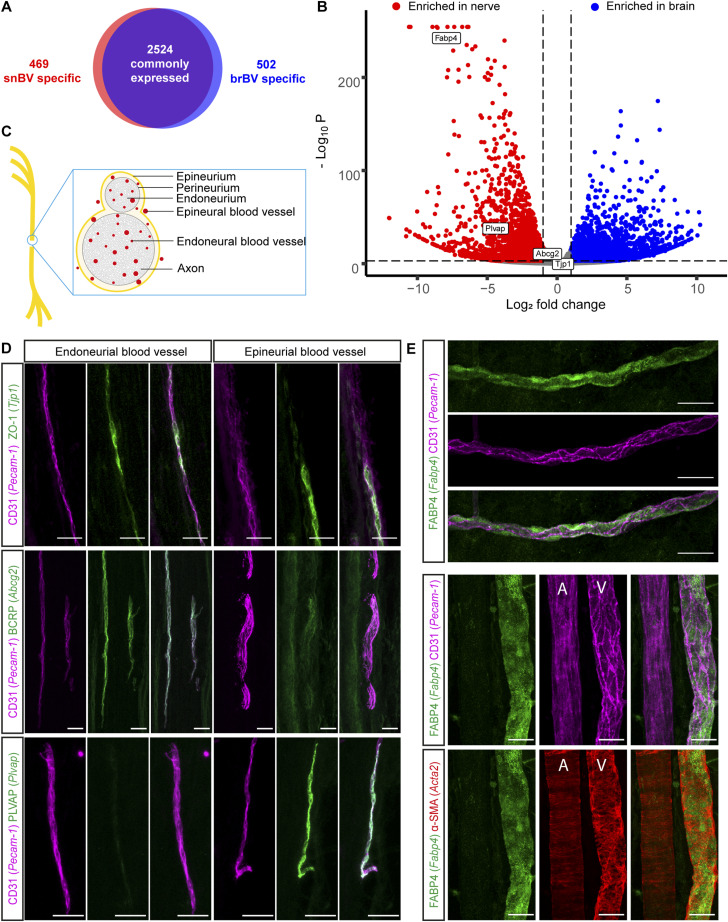
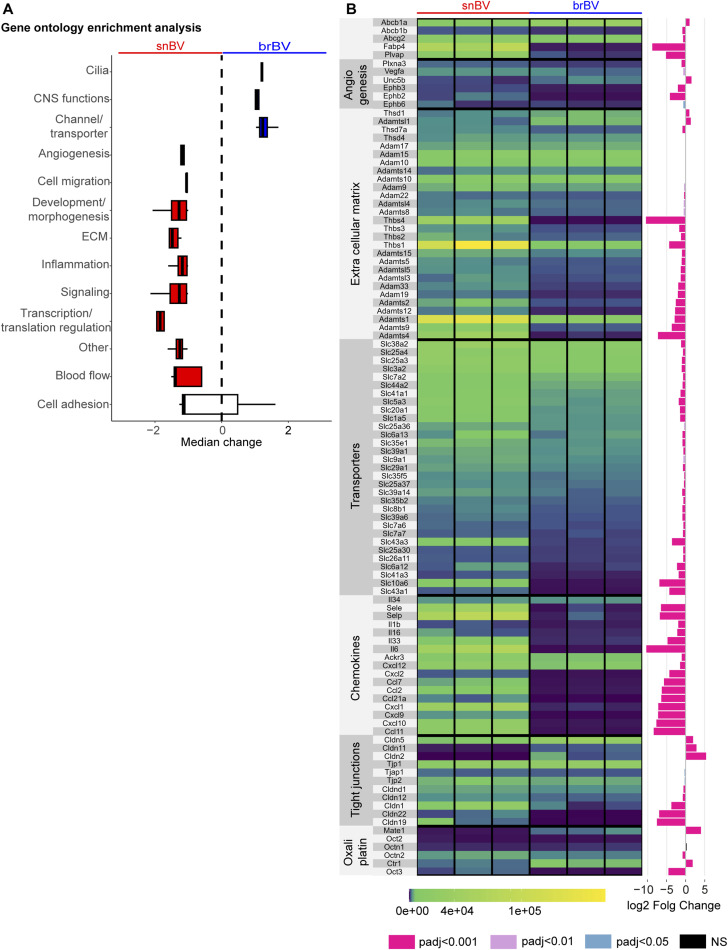
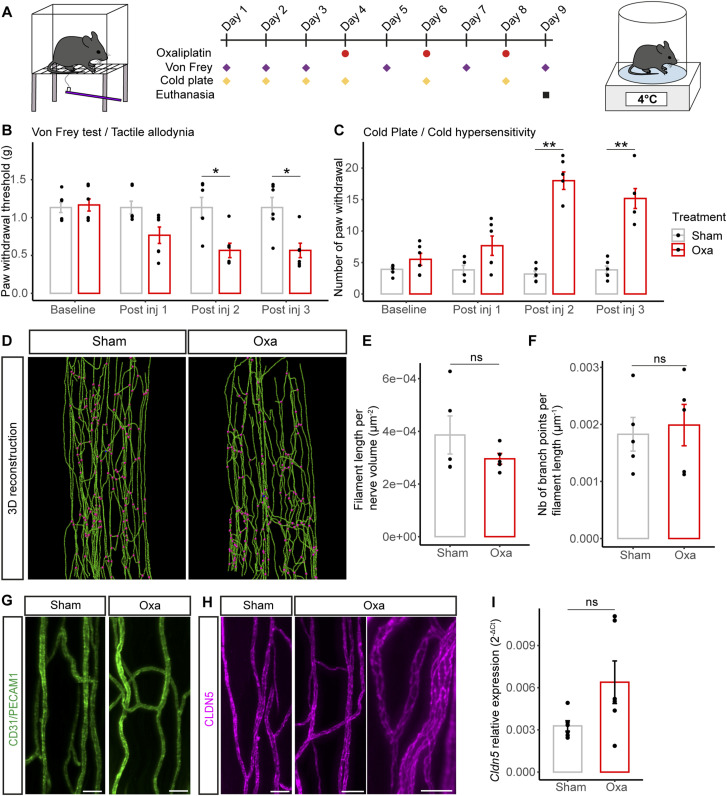
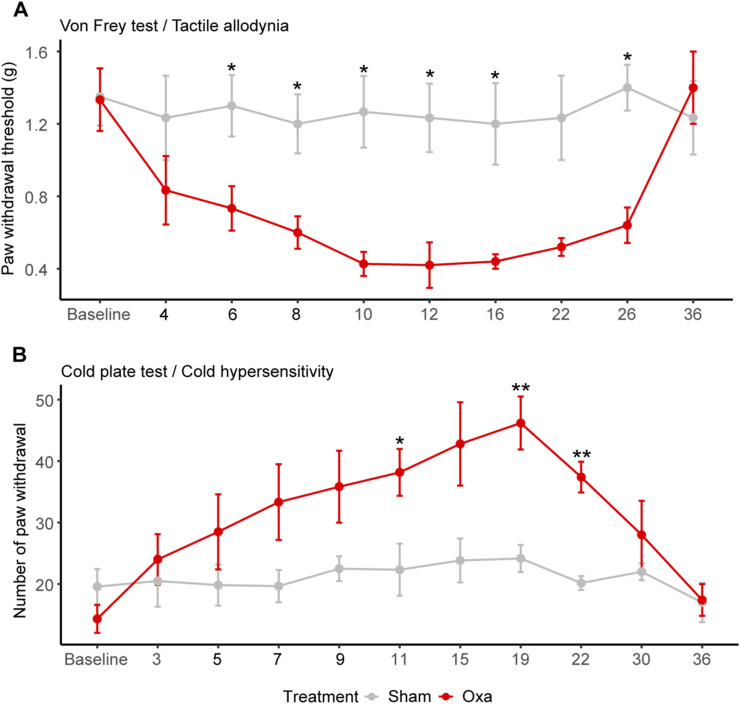
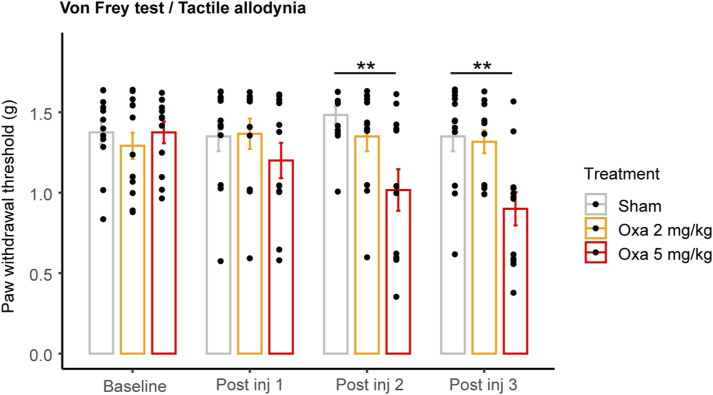
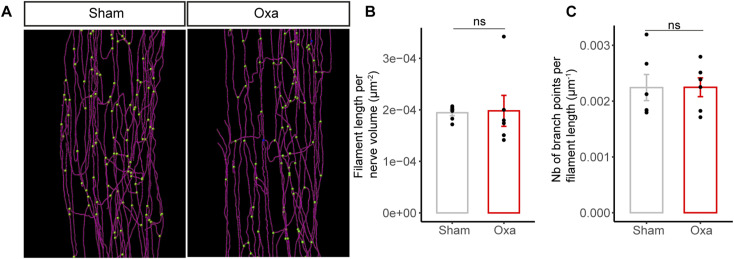
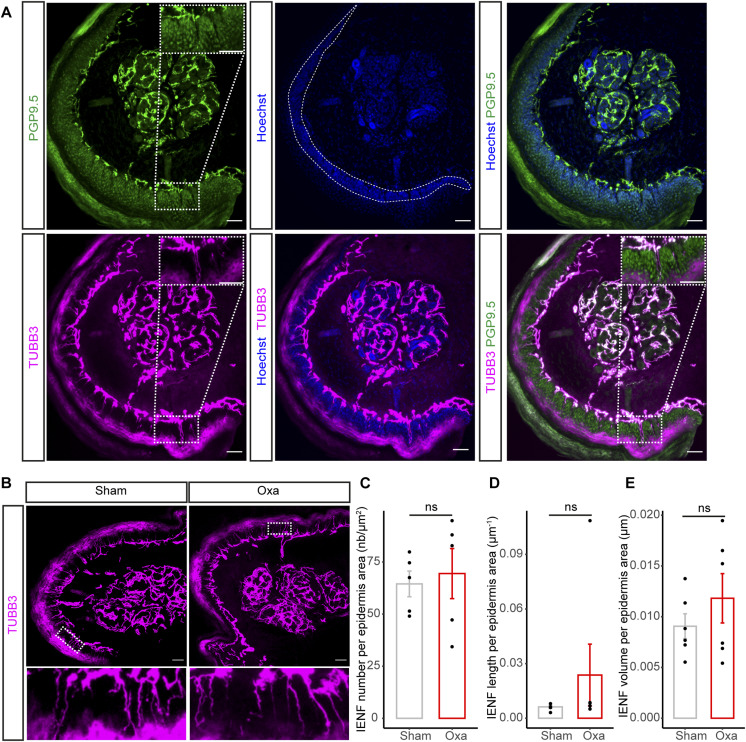
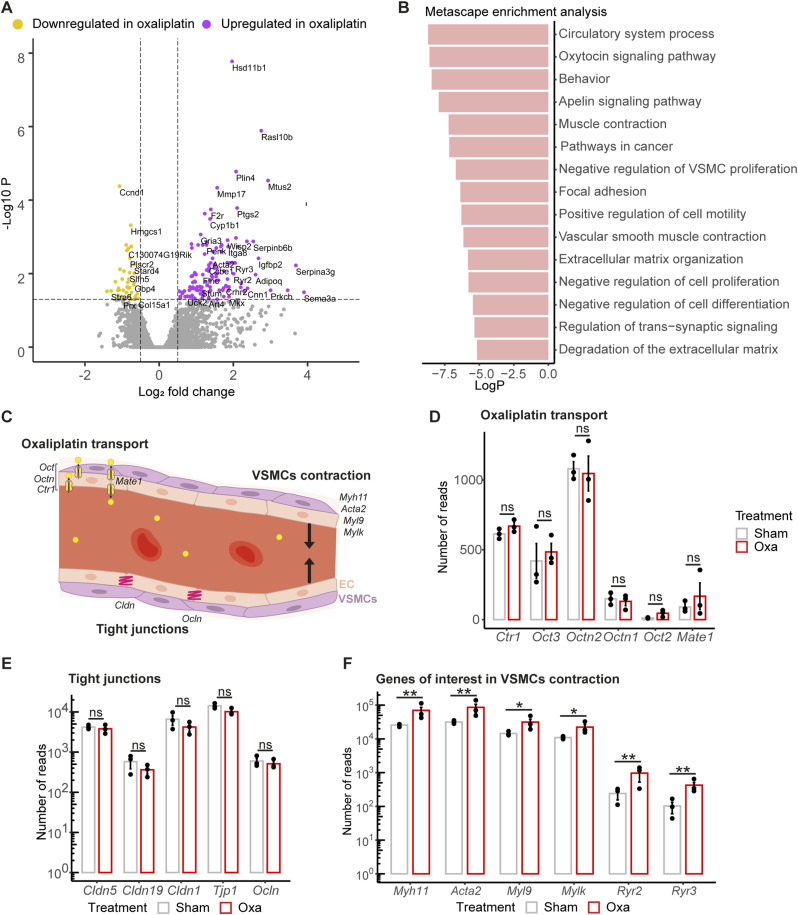
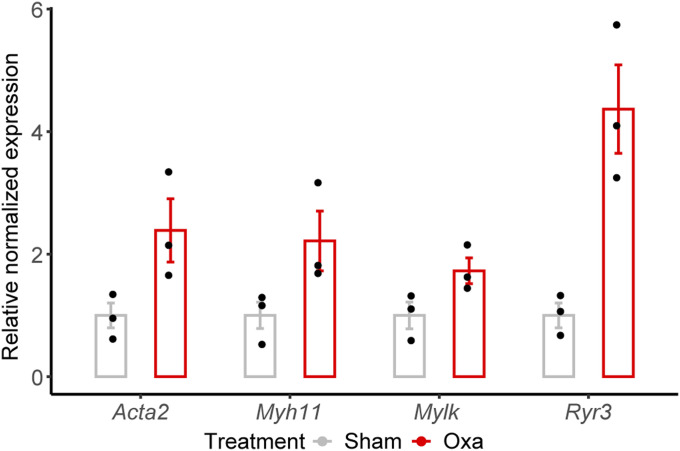
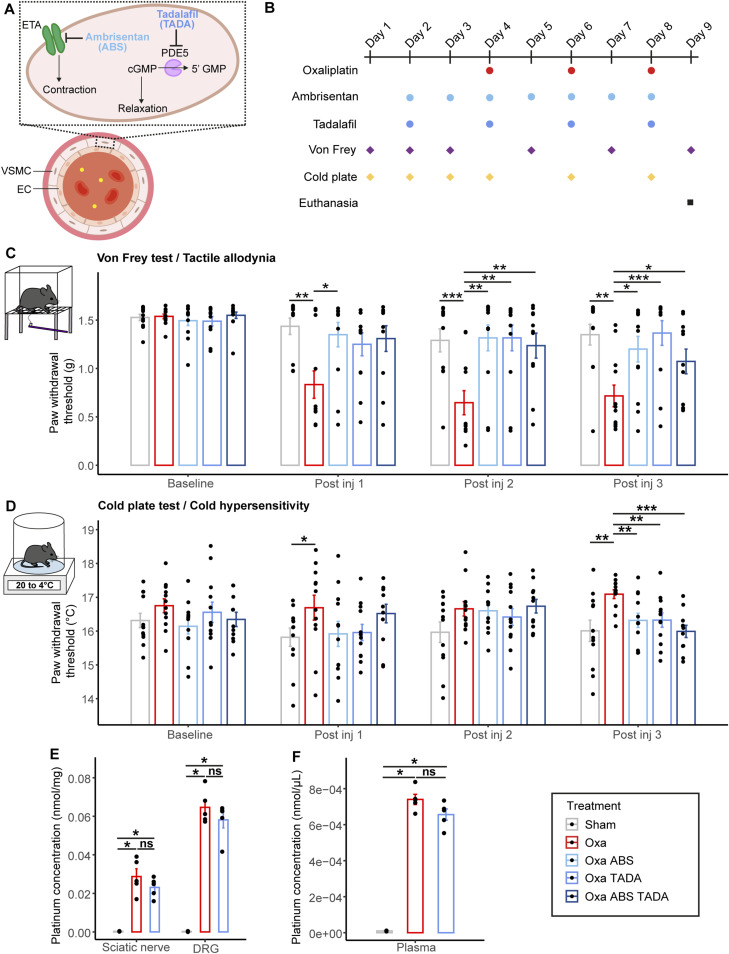
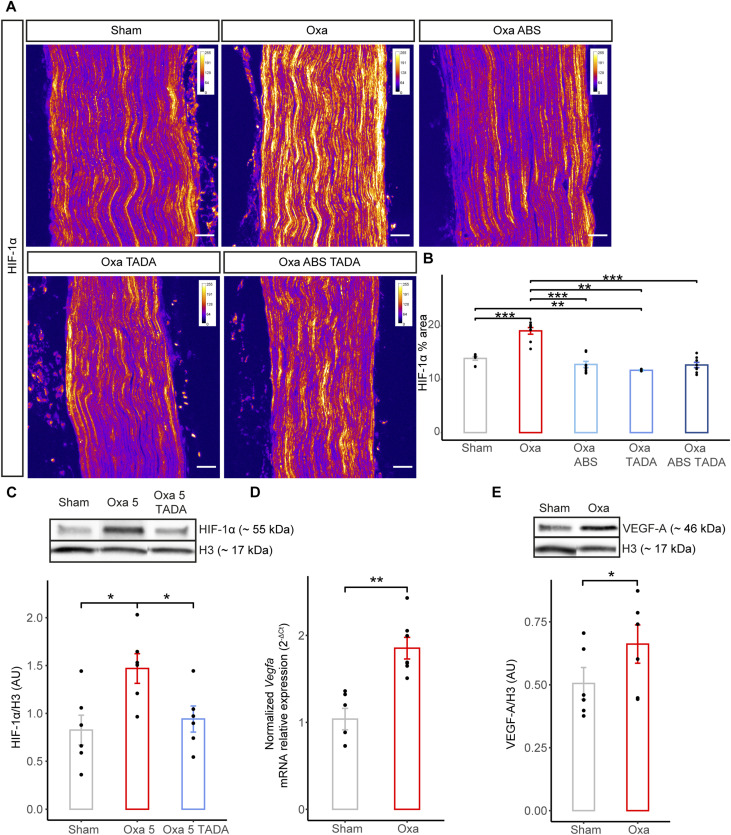
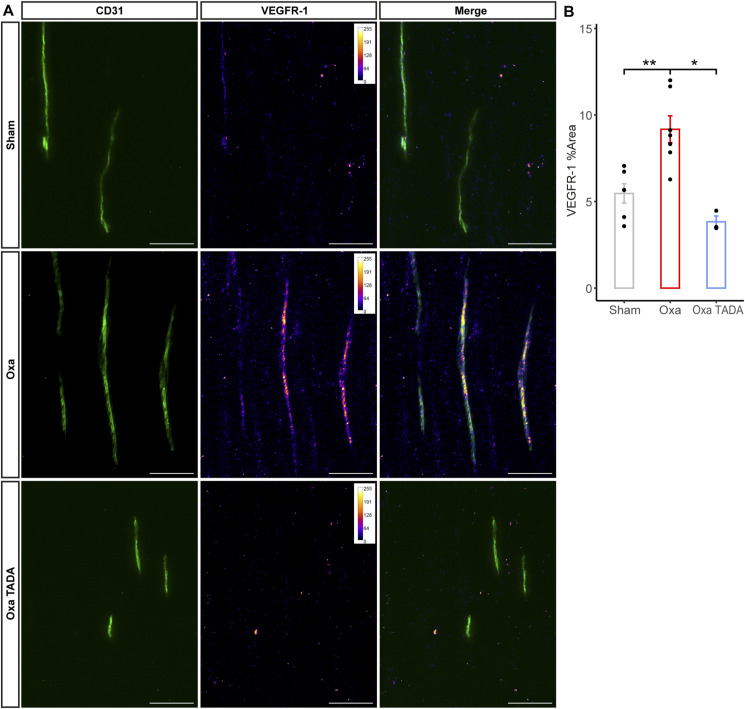
Oxaliplatin-induced peripheral neuropathy (OIPN) is an adverse side effect of this chemotherapy used for gastrointestinal cancers. The continuous pain experienced by OIPN patients often results in the reduction or discontinuation of chemotherapy, thereby affecting patient survival. Several pathogenic mechanisms involving sensory neurons were shown to participate in the occurrence of OIPN symptoms. However, the dysfunction of the blood-nerve barrier as a source of nerve alteration had not been thoroughly explored. To characterise the vascular contribution to OIPN symptoms, we undertook two comparative transcriptomic analyses of mouse purified brain and sciatic nerve blood vessels (BVs) and nerve BVs after oxaliplatin or control administration. These analyses reveal distinct molecular landscapes between brain and nerve BVs and the up-regulation of transcripts involved in vascular contraction after oxaliplatin treatment. Anatomical examination of the nerve yet shows the preservation of BV architecture in the acute OIPN mouse model, although treated mice exhibit both neuropathic symptoms and enhanced vasoconstriction reflected by hypoxia. Moreover, vasodilators significantly reduce oxaliplatin-induced neuropathic symptoms and endoneurial hypoxia, establishing the key involvement of nerve blood flow in OIPN.


Conflict of interest statement

The authors declare that they have no conflict of interest.

Figures

Figure 1.
Figure 1.. Purified blood vessels from mouse brain and sciatic nerve.
(A) Schematic representation of the distinct samples: brBV (for brain blood vessels) and snBV (for sciatic nerve blood vessels). (B) qRT-PCR of Pecam-1 from isolated blood vessels and from entire brains or sciatic nerves (SN). (C, D) qRT-PCR of transcripts encoding CD31/PECAM1, SM22a, TUBB3, GFAP, S100 β, MPZ, and PRX from sciatic nerve (C) or brain (D) isolated blood vessels. (E) Immunofluorescence staining of purified snBV: endothelial cells are labeled in magenta (CD31) and in green (IB4), whereas mural cells including vascular smooth muscle cells are stained in red. All cell nuclei are labeled in blue (Hoechst). Data information: n = 3 samples. Each sample represents two mice (four sciatic nerves or two brains). Scale bar is 50 μm.
Figure 2.
Figure 2.. Protein expression pattern of the vasa nervorum.
(A) Number of commonly expressed, snBV (sciatic nerve blood vessels)- and brBV (brain blood vessels)-specific genes. Adjusted P-value cut-off <0.001; log2 fold change < −1.5 or log2 fold change > 1.5. Specific genes were considered when, in addition to those parameters, a given gene was not detected above 500 reads in the brain (snBV specific) or in the nerve (brBV specific). (B) Volcano plot of differentially expressed genes. Differentially expressed genes of interest are highlighted in white boxes. Adjusted P-value cut-off <0.001; log2 fold change < −1 or log2 fold change > 1. (C) Schematic representation showing the sciatic nerve structure. (D) Immunostaining on sciatic nerve longitudinal sections (14-μm thick). Blood vessels are stained in magenta (CD31/PECAM1). Two mutually expressed proteins, ZO-1 and BCRP and a nerve-enriched protein, PLVAP, are labeled in green. (E) Whole-mount immunostaining of a sciatic nerve. Endothelial cells are stained in magenta (CD31/PECAM1), smooth muscle cells in red (α-SMA), and the differentially expressed and nerve-specific protein FABP4 in green. A and V are respectively for artery and vein. Data information: Scale bar 30 μm.
Figure 3.
Figure 3.. Molecular signatures of sciatic nerve and brain blood vessels.
(A) Enriched pathways in snBV (sciatic nerve blood vessels) and brBV (brain blood vessels) gene sets. Mann–Whitney test, P-value <0.01. (B) Heatmap representation of differentially expressed genes of interest involved in different pathways: oxaliplatin transport, tight junctions, chemokines, transporters, extracellular matrix and angiogenesis. The five first differentially expressed genes on top are not associated with any specific pathways but were selected for their enrichment in snBV (Fabp4, Plvap) or commonly expressed in both tissues (Abcg2, Abcb1a, Abcb1b). Right: log2 fold change between snBV and brBV. The color of the column refers to the adjusted P-value. Data information: n = 3 with 2 mice per sample.
Figure 4.
Figure 4.. Analysis of the vasa nervorum in mice developing neuropathic symptoms after oxaliplatin IV administration.
(A) Schematic representation of oxaliplatin-induced peripheral neuropathy acute mice model representing oxaliplatin injection and behavioral test (Von Frey and cold plate) timepoints. (B) Paw withdrawal threshold before and after each injection of oxaliplatin (oxa) or glucose (sham) measured with Von Frey test. (C) Sensitivity to cold before and after each injection, with a temperature of 4°C during 2 min (D) 3D reconstruction of the blood vessel network based on CD31/Pecam-1 signal from cleared sciatic nerves. Branch points are represented in magenta. (E) Quantification of the blood vessel length per nerve volume. (F) Quantification of the number of blood vessel branch points per filament length. (G) 3D view (200-μm thick) of a sciatic nerve region from sham and oxa mice. CD31/PECAM1 is stained in green. (H) 3D view (200-μm thick) of a sciatic nerve region from sham and oxa mice (zoom on the right). CLDN5 is stained in magenta. (I) qRT-PCR of Cldn5 mRNA. Data information; n = 5–6. Mann–Whitney test, two-tailed, *P < 0.05, **P < 0.01. (B, C) Supplemental test (not shown in graphs): Kruskal–Wallis test, (B): Sham ns, Oxa **; (C): Sham ns, Oxa ***, with *P < 0.05, **P < 0.01, ***P < 0.001. (D, G, H) Scale bar: (D): 100 μm, (G): 30 μm, (H): Left: 40 μm, zoom on the right panel: 20 μm.
Figure S1.
Figure S1.. Disappearance of acute neuropathic symptoms about 20 d after the last oxaliplatin injection.
(A) Mechanical threshold before (Baseline) and after three injections (days 3, 5, and 7) of oxaliplatin (Oxa) or glucose (Sham). (B) Sensitivity to cold before (baseline) and after each injection (days 3, 5, and 7) of oxaliplatin, with a temperature of 4°C during 2 min. Data information: n = 6 mice per group until day 15, n = 5 for the oxa group onwards. Mann–Whitney test, two-tailed, *P < 0.05, **P < 0.01.
Figure S2.
Figure S2.. Evaluation of mouse paw sensitivity induced by intravenous injections of oxaliplatin lower doses.
Paw withdrawal threshold before and after each injection of oxaliplatin (Oxa) at 2 or 5 mg/kg or glucose (sham) measured with Von Frey test. Data information: n = 12, Mann–Whitney test, two-tailed, **P < 0.01.
Figure S3.
Figure S3.. Intra-nervous vascularization integrity.
(A) 3D reconstruction of the intra-nervous blood vessel network based on CLDN5 (Claudin-5) staining from oxaliplatin-treated (Oxa) and non-treated (Sham) cleared sciatic nerves. Branch points are shown in green. (B) Quantification of the total blood vessel length per nerve. (C) Quantification of blood vessel branch point number per vessel length. Data information: n = 6 mice. Mann–Whitney test, two-tailed.
Figure S4.
Figure S4.. Intraepidermal innervation is not affected in our acute oxaliplatin-induced peripheral neuropathy (oxaliplatin-induced peripheral neuropathy) mouse model.
(A) Immunostaining on transverse cryosections of mouse hind paw skin (25-μm thick). Nerve fibers are stained in green (PGP9.5) or in magenta (TUBB3). PGP9.5 is a pan neuronal marker classically used for Intraepidermal Nerve Fibers (IENF) analysis. Yet, TUBB3 was in our hands a better marker to visualize the fibers. The area in dashed white (middle panel, Hoechst) represents the epidermis area in which the IENF were analyzed. (B) Immunostaining on transverse cryosections of mouse hind paw skin (25-μm thick) from control (Sham) and oxaliplatin-treated (Oxa) group. Fibers are stained in magenta (TUBB3). Bottom: zoom of the white boxed area. (C) Quantification of the number of fibers that cross the epidermis area. (D) Quantification of IENF total length in epidermis area by 3D reconstruction of IENF network (100-μm thick). (E) Quantification of IENF total volume in epidermis area by 3D reconstruction of IENF network (100-μm thick). (A, B, C, D, E) Data information: (A, B): Scale bar 50 μm. (C): n = 5 animals; (D, E): n = 6 animals. (C, D, E): Mann–Whitney test, two-tailed.
Figure 5.
Figure 5.. Transcriptomic analysis of the vasa nervorum molecular composition in an acute mouse model of oxaliplatin-induced peripheral neuropathy.
(A) Volcano plot representation of differentially expressed genes, adjusted P-value cut-off <0.05; log2 fold change < −0.5 or log2 fold change > 0.5. (B) Metascape analysis. Top 15 pathways enriched in differentially expressed genes. Low logP values correspond to the most enriched pathways. (C) Schematic representation showing genes of interest in blood vessel biological processes. (D, E, F) Number of reads for mRNA encoding oxaliplatin transporters/tight-junction proteins/genes of interest involved in vascular smooth muscle contraction from RNA sequencing data. Data information: n = 3 with 2 mice per sample, adjusted P-value from DESeq2 analysis *P < 0.05, **P < 0.01.
Figure S5.
Figure S5.. RT-qPCR validation of oxa versus sham snBV (sciatic nerve blood vessels) transcriptomic analysis.
RT-qPCR normalized relative expression of Acta2, Myh11, Mylk, and Ryr3 in purified snBV. Data information: n = 3, Mann–Whitney test, two-tailed, ns.
Figure 6.
Figure 6.. Preventive administration of ambrisentan and tadalafil improves oxaliplatin-induced neuropathic symptoms without affecting its accumulation.
(A) Schematic representation of ambrisentan and tadalafil molecular targets. (B) Schematic representation of the timepoints in oxaliplatin, ambrisentan, tadalafil injections and behavioral tests (Von Frey and cold plate). (C) Paw withdrawal threshold before and after injections of oxaliplatin (oxa), ambrisentan (ABS), or tadalafil (TADA) or both (Oxa ABS TADA). (D) Sensitivity to cold before and after injections of oxaliplatin, ambrisentan, and tadalafil. The temperature starts à 20°C and the plate loses 2°C per min. The threshold represents the temperature of the first response to cold. (E, F): Platinum concentrations in sciatic nerves, dorsal root ganglias (E) and plasma (F) from sham, oxaliplatin-treated or doubly oxaliplatin + tadalafil–treated animals. (C, D, E, F) Data information: (C, D) n = 12 (except n = 11 for Oxa ABS TADA at post inj 3), (E, F) n = 5 (except n = 3 for sham). Mann–Whitney test, two-tailed: *P < 0.05, **P < 0.01, ***P < 0.001. Supplemental tests (not shown in graphs). (C): Kruskal–Wallis Sham ns, Oxa ****, Oxa ABS ns, Oxa TADA ns, Oxa ABS TADA. *(D): Kruskal–Wallis Sham ns, Oxa ns, Oxa ABS ns, Oxa TADA ns, Oxa ABS TADA ns. *P < 0.05, **P < 0.01, ***P < 0.001.
Figure 7.
Figure 7.. Administration of ambrisentan and tadalafil reduces oxaliplatin-induced nerve hypoxia and HIF-1α downstream effector VEGF-A.
(A) Immunostaining of sciatic nerve longitudinal sections with anti-HIF-1α antibody. Nerves dissected from sham and oxaliplatin-treated animals (10 mg/kg) or treated with oxaliplatin (10 mg/kg) + tadalafil (Oxa TADA) or ambrisentan (Oxa ABS) or tadalafil + ambrisentan (Oxa ABS TADA) were analyzed. Representative images for each condition are visualized using an intensity-based color-coded representation using imageJ (fire LUT lookup table) to assess HIF-1α intensity. Colors represent signal intensity scale in the range of 0–256 (arbitrary unit) for each condition. (B) Quantification of HIF-1α-positive areas normalized to the nerve area. (C) Western blot analysis of HIF-1α expression in whole nerve homogenate from mice treated with oxaliplatin (5 mg/kg), oxaliplatin (5 mg/kg) + tadalafil (10 mg/kg) and glucose (sham). (D) qRT-PCR analysis of Vegfa expression from whole sciatic nerve of oxaliplatin-treated mice (10 mg/kg) compared with control mice (sham). (E) Western blot analysis of VEGF-A expression in whole nerve homogenate from mice treated with oxaliplatin (10 mg/kg) or glucose (sham). Data information: n = 4–8, Mann–Whitney test, two-tailed, *P < 0.05, **P < 0.01, ***P < 0.001. Scale bar 50 μm. (E) Mann–Whitney test, two-tailed, *P-adjusted < 0.05.
Figure S6.
Figure S6.. VEGFR-1 expression is increased in sciatic nerve blood vessels in an acute oxaliplatin-induced peripheral neuropathy mouse model.
(A) Immunostaining of sciatic nerve longitudinal cryosections with anti-VEGFR-1 and CD31 (blood vessels) antibodies. Nerves were dissected from control (Sham), oxaliplatin-treated animals (Oxa) and oxaliplatin-treated animal plus tadalafil (Oxa TADA). VEGFR-1 staining is visualized using intensity-based color-coded representation using imageJ (fire LUT lookup table) to assess VEGFR-1 intensity. Blood vessels are stained with CD31 (green). (B) Quantification of VEGFR-1-positive areas in endoneurial blood vessels. Data information: n = 3–7. Mann–Whitney test, two-tailed, *P < 0.05, **P < 0.01. Scale bar 50 μm.

Similar articles

References

    1. Achar A, Myers R, Ghosh C (2021) Drug delivery challenges in brain disorders across the blood-brain barrier: Novel methods and future considerations for improved therapy. Biomedicines 9: 1834. 10.3390/biomedicines9121834 - DOI - PMC - PubMed
    1. Anders S, Pyl PT, Huber W (2015) HTSeq-a Python framework to work with high-throughput sequencing data. Bioinformatics 31: 166–169. 10.1093/bioinformatics/btu638 - DOI - PMC - PubMed
    1. Archer AG, Roberts VC, Watkins PJ (1984) Blood flow patterns in painful diabetic neuropathy. Diabetologia 27: 563–567. 10.1007/BF00276968 - DOI - PubMed
    1. Argyriou AA, Cavaletti G, Briani C, Velasco R, Bruna J, Campagnolo M, Alberti P, Bergamo F, Cortinovis D, Cazzaniga M, et al. (2013) Clinical pattern and associations of oxaliplatin acute neurotoxicity: A prospective study in 170 patients with colorectal cancer. Cancer 119: 438–444. 10.1002/cncr.27732 - DOI - PubMed
    1. Barter RL, Yu B (2018) Superheat: An R package for creating beautiful and extendable heatmaps for visualizing complex data. J Comput Graph Stat 27: 910–922. 10.1080/10618600.2018.1473780 - DOI - PMC - PubMed

MeSH terms