. 2024 Nov 22;15(1):10137.
doi: 10.1038/s41467-024-54471-z.

The 1000 Chinese Indigenous Pig Genomes Project provides insights into the genomic architecture of pigs

Affiliations

The 1000 Chinese Indigenous Pig Genomes Project provides insights into the genomic architecture of pigs

Heng Du et al. Nat Commun. .

Abstract

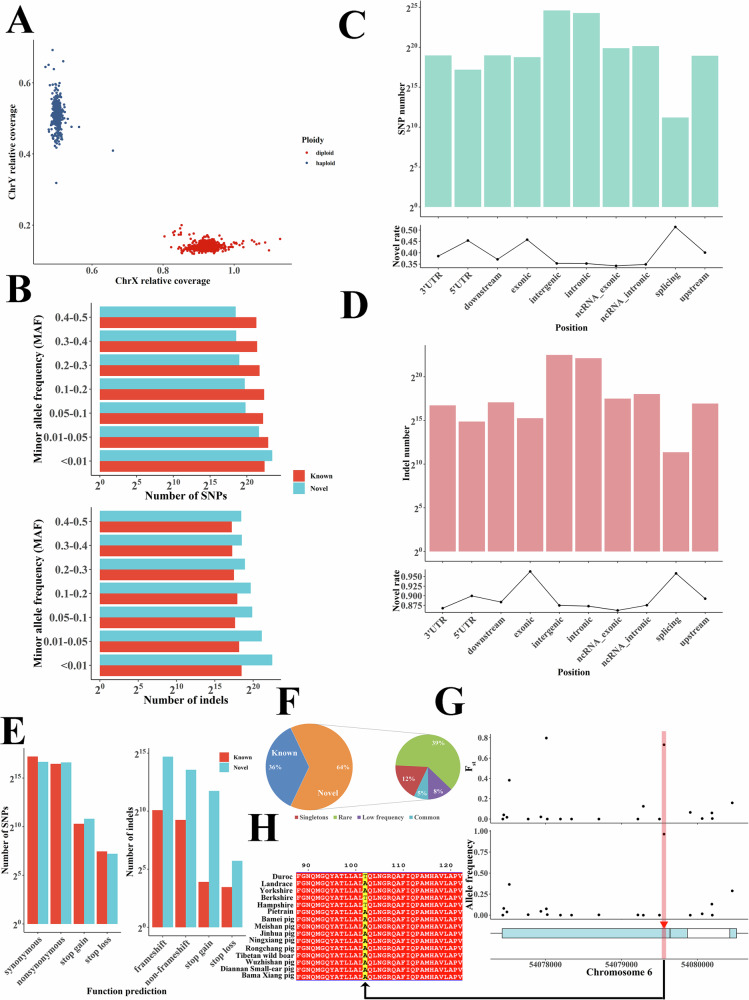
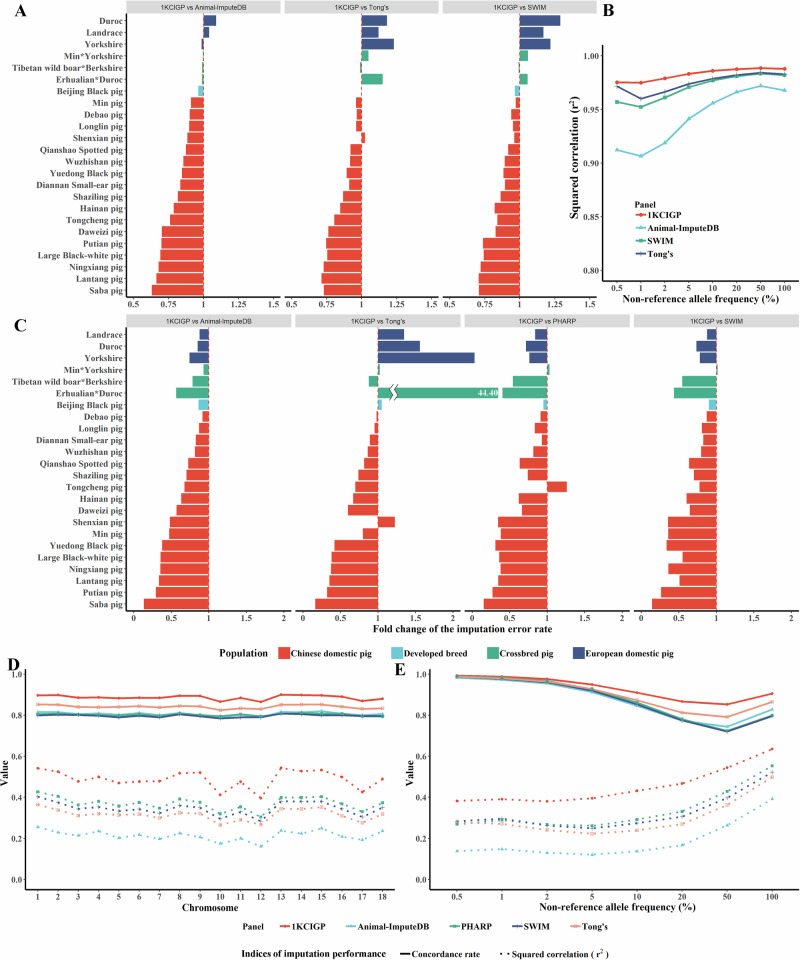
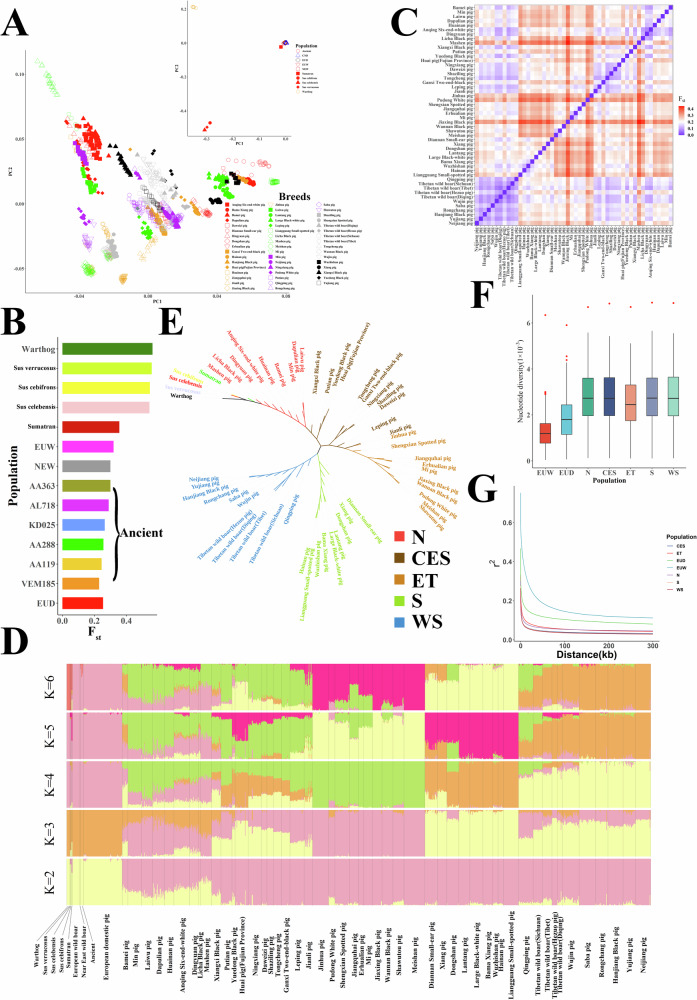
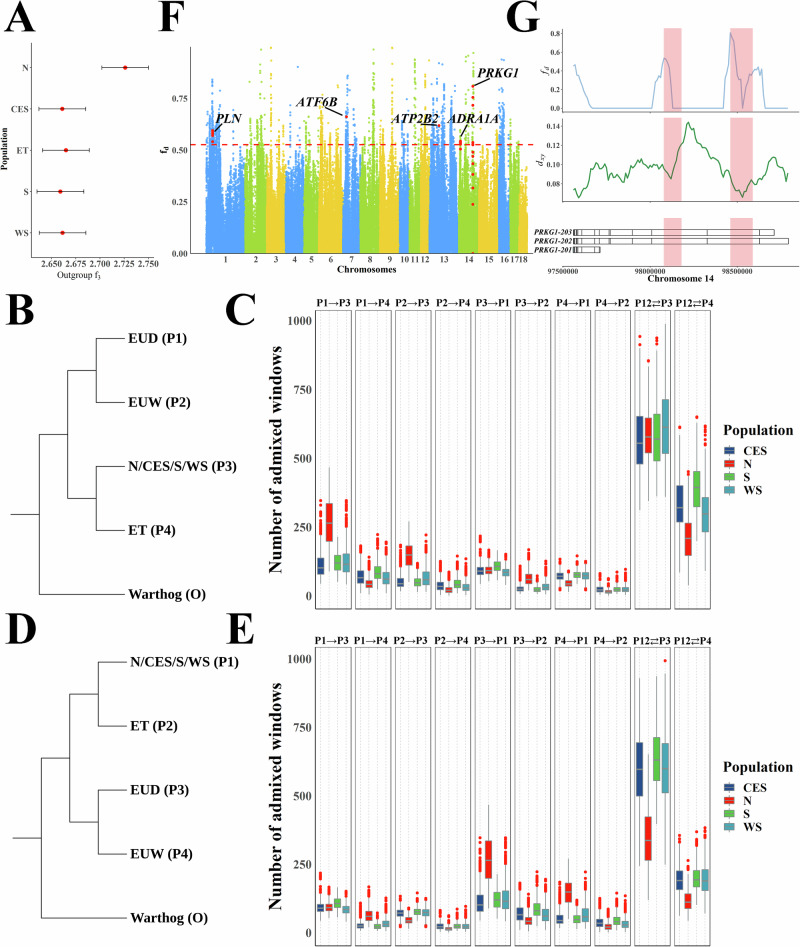
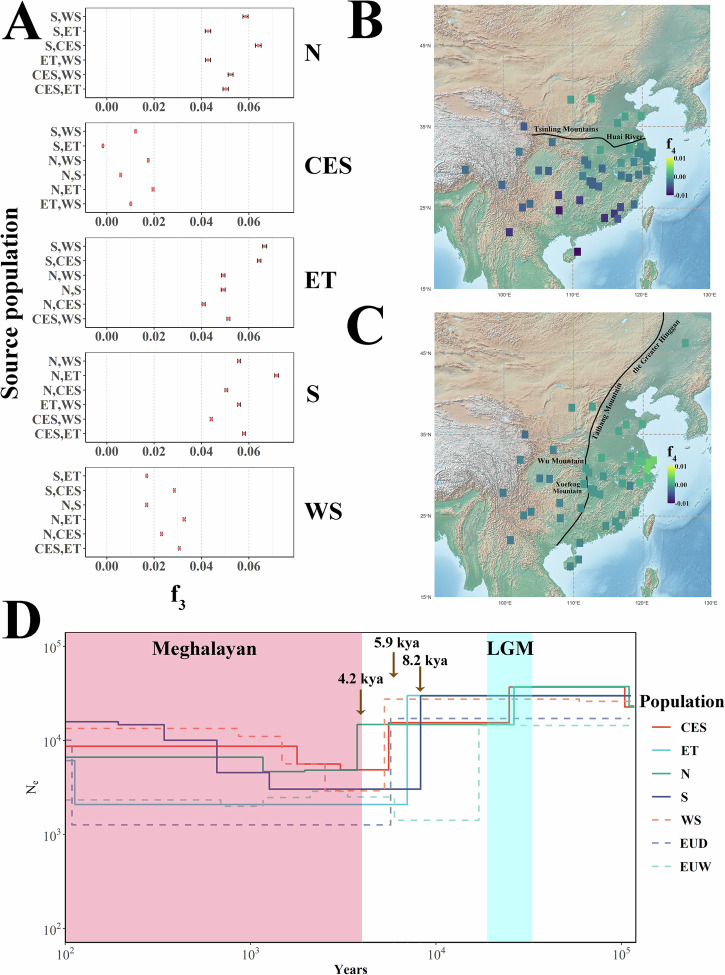
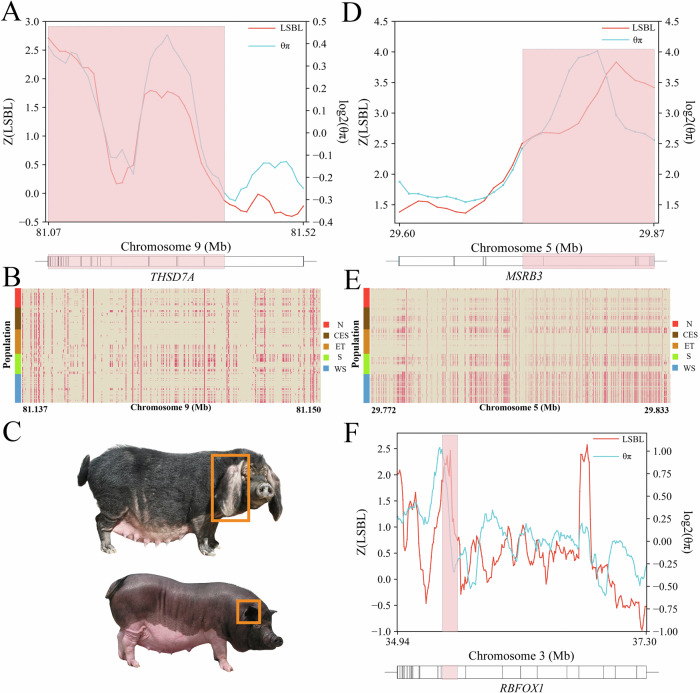
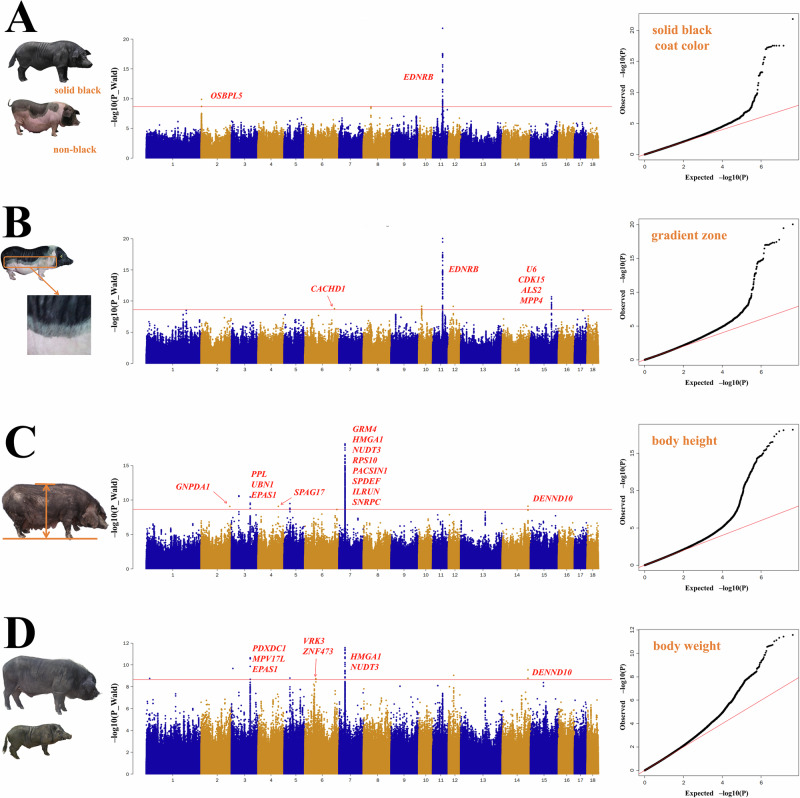
Pigs play a central role in human livelihoods in China, but a lack of systematic large-scale whole-genome sequencing of Chinese domestic pigs has hindered genetic studies. Here, we present the 1000 Chinese Indigenous Pig Genomes Project sequencing dataset, comprising 1011 indigenous individuals from 50 pig populations covering approximately two-thirds of China's administrative divisions. Based on the deep sequencing (~25.95×) of these pigs, we identify 63.62 million genomic variants, and provide a population-specific reference panel to improve the imputation performance of Chinese domestic pig populations. Using a combination of methods, we detect an ancient admixture event related to a human immigration climax in the 13th century, which may have contributed to the formation of southeast-central Chinese pig populations. Analyzing the haplotypes of the Y chromosome shows that the indigenous populations residing around the Taihu Lake Basin exhibit a unique haplotype. Furthermore, we find a 13 kb region in the THSD7A gene that may relate to high-altitude adaptation, and a 0.47 Mb region on chromosome 7 that is significantly associated with body size traits. These results highlight the value of our genomic resource in facilitating genomic architecture and complex traits studies in pigs.


Conflict of interest statement

Competing interests: The authors declare no competing interests.

Figures

Fig. 1
Fig. 1. Overview of the 1KCIGP dataset and small genomic variants.
A The sex of each individual was inferred from sex chromosome coverage and the estimated ploidy of chromosome X. B. The number of variants with different MAF bins, where the upper and lower plots represent SNP and indels, respectively. C Number (top) and novel rates (bottom) of SNPs in different annotation regions. D Number (top) and novel rates (bottom) of indels in the different annotation regions. E Number of functional protein-coding variants for SNPs (left) and indels (right). F The frequency spectrum of deleterious SNPs. G A missense mutation in the FUT1 gene. The top plot shows the Fst between Chinese domestic and European pigs. The middle plot shows the allele frequency of this mutation in Chinese domestic pigs, and the bottom plot shows the gene structure. H The missense mutation induced amino acid change.
Fig. 2
Fig. 2. Performance of the 1KCIGP haplotype reference panel.
A The fold-change in the imputation error rate in the 262 test WGS data using the 1KCIGP, Animal-ImputeDB, SWIM, and Tong’s reference panels. Imputation error rate = (1 – imputation concordance rate). The different colored bars represent different populations, corresponding to the populations shown in Fig. 2C. B The squared correlation between the imputed allele dosages and the true genotype within the stratified non-reference allele frequency bins was derived from the 113 test WGS data of Chinese domestic pigs using the 1KCIGP, Animal-ImputeDB, SWIM, and Tong’s reference panels. C Fold change in imputation error rate in the simulated commercial 50 K SNP chip using the 1KCIGP, Animal-ImputeDB, SWIM, PHARP, and Tong’s reference panels. Imputation error rate = (1 – imputation concordance rate). D Imputation performance of each chromosome from the simulated commercial 50 K SNP chip of Chinese domestic pigs using the 1KCIGP, Animal-ImputeDB, SWIM, PHARP, and Tong’s reference panels. This and subsequent scenarios only display results for the Chinese domestic pig. The solid line represents the concordance rate, while the dashed line represents the squared correlation. Different colors represent different panels. E The imputation performance within stratified non-reference allele frequency bins derived from the simulated commercial 50 K SNP chip data of Chinese domestic pigs using the 1KCIGP, Animal-ImputeDB, SWIM, PHARP, and Tong’s reference panels.
Fig. 3
Fig. 3. Population structure analyses of Chinese domestic pig populations.
A PCA of Chinese domestic pig populations and other pig populations across Eurasia. CND: Chinese domestic pigs; EUD: European domestic pigs; EUW: European wild boars; NEW: wild boars from the Near East; Ancient: ancient pigs. B The Fst results between Chinese domestic pigs and other pig populations across Eurasia. C The Fst results among different Chinese domestic pig populations. D The genetic clustering analysis of pigs across Eurasian. E The phylogenetic tree of Chinese domestic pigs. F The nucleotide diversity for Chinese domestic pigs and European pigs. The nucleotide diversity was calculated for each population by a 1 Mb non-overlap window. The individuals in European pigs were divided into EUD (n = 74) and EUW (n = 13), while Chinese indigenous pigs were divided into N (n = 171), CES (n = 193), ET (n = 215), S (n = 179) and WS (n = 253). Boxplots show the median, 25th, and 75th percentile, the whiskers indicate the minima and maxima, and the points laying outside the whiskers of boxplots represent the outliers. G The LD decay for Chinese domestic pigs and European pigs.
Fig. 4
Fig. 4. Admixture between Chinese domestic pig and European pig.
A Outgroup f3 (European domestic pigs, X; Warthog) results for five distinct Chinese domestic pig sub-groups, where X represents the different sub-groups. The individuals of the Chinese domestic pig used in this analysis are the same as in Fig. 3F. The data points are presented as estimated f3 statistics ± s.e. The horizontal bars represent ± 1 s.e. B Schematic diagram of the topology used for the first configuration of the DFOIL analyses applied to population ET. C The DFOIL analyses results of the first configuration for population ET (n = 5 × 1 × 10 × 9 when P3 represents an individual from population N; n = 5 × 1 × 10 × 11 when P3 represents CES; n = 5 × 1 × 10 × 9 when P3 represents S; n = 5 × 1 × 10 × 11 when P3 represents WS). Boxplots show median, 25th and 75th percentile, the whiskers indicate the minima and maxima, and the points laying outside the whiskers of boxplots represent the outliers. D Schematic diagram of the topology used for the second configuration of the DFOIL analyses applied to population ET. E The DFOIL analyses results of the second configuration for population ET (n = 5 × 1 × 10 × 9 when P1 represents an individual from population N; n = 5 × 1 × 10 × 11 when P1 represents CES; n = 5 × 1 × 10 × 9 when P1 represents S; n = 5 × 1 × 10 × 11 when P1 represents WS). Boxplots show the median, 25th, and 75th percentile, the whiskers indicate the minima and maxima, and the points laying outside the whiskers of boxplots represent the outliers. F Degree of introgression from the ET population into European domestic pigs. Five important genes affected by the top introgression signals are shown. The dashed horizontal line indicates the top 1% fd. G Discrete introgression regions in the PRKG1 gene. The top plot shows the fd from ET to European domestic pigs. The middle plot shows the pairwise nucleotide differences per site (dxy) between ET and European domestic pigs. The bottom plot shows the gene structure.
Fig. 5
Fig. 5. The admixture and demographic history of Chinese domestic pig.
A The f3 results for five distinct Chinese domestic pig sub-groups. The left and right y-axes represent source and target populations, respectively. The individuals of the Chinese domestic pig used in this analysis are the same as in Fig. 3F. The data points are presented as estimated f3 statistics ± s.e. The horizontal bars represent ± 1 s.e. B A heatmap showing f4(Warthog, X; Min pig, Wuzhishan pig), where X represents the different Chinese domestic pig populations. The map in this figure and the subsequent figure is imported from the public 42 domain Natural Earth project (https://www.naturalearthdata.com). C A heatmap showing f4(Warthog, X; Tibetan wild boar, Pudong White pig), where X represents the different Chinese domestic pig populations. D History of the effective population sizes of different sub-groups of Chinese domestic pigs.
Fig. 6
Fig. 6. Selection signatures and haplotype patterns of the high-altitude adaptation, small body size, and large ear size-related genes.
A The top diagram represents the selection signatures detected using the LSBL and θπ methods in the high-altitude adaptation-related gene, THSD7A. The bottom diagram shows the gene structure of the THSD7A gene. The red rectangle indicates the identified region under selection. B Haplotype patterns in regions under selection for THSD7A. Each row represents a phased haplotype, and each column represents a polymorphic SNP variant. The reference and alternative alleles are indicated in cream and red colors, respectively. C Phenotypic variations for ear size, represented by Dapulian (top) and Lantang (bottom) pigs. Images were sourced from the Animal Genetic Resources in China: pigs. D The top diagram represents the selection signatures detected using the LSBL and θπ methods in the large ear size-related gene, MSRB3. The bottom diagram represents the gene structure of MSRB3. The red rectangle represents the identified region under selection. E Haplotype patterns in regions in MSRB3 that are under selection. Each row represents a phased haplotype, and each column represents a polymorphic SNP variant. The reference and alternative alleles are indicated in cream and red colors, respectively. F The top diagram represents the selection signatures detected by LSBL and θπ methods in the small body size-related gene, RBFOX1. The bottom diagram shows the gene structure of RBFOX1. The red rectangle indicates the region under selection.
Fig. 7
Fig. 7. GWAS results for the biological traits of Chinese domestic pigs.
A GWAS results for coat color in solid black and non-black pigs. B GWAS results for gradient zone coat color. C GWAS results for body height. D GWAS results for body weight. All left-hand figures represent phenotypes (The images were sourced from the Animal Genetic Resources in China: pigs). All statistical tests were two-sided. In the Manhattan plots, the x-axis represents the chromosomal position, and the y-axis displays the −log10(P-value). The red line indicates the Bonferroni-corrected significance threshold at P = 2.29 × 10−9. In the quantile-quantile (QQ) plots, the x-axis shows the expected −log10(P-value), while the y-axis represents the observed −log10(P-value).

Similar articles

Cited by

References

    1. Frantz, L. et al. The evolution of Suidae. Annu. Rev. Anim. Biosci.4, 61–85 (2016). - PubMed
    1. Frantz, L. A. F., Madsen, O., Megens, H. J., Groenen, M. A. M. & Lohse, K. Testing models of speciation from genome sequences: divergence and asymmetric admixture in Island South-East Asian Sus species during the Plio-Pleistocene climatic fluctuations. Mol. Ecol.23, 5566–5574 (2014). - PMC - PubMed
    1. Groenen, M. A. M. et al. Analyses of pig genomes provide insight into porcine demography and evolution. Nature491, 393–398 (2012). - PMC - PubMed
    1. Frantz, L. A. F. et al. Genome sequencing reveals fine scale diversification and reticulation history during speciation in Sus. Genome Biol.14, R107 (2013). - PMC - PubMed
    1. Groenen, M. A. M. A decade of pig genome sequencing: a window on pig domestication and evolution. Genet. Sel. Evol.48, 10.1186/s12711-016-0204-2 (2016). - PMC - PubMed

Publication types

LinkOut - more resources