. 2024 Nov 22;15(1):10124.
doi: 10.1038/s41467-024-54243-9.

Microstructural asymmetry in the human cortex

Affiliations

Microstructural asymmetry in the human cortex

Bin Wan et al. Nat Commun. .

Abstract

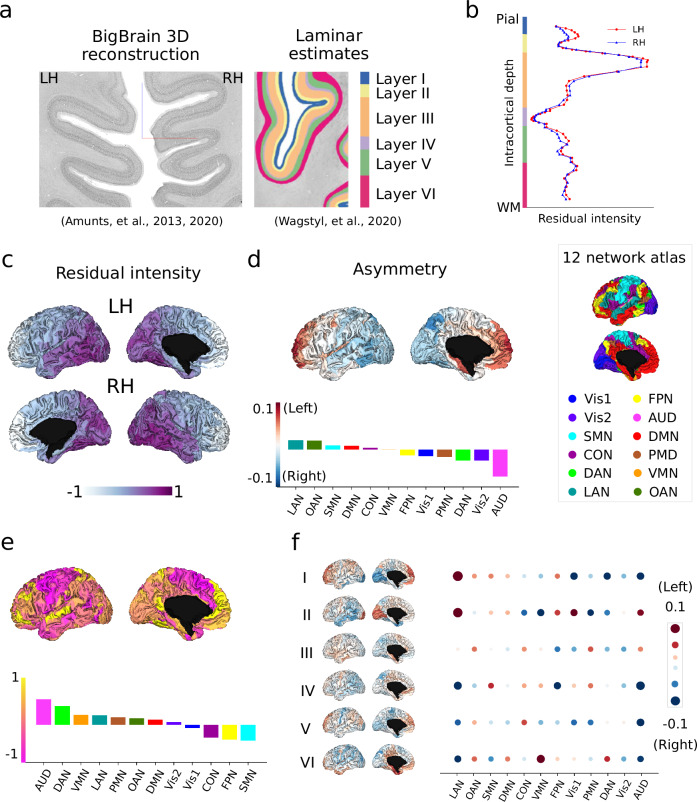
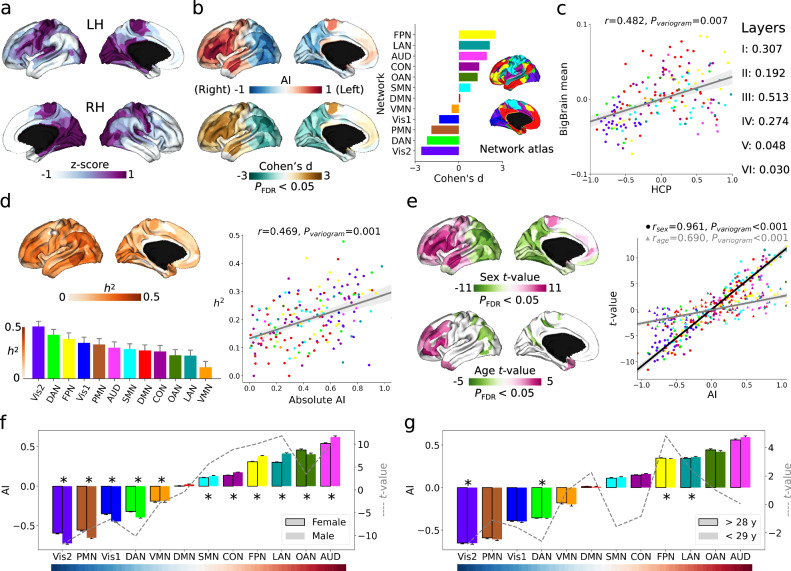
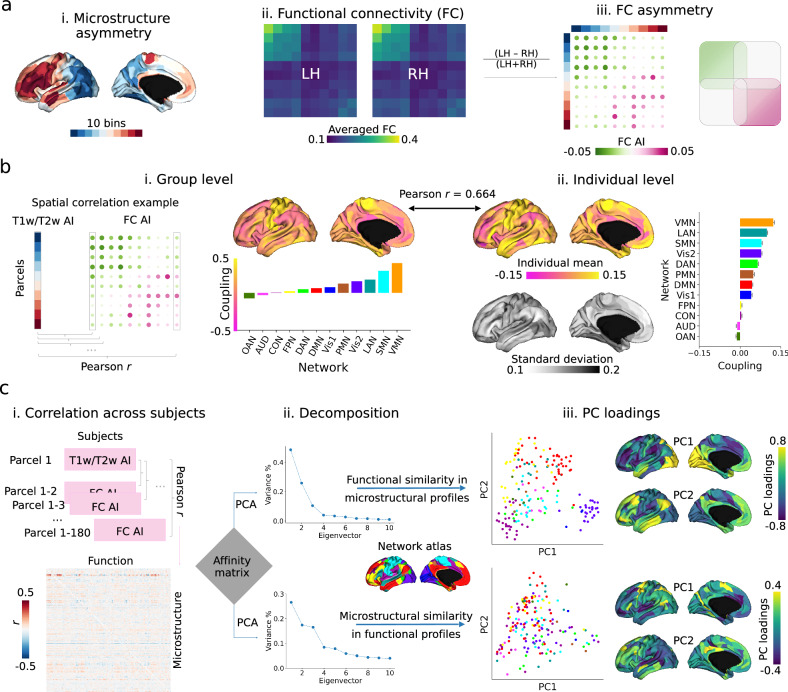
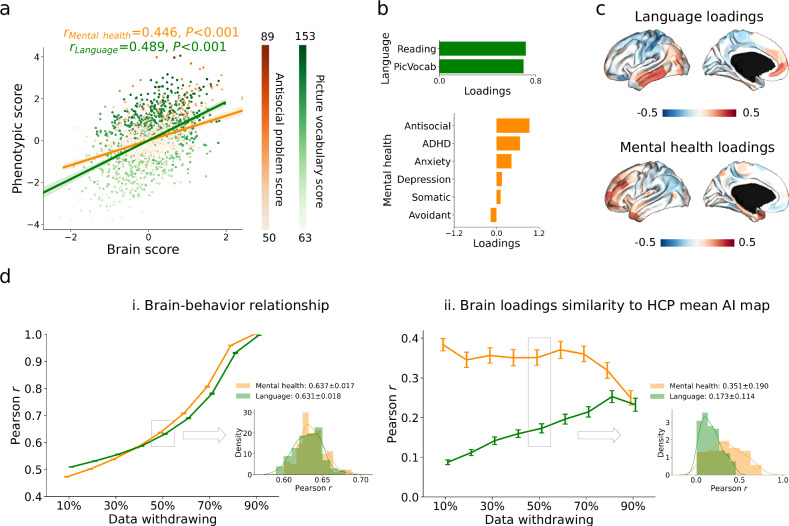
The human cerebral cortex shows hemispheric asymmetry, yet the microstructural basis of this asymmetry remains incompletely understood. Here, we probe layer-specific microstructural asymmetry using one post-mortem male brain. Overall, anterior and posterior regions show leftward and rightward asymmetry respectively, but this pattern varies across cortical layers. A similar anterior-posterior pattern is observed using in vivo Human Connectome Project (N = 1101) T1w/T2w microstructural data, with average cortical asymmetry showing the strongest similarity with post-mortem-based asymmetry of layer III. Moreover, microstructural asymmetry is found to be heritable, varies as a function of age and sex, and corresponds to intrinsic functional asymmetry. We also observe a differential association of language and markers of mental health with microstructural asymmetry patterns at the individual level, illustrating a functional divergence between inferior-superior and anterior-posterior microstructural axes, possibly anchored in development. Last, we could show concordant evidence with alternative in vivo microstructural measures: magnetization transfer (N = 286) and quantitative T1 (N = 50). Together, our study highlights microstructural asymmetry in the human cortex and its functional and behavioral relevance.


Conflict of interest statement

Competing interests: The authors declare no competing interests.

Figures

Fig. 1
Fig. 1. Microstructural asymmetry in BigBrain using cytoarchitecture (N = 1).
a BigBrain 3D histological reconstruction, and six-layer estimates. Source: https://bigbrainproject.org/maps-and-models.html. b Intracortical staining intensity profiles. Red and blue lines indicate the left and right hemispheres, respectively. c Mean intensity maps across 6 layers. d Mean asymmetry across layers. Red and blue indicate asymmetry index (AI) left > right and right > left. e Layer-wise AI for Bigbrain: six-layer parcel-wise AI brain maps and network-wise heatmap. f Skewness map across asymmetry along 60 points of intracortical depth. Atlas-defined networks include primary visual (Vis1), secondary visual (Vis2), somatomotor (SMN), cingulo-opercular (CON), dorsal attention (DAN), language (LAN), frontoparietal (FPN), auditory network (AUD), default mode (DMN), posterior multimodal (PMN), ventral multimodal (VMN), orbito-affective (OAN).
Fig. 2
Fig. 2. Microstructural asymmetry in Human Connectome Project (HCP) using T1w/T2w images (N = 1101).
a T1w/T2w intensity values for left and right hemispheres (Z-scored separately). Deeper purple indicates higher intensity. b The mean asymmetry index (AI) and related Cohen’s d maps calculated across subjects. Red/brown and blue/green indicate left- and right-ward asymmetry direction at populational level. AI was also summarized into functional networks with mean and standard error in the barplot. Cohen’s d map was thresholded at PFDR < 0.05 (two-sided). c Spatial correlation between mean HCP AI and BigBrain AI maps. A variogram permutation test was used to account for the spatial autocorrelation. Bold correlation with layer asymmetry indicates significance after variogram permutation at P < 0.05 level (two-sided). d Heritability map and network barplot (bar is standard error) estimated by individual variation of AI. The heritability map was thresholded at PFDR < 0.05 for multiple comparisons correction. Right panel is the spatial correlation between mean AI and heritability maps. e T-maps of sex and age effects in the model of AI = 1 + sex + age. Purple red indicates higher leftward asymmetry in females and in older people, respectively. Right panel is the spatial correlation between mean AI and t-value maps. Round and triangle dots represent sex and age. The t-maps were thresholded at PFDR < 0.05 for multiple comparisons correction. f and g plot the detailed sex and age effects in functional networks (AI mean and standard error). Dashed lines indicate t-value for sex and age, respectively. * indicates statistical significance after multiple comparisons (PFDR < 0.05). The colors of dots and bars in all plots reflect atlas-defined functional networks including primary visual (Vis1), secondary visual (Vis2), somatomotor (SMN), cingulo-opercular (CON), dorsal attention (DAN), language (LAN), frontoparietal (FPN), auditory network (AUD), default mode (DMN), posterior multimodal (PMN), ventral multimodal (VMN), orbito-affective (OAN).
Fig. 3
Fig. 3. Microstructure-function relationship in asymmetry using HCP T1w/T2w and resting state functional images (N = 1004).
ai 10 bins (18 parcels per bin) categorized from Fig. 2b mean AI map (T1w/T2w). a–ii. Group-level resting state functional connectivity (FC) matrix averaged by bins. a-iii. FC asymmetry calculated by (LH - RH)/(LH + RH) sorted by bins. Purple-red and green indicate left- and right-ward asymmetry. Scatters are colored by functional networks. b Region-wise microstructure-function coupling was calculated by Pearson correlation coefficient between 180 parcels of T1w/T2w and FC AI per column. Left panel shows coupling between mean maps at the group level (i) and the right panel shows mean and standard deviation of coupling (ii). c Individual covariation between microstructure and function. Matrix in (i) represents the Pearson r between parcel T1w/T2w AI and FC AI across subjects. Then, the parcel-wise affinity matrix was computed and principal component analysis (PCA) was employed to decompose the matrix to detect the inter-region similarity axes (ii). Upper and lower panels are microstructural and functional decomposition (iii). The first two eigenvectors and eigenvalues (PC loadings) are plotted with similar colors in ‘viridis’ indicating similar profiles between regions. Atlas-defined networks include primary visual (Vis1), secondary visual (Vis2), somatomotor (SMN), cingulo-opercular (CON), dorsal attention (DAN), language (LAN), frontoparietal (FPN), auditory network (AUD), default mode (DMN), posterior multimodal (PMN), ventral multimodal (VMN), orbito-affective (OAN).
Fig. 4
Fig. 4. Canonical correlation analysis (CCA) between microstructural asymmetry features and language/mental health in HCP.
a Correlation between latent dimensions of the brain and phenotype. Orange and green indicate mental health and language, where the latent dimensions explain antisocial behavior and picture vocabulary scores most. b Phenotypic loadings of the first latent dimension for language and mental health. c Brain loadings of the first latent dimension for language and mental health. d Resampling data to test the performance of CCA. We withdrew data from 10% to 90% by pseudo-randomization using twin classes and resampled 100 times. Mean and standard error bars were shown in the charts. Data withdrawal of 50% was selected to show the distribution across the 100 samples and other percentages see Supplementary Fig. S4. PicVocab: picture vocabulary; ADHD: attention deficit/hyperactivity disorder.

References

    1. Hartwigsen, G., Bengio, Y. & Bzdok, D. How does hemispheric specialization contribute to human-defining cognition? Neuron109, 2075–2090 (2021). - PMC - PubMed
    1. Hervé, P.-Y., Zago, L., Petit, L., Mazoyer, B. & Tzourio-Mazoyer, N. Revisiting human hemispheric specialization with neuroimaging. Trends Cogn. Sci.17, 69–80 (2013). - PubMed
    1. Ocklenburg, S. & Mundorf, A. Symmetry and asymmetry in biological structures. Proc. Natl Acad. Sci.119, e2204881119 (2022). - PMC - PubMed
    1. Toga, A. W. & Thompson, P. M. Mapping brain asymmetry. Nat. Rev. Neurosci.4, 37–48 (2003). - PubMed
    1. Vallortigara, G. & Rogers, L. J. A function for the bicameral mind. Cortex124, 274–285 (2020). - PubMed

Publication types

LinkOut - more resources