. 2024 Nov 22;15(1):10151.
doi: 10.1038/s41467-024-54577-4.

Matrix stiffness drives drop like nuclear deformation and lamin A/C tension-dependent YAP nuclear localization

Affiliations

Matrix stiffness drives drop like nuclear deformation and lamin A/C tension-dependent YAP nuclear localization

Ting-Ching Wang et al. Nat Commun. .

Abstract

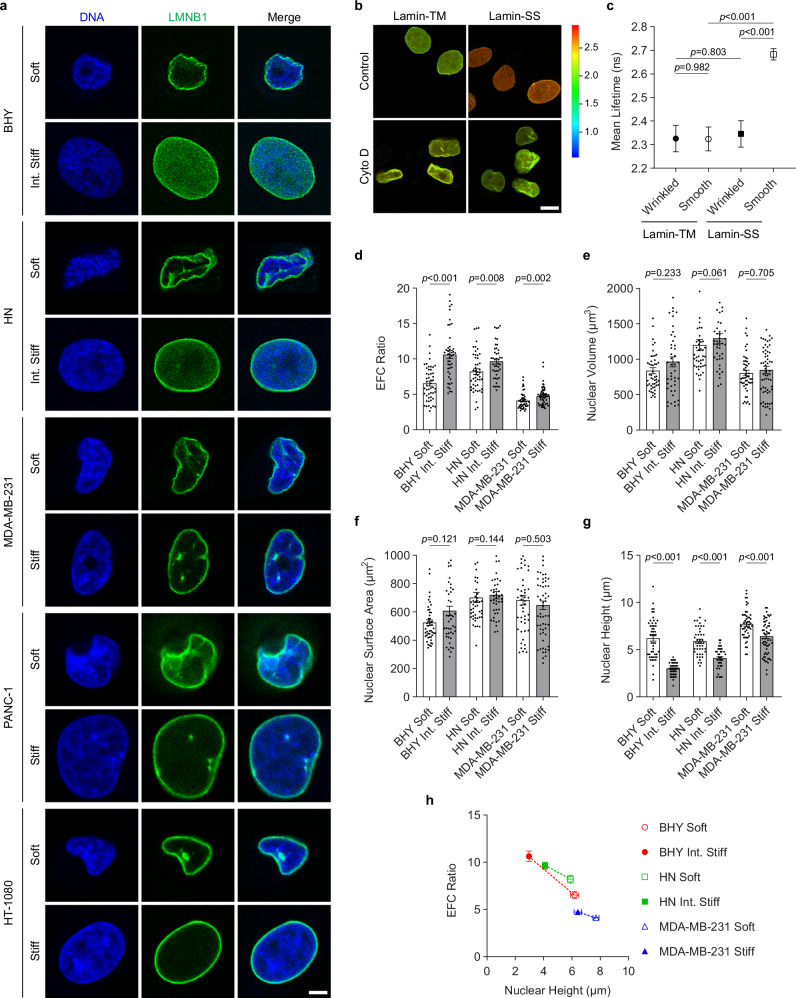
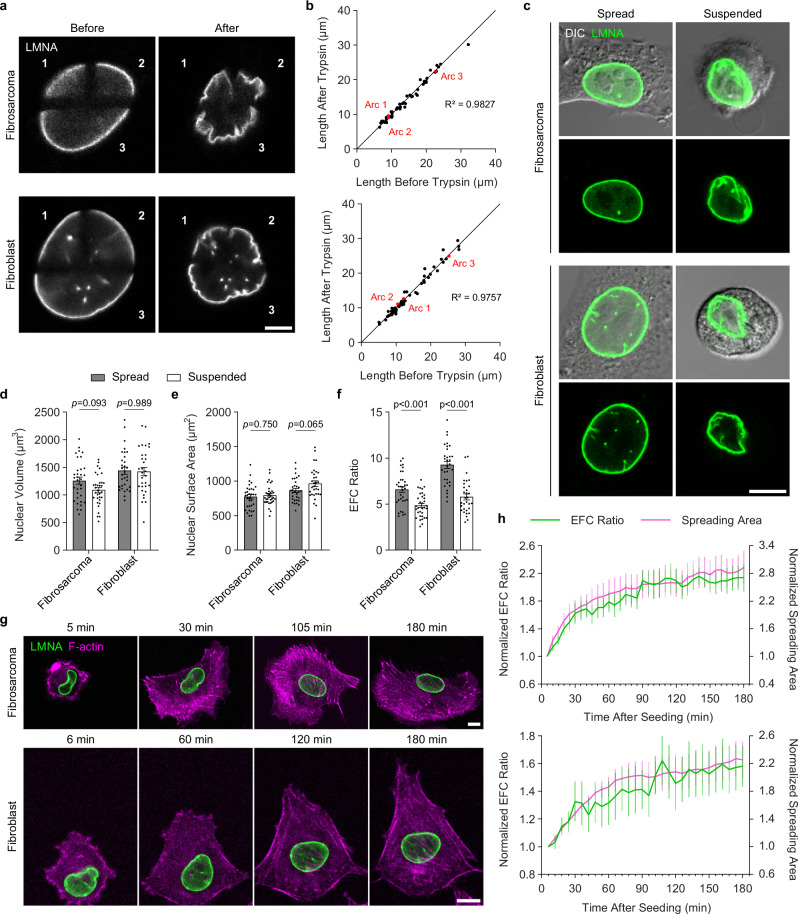
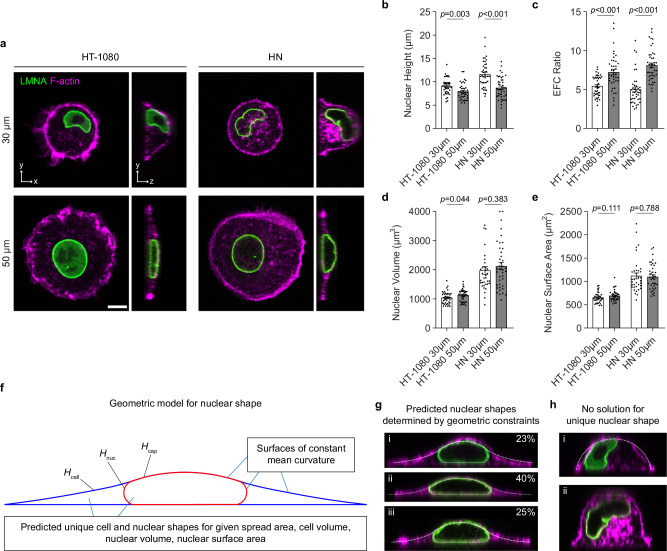
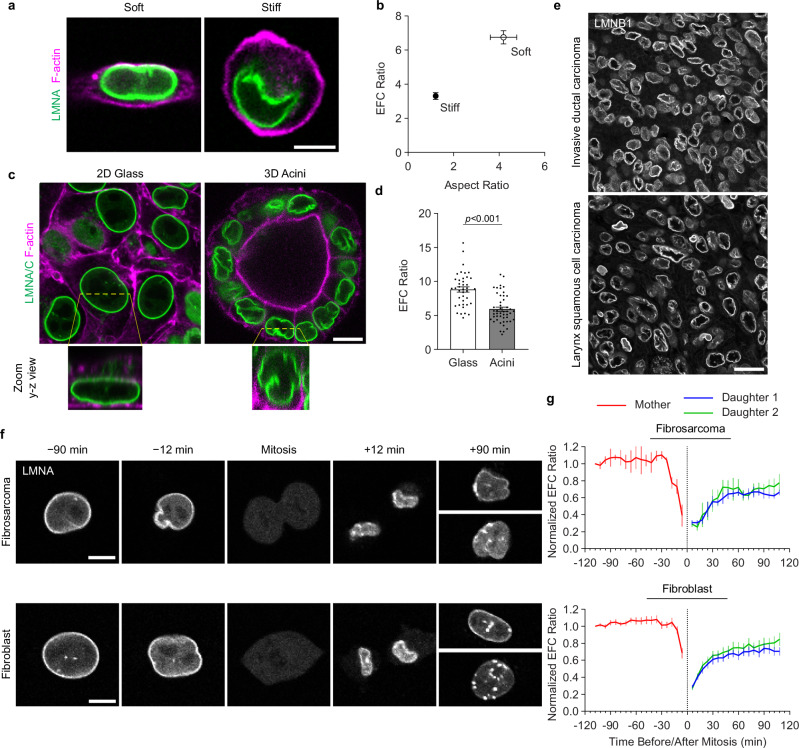
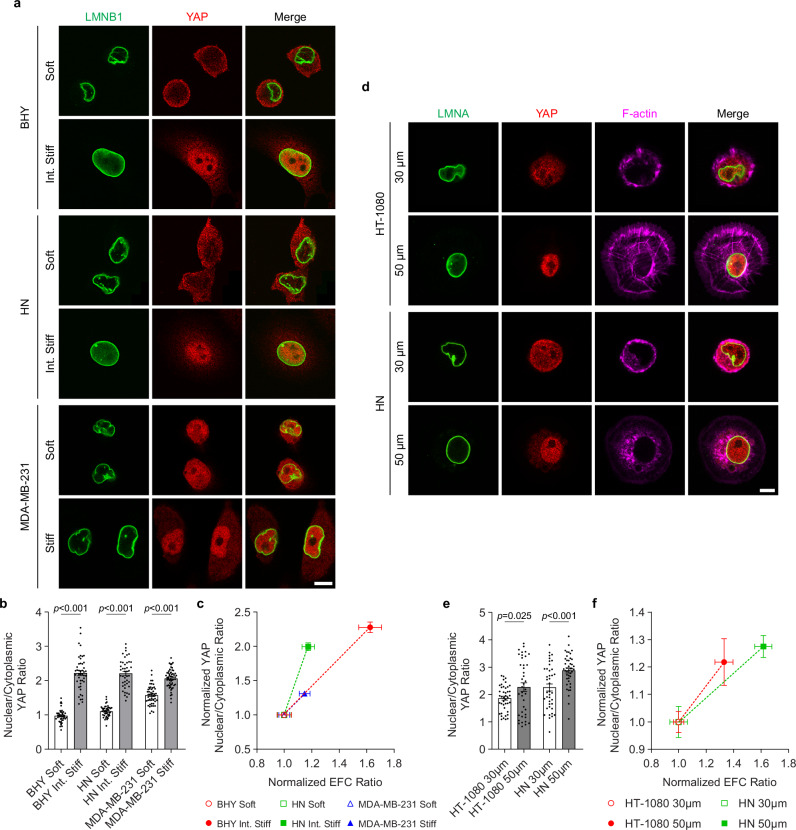
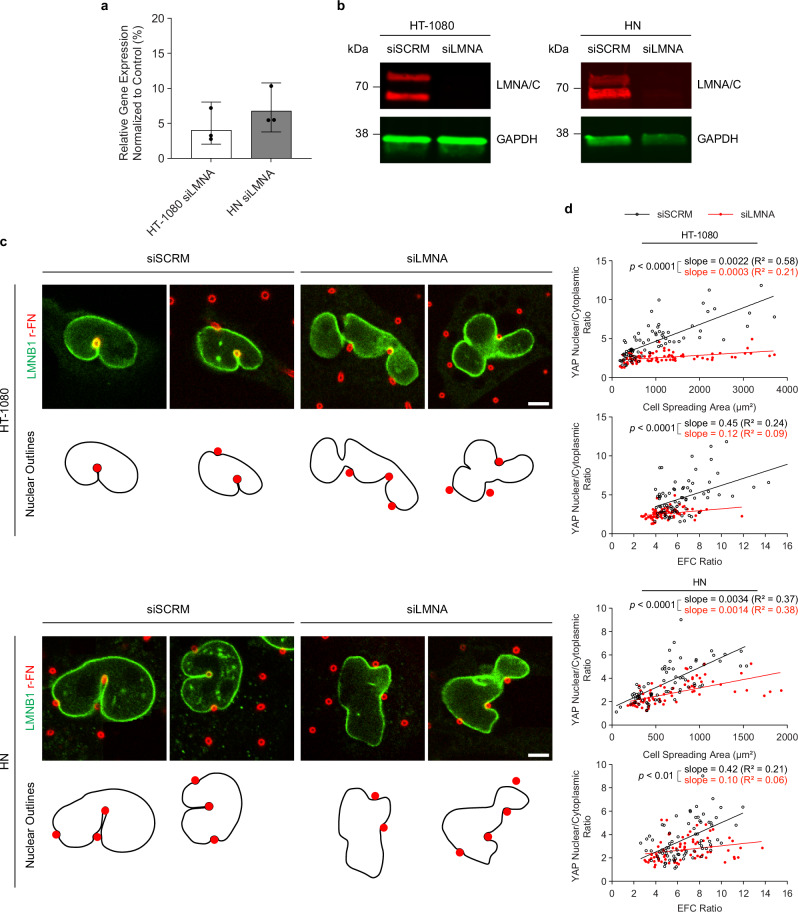
Extracellular matrix (ECM) stiffness influences cancer cell fate by altering gene expression. Previous studies suggest that stiffness-induced nuclear deformation may regulate gene expression through YAP nuclear localization. We investigated the role of the nuclear lamina in this process. We show that the nuclear lamina exhibits mechanical threshold behavior: once unwrinkled, the nuclear lamina is inextensible. A computational model predicts that the unwrinkled lamina is under tension, which is confirmed using a lamin tension sensor. Laminar unwrinkling is caused by nuclear flattening during cell spreading on stiff ECM. Knockdown of lamin A/C eliminates nuclear surface tension and decreases nuclear YAP localization. These findings show that nuclear deformation in cells conforms to the nuclear drop model and reveal a role for lamin A/C tension in controlling YAP localization in cancer cells.


Conflict of interest statement

Competing interests: The authors declare no competing interests.

Figures

Fig. 1
Fig. 1. Nuclear wrinkling is modulated by stiffness of the extracellular matrix (ECM).
a Confocal images of stained DNA (blue) and lamin B1 (LMNB1, green) in human cancer cells cultured on soft, intermediate (int.) stiff, or stiff hydrogels. The scale bar is 5 μm. b Fluorescence lifetime imaging microscopy (FLIM) images of MDCK cells expressing lamin A/C strain sensor (Lamin-SS) and truncated control sensor (Lamin-TM); cytochalasin D treatment (cyto D) induces wrinkles. The scale bar is 10 μm. c Plot compares donor fluorescence lifetimes between control (smooth) and cytochalasin D-treated nuclei (wrinkled). n = 12, 17, 13, 19 for the four groups shown on the x-axis. Error bars, SEM. p-values from the two-sided Mann–Whitney U-test. Quantification of d nuclear EFC ratio, e volume, f surface area, and g height is shown for BHY, HN, and MDA-MB-231 cells cultured on soft, intermediate stiff, or stiff hydrogels corresponding to (a). n = 50, 45, 44, 43, 50, 61 for the six groups shown on the x-axis, based on three replicates. Error bars, SEM. p-values from two-sided Mann–Whitney U-test. h The mean EFC ratio correlated with mean nuclear height is shown for BHY (red), HN (green), and MDA-MB-231 (blue) cells cultured on soft, intermediate stiff, or stiff hydrogels. n = 50, 45, 44, 43, 50, 61 for BHY soft, BHY int. stiff, HN soft, HN int. stiff, MDA-MB-231 soft, MDA-MB-231 stiff. Error bars, SEM.
Fig. 2
Fig. 2. Dynamic changes in laminar wrinkling are driven by cell rounding or spreading.
a Confocal images of photobleached GFP-LMNA (gray) expressing fibrosarcoma cells and fibroblasts before and after adding trypsin. Arcs separated by a T-shape photobleaching pattern are labeled with white numbers. The scale bar is 5 μm. b Quantification of arc length is shown for GFP-LMNA expressing fibrosarcoma cells (top) and fibroblasts (bottom) at 0 s and 40 s after adding trypsin. n = 20 and 20 for fibrosarcoma cells and fibroblasts, respectively. The arc examples in (a) are labeled in red. c Confocal images of GFP-LMNA (green) expressing fibrosarcoma cells and fibroblasts spread on glass substrates or suspended with trypsin. The scale bar is 10 μm. Corresponding quantification of d nuclear volume, e surface area, and f EFC ratio is shown for spread and suspended GFP-LMNA expressing fibrosarcoma cells and fibroblasts. n = 33, 33, 31, 31 for the four groups shown on the x-axis, based on three replicates. Error bars, SEM. p-values from the two-sided Mann–Whitney U-test. g Time-lapse confocal images of a GFP-LMNA (green) expressing fibrosarcoma cell and fibroblast spreading after seeding. F-actin (magenta) was stained with SPY650-FastAct. The scale bar is 10 μm. h Corresponding quantification of mean nuclear EFC ratio (green) and cell spreading area (magenta), both normalized to the corresponding value in the first time-frame, is shown for spreading fibrosarcoma cells (top) and fibroblasts (bottom). n = 12 and 9 for fibrosarcoma cells and fibroblasts, respectively, based on three replicates. Error bars, SEM.
Fig. 3
Fig. 3. Limiting nuclear shapes are quantitatively predicted by the nuclear drop model.
a Confocal images of F-actin (magenta) stained in HT-1080 and HN cells expressing GFP-LMNA (green) cultured on a 30 or 50 μm diameter fibronectin micropattern. The scale bar is 10 μm. Corresponding quantification of b nuclear height, c EFC ratio, d volume, and e surface area is shown for HT-1080 and HN cells cultured on 30 or 50 μm diameter fibronectin micropattern. n = 42, 40, 40, 43 for the four groups shown on the x-axis, based on three replicates. Error bars, SEM. p-values from the two-sided Mann–Whitney U-test. f Geometric model for cell and nuclear shapes based on the excess area of the lamina. For sufficiently spread cells, minimizing the surface area of the cortex under the constraints of a constant cell volume, nuclear volume, and nuclear surface area yields unique, geometrically determined cell (blue) and nuclear (red) shapes with surfaces of constant mean curvature. g Model predictions for cell and nuclear shapes are compared to experimental cell x-z profiles. The percent excess area, defined as the area in excess of that of a sphere of the same nuclear volume, is shown. For these calculations, nuclear volume, cell volume, and lamina area were treated as fitted parameters. h When the excess area is large enough, or the cell is insufficiently spread, cells are predicted to form a spherical cap with no unique geometric solution to the nuclear shape, which may have any number of irregular nuclear folds, wrinkles, or undulations.
Fig. 4
Fig. 4. Laminar wrinkling is sensitive to stiffness in three-dimensional (3D) culture and develops post mitosis.
a Confocal images of MDA-MB-231 cells expressing GFP-LMNA (green) stained with F-actin (magenta) in GelMA 3D culture. The scale bar is 10 μm. b Corresponding quantification of mean nuclear EFC ratio correlated to mean cell aspect ratio is shown for MDA-MB-231 cells expressing GFP-LMNA in GelMA 3D culture. n = 23 and 22 based on three replicates of soft (1–3 kPa) and stiff (10–15 kPa) gels, respectively. Error bars, SEM. c Confocal images of stained lamin A/C (green) and F-actin (magenta) in 344SQ lung cancer cells cultured on glass and acini in 3D Matrigel culture. The scale bar is 10 μm. d Corresponding quantification of nuclear EFC ratio is shown for 344SQ lung cancer cells cultured on glass and acini in a 3D Matrigel culture. n = 40 and 48 for 2D glass and 3D acini, respectively, based on three replicates. Error bars, SEM. p-values from the two-sided Mann–Whitney U-test. e Representative confocal images of lamin B1 (gray) stained in tumor microarray from n = 50 and 11 images of human invasive ductal carcinoma and larynx squamous cell carcinoma, respectively. The scale bar is 20 μm. f Time-lapse confocal images of a GFP-LMNA (gray) expressing fibrosarcoma cell and a fibroblast during cell mitosis. The scale bar is 10 μm. g Corresponding quantification of mean nuclear EFC ratio is shown for mother (red) and daughter cells (blue and green), normalized to the value in the first time-frame during cell mitosis. n = 4 and 15 for fibrosarcoma cells and fibroblasts, respectively, based on three replicates. Error bars, SEM.
Fig. 5
Fig. 5. Laminar wrinkling correlates inversely with YAP nuclear localization.
a Confocal images of stained lamin B1 (LMNB1, green) and YAP (red) in BHY, HN, and MDA-MB-231 cells cultured on soft and stiff hydrogels. The scale bar is 10 μm. b Quantification of nuclear to cytoplasmic YAP intensity ratio, correlated to nuclear EFC ratio (c) normalized to the corresponding value on soft hydrogels, is shown for BHY (red), HN (green), and MDA-MB-231 (blue) cells cultured on soft and stiff hydrogels. n = 50, 45, 44, 43, 50, 61 for the six groups shown on the x-axis, based on three replicates. Error bars, SEM. p-values from the two-sided Mann–Whitney U-test. d Confocal images of stained YAP (red) and F-actin (magenta) in GFP-LMNA (green) expressing HT-1080 and HN cells cultured on 30 and 50 μm diameter fibronectin micropattern. The scale bar is 10 μm. e Quantification of nuclear to cytoplasmic YAP intensity ratio, correlated to nuclear EFC ratio (f) normalized to the corresponding value on 30 μm pattern, is shown for HT-1080 (red) and HN (green) cells cultured on 30 and 50 μm diameter fibronectin micropattern. n = 42, 40, 40, 43 for the four groups shown on the x-axis, based on three replicates. Error bars, SEM. p-values from the two-sided Mann–Whitney U-test.
Fig. 6
Fig. 6. Lamin A/C is required for laminar surface tension and the sensitivity of YAP to laminar unfolding and cell spreading.
a Efficacy of siRNA-mediated knockdown of lamin A/C expression is shown for HT-1080 and HN cells. Expression of lamin A/C in siRNA-treated cells relative to control cells treated with scrambled siRNA (siSCRM) after normalization of all Ct values to GAPDH expression using the 2-∆∆Ct method. Data represents the mean from three biological replicates. Error bars, SD. b Immunoblotting of lamin A/C is shown for HT-1080 and HN cells transfected with siSCRM and siLMNA. c Confocal images of stained lamin B1 (green) in HT-1080 and HN cells transfected with siSCRM or siLMNA deforming around 5-μm-tall rhodamine-fibronectin-coated PDMS microposts (red). Nuclear outlines relative to the position of microposts are shown at the bottom. The scale bar is 5 μm. d Nuclear to cytoplasmic YAP intensity ratio, correlated to cell spreading area or nuclear EFC ratio, is shown for HT-1080 and HN cells cultured on soft and stiff hydrogels. n = 77, 83, 77, 73 for HT-1080 siSCRM, HT-1080 siLMNA, HN siSCRM, HN siLMNA, respectively. Slopes and R-squared values of linear fitting and p-values for slope comparisons using a one-tailed F-test are shown on the graphs.

Similar articles

Cited by

References

    1. Levental, K. R. et al. Matrix crosslinking forces tumor progression by enhancing integrin signaling. Cell139, 891–906 (2009). - PMC - PubMed
    1. Acerbi, I. et al. Human breast cancer invasion and aggression correlates with ECM stiffening and immune cell infiltration. Integr. Biol.7, 1120–1134 (2015). - PMC - PubMed
    1. Luthold, C., Hallal, T., Labbé, D. P. & Bordeleau, F. The extracellular matrix stiffening: a trigger of prostate cancer progression and castration resistance? Cancers14, 2887 (2022). - PMC - PubMed
    1. Lopez, J. I., Kang, I., You, W.-K., McDonald, D. M. & Weaver, V. M. In situforce mapping of mammary gland transformation. Integr. Biol.3, 910–921 (2011). - PMC - PubMed
    1. Wang, J. P. & Hielscher, A. Fibronectin: how its aberrant expression in tumors may improve therapeutic targeting. J. Cancer8, 674–682 (2017). - PMC - PubMed

Publication types

MeSH terms

LinkOut - more resources